. 2024 Oct;634(8032):45-47.
doi: 10.1038/s41586-024-07959-z. Epub 2024 Sep 18.

Mars's induced magnetosphere can degenerate

Affiliations

Mars's induced magnetosphere can degenerate

Qi Zhang et al. Nature. 2024 Oct.

Abstract

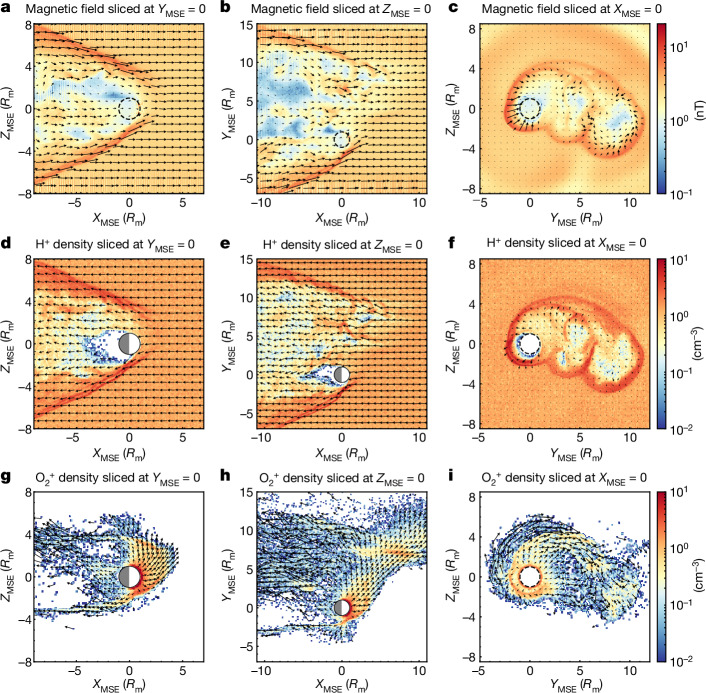
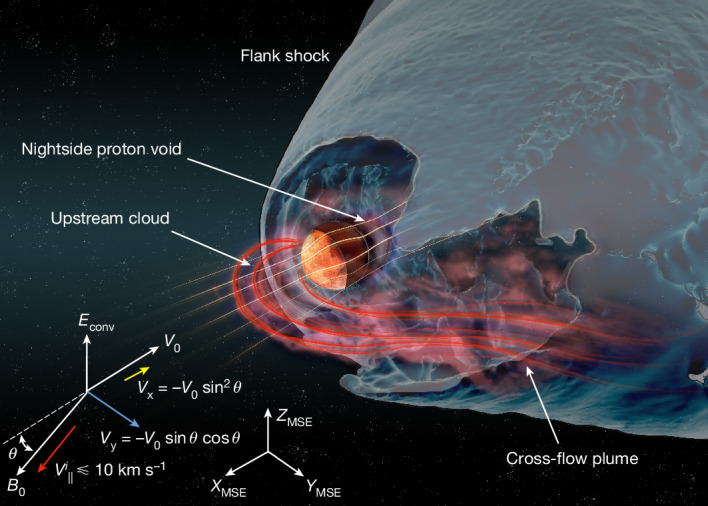
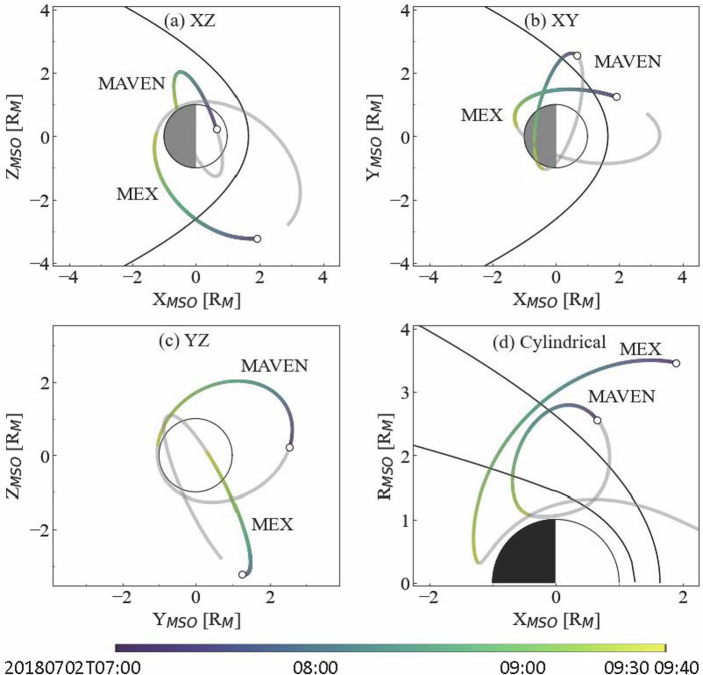
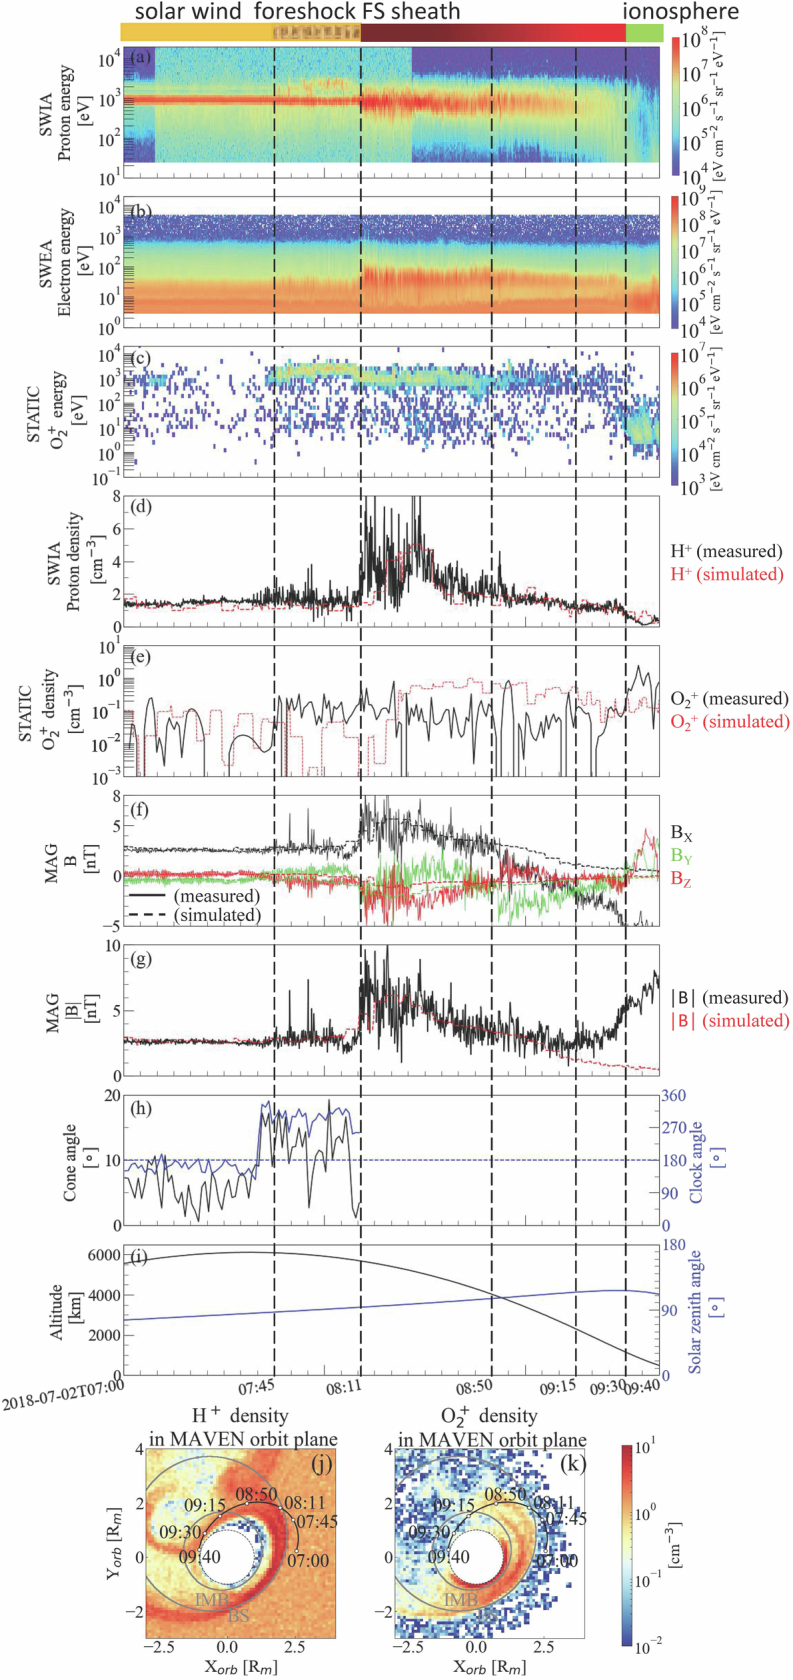
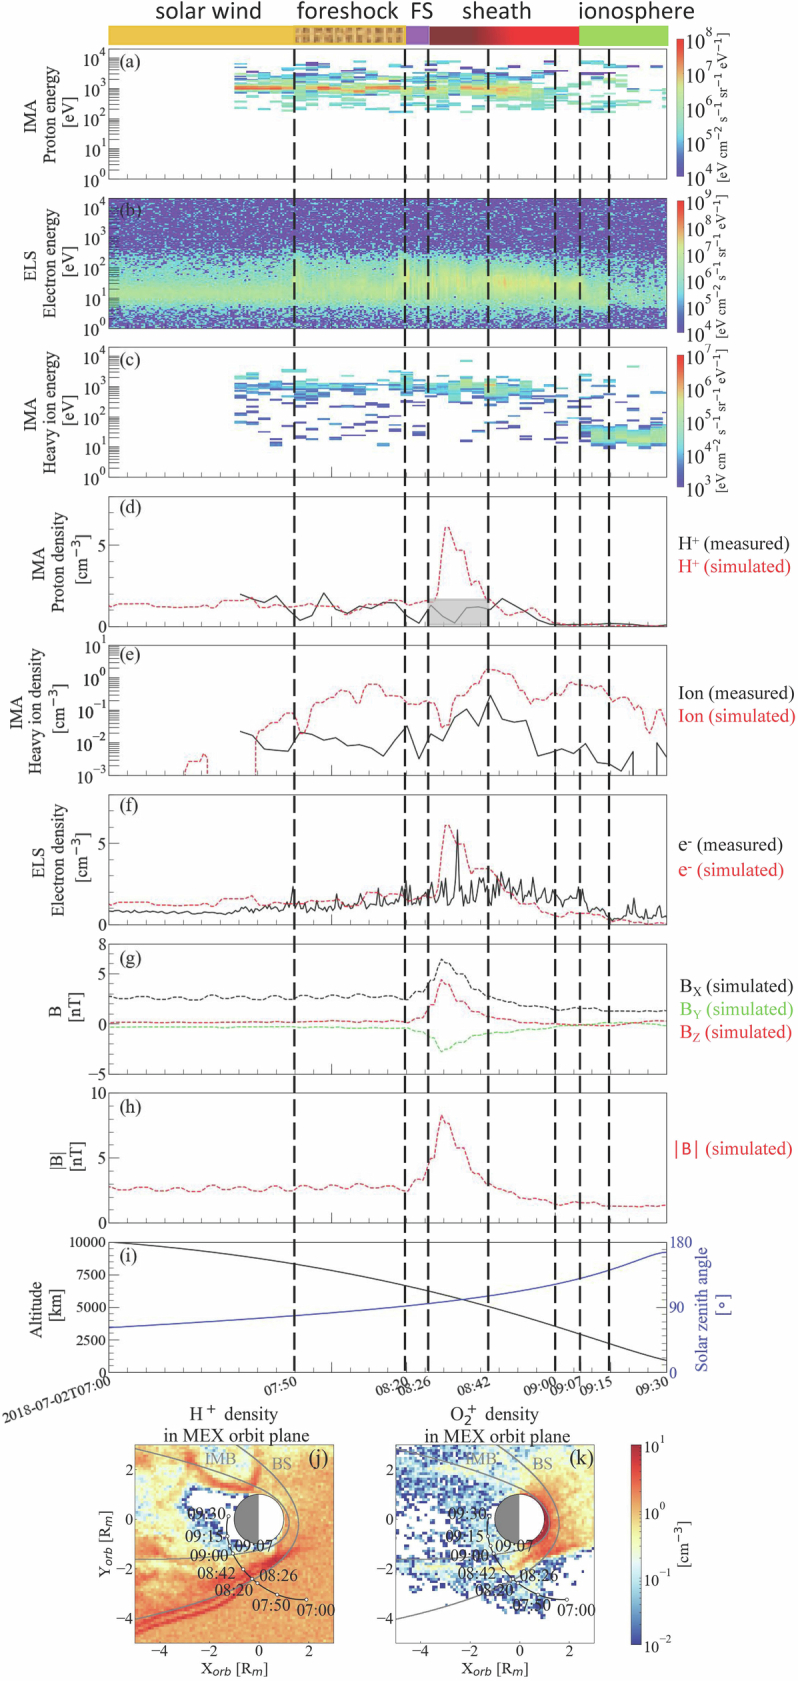
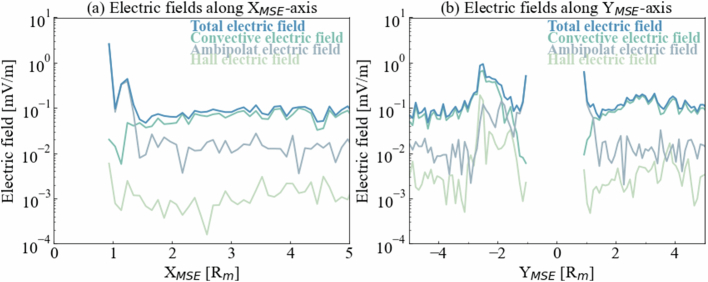
The interaction between planets and stellar winds can lead to atmospheric loss and is, thus, important for the evolution of planetary atmospheres1. The planets in our Solar System typically interact with the solar wind, whose velocity is at a large angle to the embedded stellar magnetic field. For planets without an intrinsic magnetic field, this interaction creates an induced magnetosphere and a bow shock in front of the planet2. However, when the angle between the solar wind velocity and the solar wind magnetic field (cone angle) is small, the interaction is very different3. Here we show that when the cone angle is small at Mars, the induced magnetosphere degenerates. There is no shock on the dayside, only weak flank shocks. A cross-flow plume appears and the ambipolar field drives planetary ions upstream. Hybrid simulations with a 4° cone angle show agreement with observations by the Mars Atmosphere and Volatile Evolution mission4 and Mars Express5. Degenerate, induced magnetospheres are complex and not yet explored objects. It remains to be studied what the secondary effects are on processes like atmospheric loss through ion escape.


Conflict of interest statement

The authors declare no competing interests.

Figures

Fig. 1
Fig. 1. Simulation results.
ac, Magnetic field strength and direction projected in the plane shown: YMSE = 0 (a), ZMSE = 0 (b) and XMSE = 0 (c). df, Proton density: YMSE = 0 (c), ZMSE = 0 (d) and XMSE = 0 (e). gi, O2+ density: YMSE = 0 (g), ZMSE = 0 (h) and XMSE = 0 (i). The black arrows represent the direction of ion flow. Axes are scaled by the Mars radius, Rm.
Fig. 2
Fig. 2. Artist’s impression.
Main domains and boundaries of the degenerate magnetosphere and the near-Mars environment for a near-parallel IMF. MSE coordinate axes and key vectors are shown for reference (not to scale). See text for notation.
Extended Data Fig. 1
Extended Data Fig. 1. Trajectories of MAVEN and MEX in the MSO coordinate system (the x-axis is directed to the sun, the y-axis is in the Mars orbital plane, perpendicular to the x-axis and opposite to Mars’ motion, and the z-axis completes the right-handed coordinate system).
The colored inbound part of the orbits represents the time interval of this study. The circles show the starting points of the observations. The black lines show the nominal bow shock and induced magnetosphere boundary (IMB) locations as derived by Trotignon et al.. The colorbar at the bottom denotes the time.
Extended Data Fig. 2
Extended Data Fig. 2. MAVEN observation and comparison with simulation.
The panels show (a) SWIA proton energy spectrum; (b) SWEA electron energy spectrum; (c) STATIC O2+ energy spectrum; (d) SWIA and simulated (dashed red line) proton density; (e) STATIC and simulated (dashed red line) O2+ density; (f) MAG and simulated (dashed lines) magnetic field vector; (g) MAG and simulated (dashed red line) magnetic field magnitude; (h) cone angle between the solar wind velocity and the interplanetary magnetic field (IMF), and clock angle is the IMF counterclockwise angle from + y-axis in the MSO coordinate; (i) spacecraft altitude and solar zenith angle. The vertical dashed lines mark out the time stamps for the comparison between the measurements and model. Panels at the bottom show the simulated proton density (j) and O2+ density (k) in the MAVEN orbit plane. The black lines are the MAVEN trajectories. The grey lines are the nominal bow shock and IMB projected in MAVEN orbit plane. The colorbar at the top denotes different plasma domains identified from the measurements. No IMB is identified.
Extended Data Fig. 3
Extended Data Fig. 3. MEX observation and comparison with simulation.
The panels show (a) IMA proton energy spectrum; (b) ELS electron energy spectrum; (c) IMA heavy ion energy spectrum; (d) IMA and simulated (dashed red line) proton density; (e) IMA and simulated (dashed red line) heavy ion density; (f) ELS and simulated (dashed red line) electron density; (g) simulated magnetic field vector; (h) simulated magnetic field magnitude; (i) spacecraft altitude and solar zenith angle. The vertical dashed lines mark out the time stamps for the comparison between measurements and model. Panels at the bottom show the simulated proton density (j) and O2+ density (k) in the MEX orbit plane. The black lines are the MEX trajectories. The grey lines are the nominal bow shock and IMB projected in MEX orbit plane. The grey block in (d) indicates the solar wind obscured. The colorbar at the top defines the regions identified from the measurement. No IMB is identified.
Extended Data Fig. 4
Extended Data Fig. 4. Simulation results of the electric fields, including the total electric field and the three terms.
the convective electric field, the ambipolar electric field and the Hall electric field, along XMSE-axis and YMSE-axis.

References

    1. Ramstad, R. & Barabash, S. Do intrinsic magnetic fields protect planetary atmospheres from stellar winds? Space Sci. Rev.217, 36 (2021).
    1. Slavin, J. A. & Holzer, R. E. Solar wind flow about the terrestrial planets. I. Modeling bow shock position and shape. J. Geophys. Res.: Space Phys.86, 11401–11418 (1981).
    1. Dubinin, E. et al. Toroidal and poloidal magnetic fields at Venus. Venus Express observations. Planet. Space Sci.87, 19–29 (2013).
    1. Jakosky, B. M. et al. Loss of the Martian atmosphere to space: present day loss rates determined from MAVEN observations and integrated loss through time. Icarus315, 146–157 (2018).
    1. Barabash, S. et al. The analyzer of space plasmas and energetic atoms (ASPERA-3) for the Mars Express mission. Space Sci. Rev.126, 113–164 (2006).

LinkOut - more resources