. 2024 Dec;8(12):2286-2296.
doi: 10.1038/s41559-024-02545-y. Epub 2024 Sep 18.

Migratory lifestyle carries no added overall energy cost in a partial migratory songbird

Affiliations

Migratory lifestyle carries no added overall energy cost in a partial migratory songbird

Nils Linek et al. Nat Ecol Evol. 2024 Dec.

Abstract

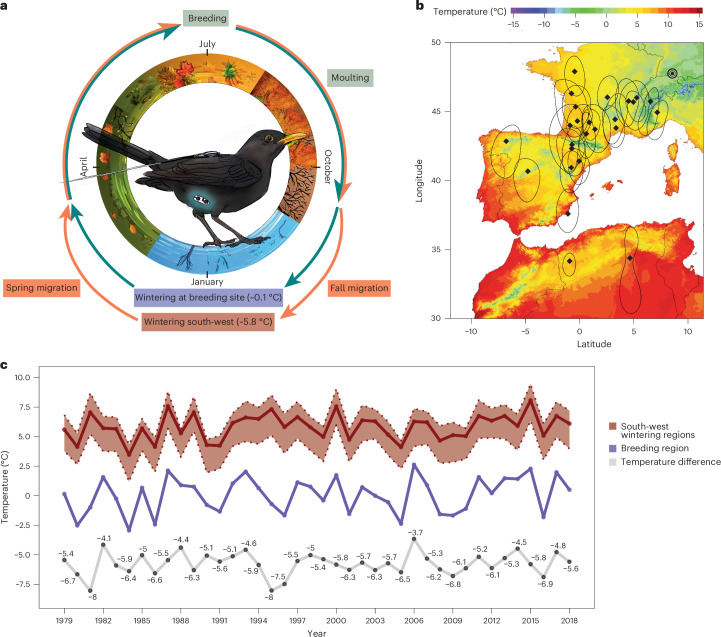
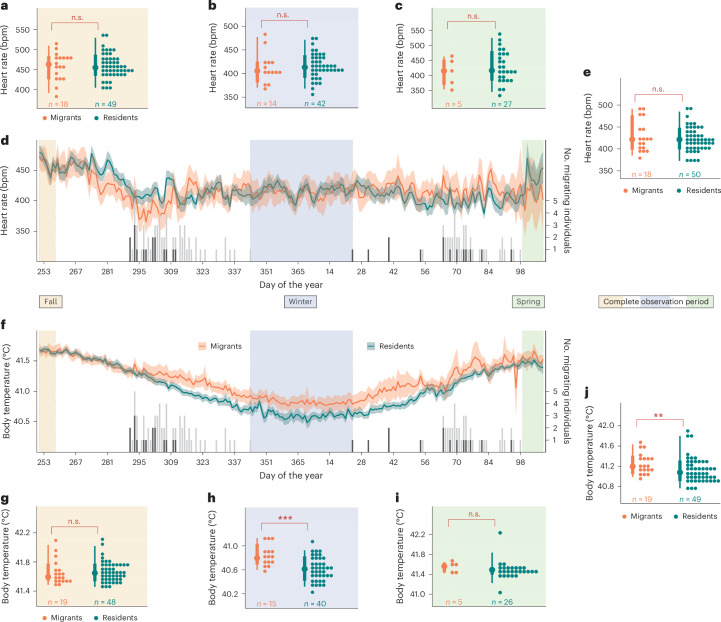
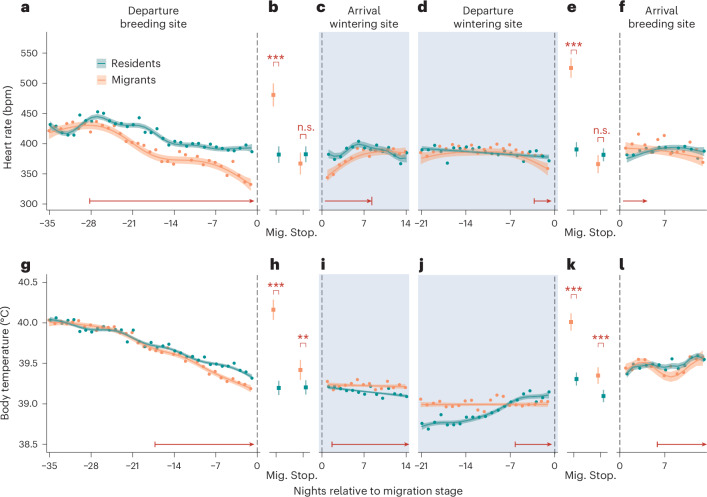
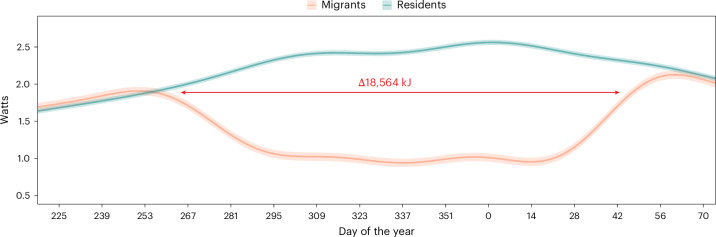
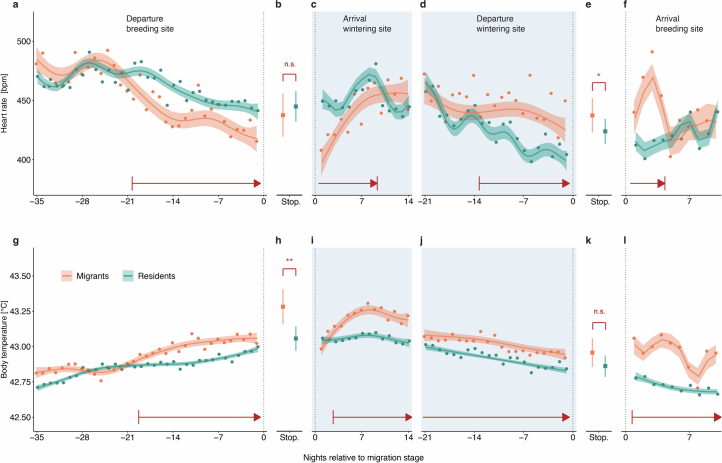
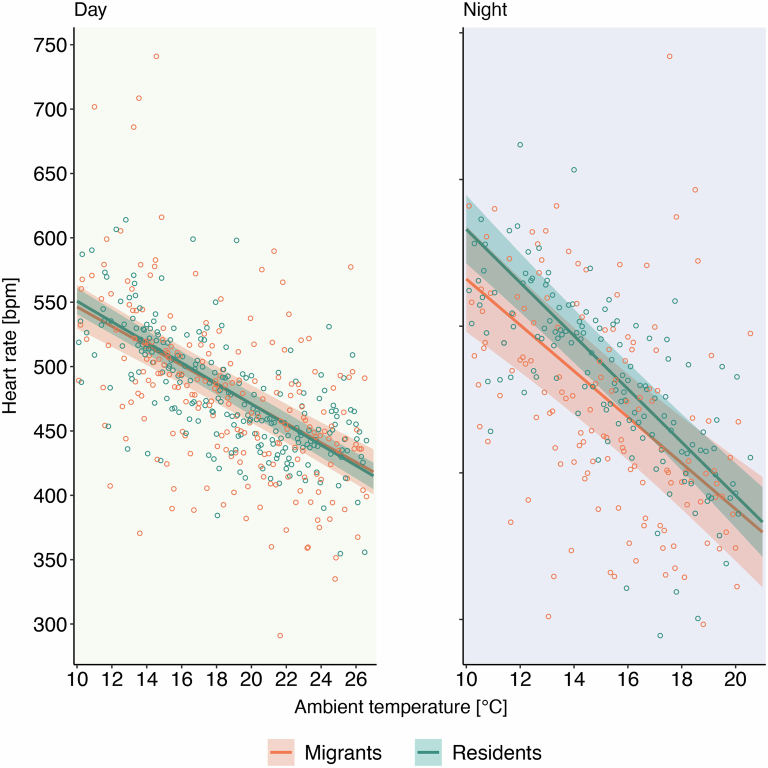
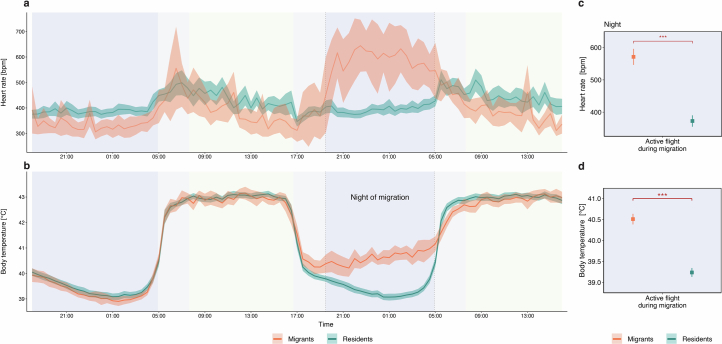
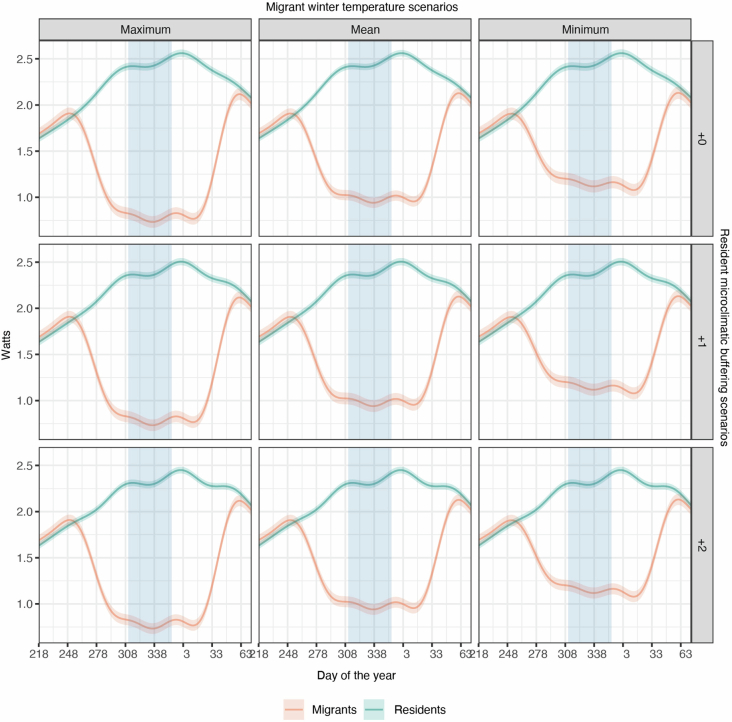
Seasonal bird migration may provide energy benefits associated with moving to areas with less physiologically challenging climates or increased food availability, but migratory movements themselves may carry high costs. However, time-dynamic energy profiles of free-living migrants-especially small-bodied songbirds-are challenging to measure. Here we quantify energy output and thermoregulatory costs in partially migratory common blackbirds using implanted heart rate and temperature loggers paired with automated radio telemetry and energetic modelling. Our results show that blackbirds save considerable energy in preparation for migration by decreasing heart rate and body temperature 28 days before departure, potentially dwarfing the energy costs of migratory flights. Yet, in warmer wintering areas, migrants do not appear to decrease total daily energy expenditure despite a substantially reduced cost of thermoregulation. These findings indicate differential metabolic programmes across different wintering strategies despite equivalent overall energy expenditure, suggesting that the maintenance of migration is associated with differences in energy allocation rather than with total energy expenditure.


Conflict of interest statement

Competing interests: The authors declare no competing interests.

Figures

Fig. 1
Fig. 1. Study system and temperature conditions.
a, Illustration of the experimental setup with a common blackbird (Turdus merula) carrying a radio transmitter backpack and an implanted fH and temperature logger. The surrounding seasonal cycle highlights the main phases during the year for both wintering strategies. b, Temperature map for south-west Europe with known breeding and wintering sites of previously studied migratory blackbirds (N = 25) of the same population as the birds in the current study. The temperature gradient represents the mean Ta during December and January in south-west Europe. The black triple circle depicts the breeding site and single black diamonds and black outlines (25% kernel utilization distribution) represent the centroid of wintering sites estimated by using geolocators of blackbirds from the same breeding area from a previous study. c, Comparison of temperatures between wintering sites and breeding site during winter. The mean Ta during winter (3 December to 17 January) at wintering sites (red, including the lower 25th and upper 75th quantiles) and at the breeding site (blue) over 39 years. The grey line underneath represents the mean temperature difference and calculated value between both location types.
Fig. 2
Fig. 2. Temporal comparison of fH and Tb between overwintering strategies with depicted individual migration events.
aj, The mean fH (ae) and Tb (fj) over time (d and f) and during distinct time periods (a, b, c, e and g–j) are displayed for both wintering strategies with 95% confidence intervals. The black/grey histograms mark the number of individuals migrating each night: the black bars depict the number of individuals on their first night of migration and the grey bars show the number of individuals on subsequent migration nights (right y axis). The ochre time frame in the first week of the experiment highlights the fall period that precedes the initial departures by at least 30 days. The middle blue area between the last fall migration event and the first spring migration marks the core winter period, while the green marked period defines the spring period, which starts with the return of the last migrant to the breeding area. The dots mark individual means in fall for a and g, winter for b and h, spring for c and i and the whole timeframe for e and j, next to the coloured bars showing distribution within each wintering strategy (mean, and 75% and 25% percentiles). Sample sizes are shown below each group. Significant differences, derived from a linear mixed model with Bonferroni correction (Supplementary Table 1 and Supplementary Results) are indicated by asterisks: ***P < 0.001, **P < 0.01, *P < 0.05 and ‘non-significant (n.s.)’ where P > 0.05.
Fig. 3
Fig. 3. fH and Tb in different stages relative to migration.
af, Mean fH (ae) and Tb (gl) in seperate chronological stages in relation to migration, are shown as points during night across all migrants (orange) and all residents (dark green) centred on departure date from breeding site relative to initial departure (a and g), migration (Mig.) and stopover (Stop.) (b and h) in fall, centred on arrival date in wintering site (c and i), centred on departure date from wintering site relative to spring departure (d and j), migration and stopover in spring (e and k) and centred on arrival date on breeding site (f and l). For all measurements over time (a, c, d, f, g and il), the vertical dashed line marks the point of reference, while each single point represents the mean value across each overwintering strategy, with migrants centred and residents correspondingly assigned (Methods). The coloured solid line shows predicted fH and Tb values for each strategy derived from a GAMM, including individual measurements for each bird (Supplementary Tables 2–7 and Supplementary Results). Correspondingly coloured ribbons show the 95% confidence interval of those predictions. The blue-marked periods highlight the time when migratory birds reside in their final wintering grounds. The horizontal red arrows mark the first and last times when measures significantly differ between strategies. For migration stage-centred comparisons via linear mixed models (b, e, h and k), the means are shown as coloured squares with standard error bars. Bonferroni corrected statistical significance levels: ***P < 0.001, **P < 0.01, *P < 0.05 and ‘non-significant (n.s.)’ where P > 0.05.
Fig. 4
Fig. 4. Thermoregulatory simulation model.
Thermoregulatory simulation showing differential energy expenditures for migrant and resident blackbirds. The predicted energy expense of thermoregulation (lines) and 95% confidence intervals (ribbons) for both migrant and resident phenotypes derived from GAMM. Thermoregulatory metabolism is estimated on the basis of observed Ta and Tb (Methods). The periods, where confidence intervals do not overlap, indicate significantly different energetic expense of thermoregulation.
Extended Data Fig. 1
Extended Data Fig. 1. Comparison of heart rate and body temperature between strategies relative to migration stages during day.
a-f, Mean heart rate and g-l, body temperature are shown as points during day across all migrants (orange) and all residents (dark green) centred on departure date from breeding site relative to initial departure (a,g), stopover (b,h) in fall, centred on arrival date in wintering site (c,i), centred on departure date from wintering site relative to spring departure (d,j), stopover in spring (e,k), centred on arrival date on breeding site (f,l). For all measurements over time (a,c,d,f,g,i,j,k,l), each single point represents the mean value across each overwintering strategy, with migrants centred and residents correspondingly assigned. The coloured solid line shows predicted heart rate and body temperature values for each strategy derived from a generalised additive mixed model, including individual measurements for each bird. Correspondingly coloured ribbons show the 95% confidence interval of those predictions. Blue-marked periods highlight the time when migratory birds reside in their final wintering grounds. Horizontal red arrows mark the first and last times when measures significantly differ between strategies. For migration stage-centered comparisons via linear mixed models (b,e,h,k), means are shown as colored squares with standard error bars (SEM). Bonferroni corrected statistical significance levels: *** = p < 0.001, ** = p < 0.01, * = p < 0.05, and ‘n.s.’ = p > 0.05.
Extended Data Fig. 2
Extended Data Fig. 2. Visualization of reactions in HRT to different ambient temperatures for both wintering strategies.
Mean heart rate of resident and migratory blackbirds in relation to ambient temperature during day and night. Plotted circles are fH mean values for all occurring temperatures during fall (1st Sep.–7th Sep.). Lines are predicted values of the calculated linear mixed model (Supplementary Table 10) with respective 95% confidence intervals as ribbons around them.
Extended Data Fig. 3
Extended Data Fig. 3. Heart rate and body temperature relative to the initial migratory departure.
a, Mean heart rate and b, body temperature in 30-minute intervals over 2 consecutive hours with 95% confidence interval bands for migrants and residents relative to the initial migratory departure of the migrants. Data of resident birds have been individually aligned to birds of the same sex and at the same date and time. The light blue periods mark night-time for all fall migrants, orange periods mark daytime, and light grey periods in between are estimated dusk and dawn phases, depending on the exact departure date. c, Comparison of mean predicted heart rate and (d) mean body temperature via linear mixed model between migrants and residents with 95% confidence interval bars. Significant differences, derived from a linear mixed model and Bonferroni corrected (see Supplementary Data Table 1 and Supplementary Results) are indicated by asterisks: *** = p < 0.001, ** = p < 0.01, * = p < 0.05, and ‘n.s.’ = p > 0.05. Analysed data include only active flight periods during migration nights from initial departure up to final arrival returning at the breeding site.
Extended Data Fig. 4
Extended Data Fig. 4. Alternative thermoregulatory scenarios.
Energetic expenditures on thermoregulation over time across migrant and resident blackbirds. To quantify the sensitivity of our findings to alternative Ta timeseries, we considered alternatives for both overwintering residents as well as migrants. For migrants we considered Ta timeseries comprised of the mean Ta across the winter range (top middle, primary result in main text) but also considered 25% and 75% temperature quantiles from across the range on each day. On the breeding grounds, the ambient temperature is better estimated but does not include the potential for buffering via the disproportionate use of warmer micro-climates. Thus, we considered two extreme alternative scenarios wherein we inflated the Ta for wintering residents (but not for migrants) by one and two degrees (rows). Blue shaded area denotes the core winter period.

References

    1. Newton, I. The Migration Ecology of Birds (Academic Press, 2007).
    1. Somveille, M., Rodrigues, A. S. L. & Manica, A. Energy efficiency drives the global seasonal distribution of birds. Nat. Ecol. Evol.2, 962–969 (2018). - PubMed
    1. Winger, B. M., Auteri, G. G., Pegan, T. M. & Weeks, B. C. A long winter for the Red Queen: rethinking the evolution of seasonal migration. Biol. Rev. Camb. Philos. Soc.94, 737–752 (2019). - PubMed
    1. Newton, I. & Dale, L. Relationship between migration and latitude among West European birds. J. Anim. Ecol.65, 137 (1996).
    1. Petit, M., Clavijo-Baquet, S. & Vézina, F. Increasing winter maximal metabolic rate improves intrawinter survival in small birds. Physiol. Biochem. Zool.90, 166–177 (2017). - PubMed

LinkOut - more resources