. 2024 Sep;56(9):2065-2081.
doi: 10.1038/s12276-024-01300-4. Epub 2024 Sep 18.

Crosstalk between FTH1 and PYCR1 dysregulates proline metabolism and mediates cell growth in KRAS-mutant pancreatic cancer cells

Affiliations

Crosstalk between FTH1 and PYCR1 dysregulates proline metabolism and mediates cell growth in KRAS-mutant pancreatic cancer cells

Ji Min Park et al. Exp Mol Med. 2024 Sep.

Erratum in

Abstract

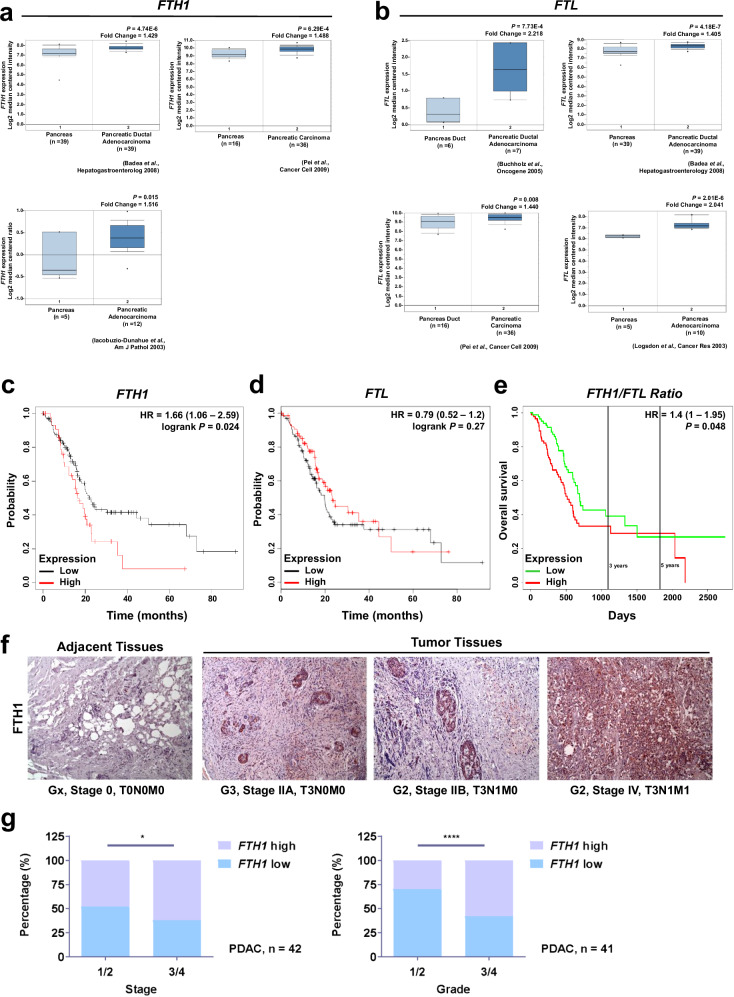
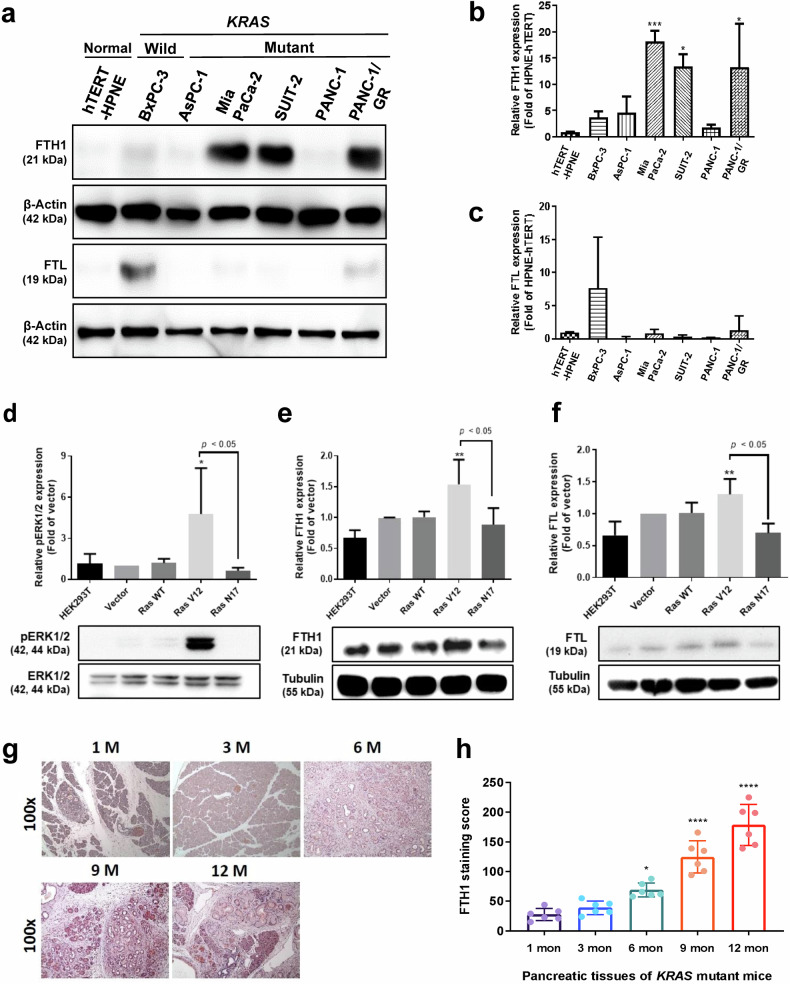
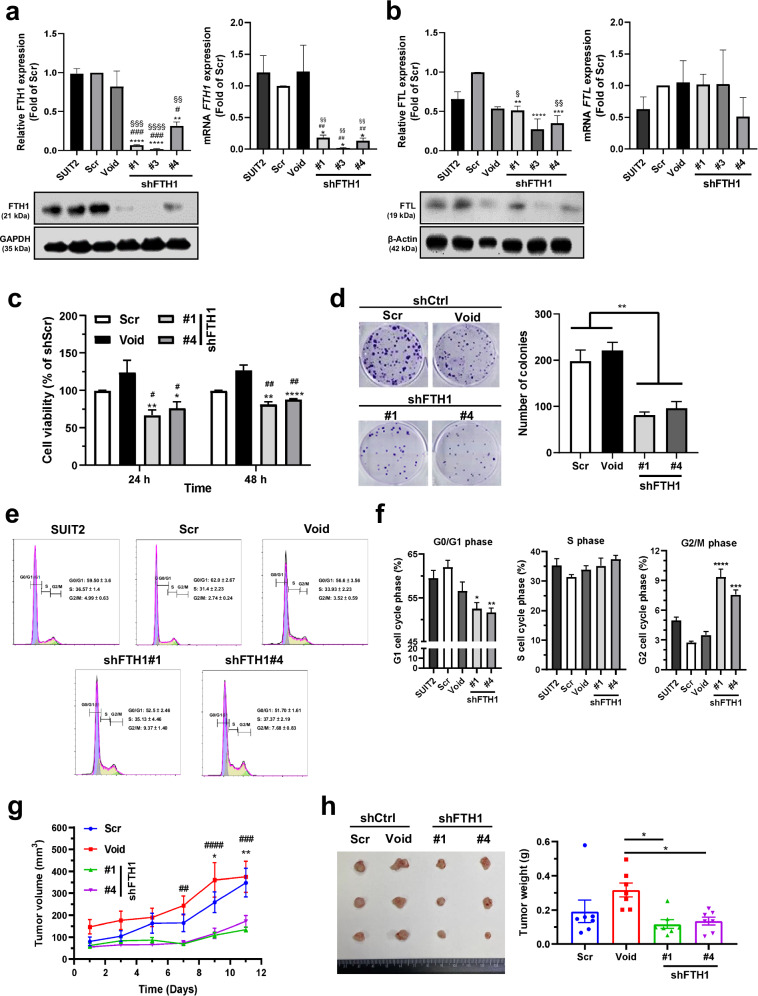
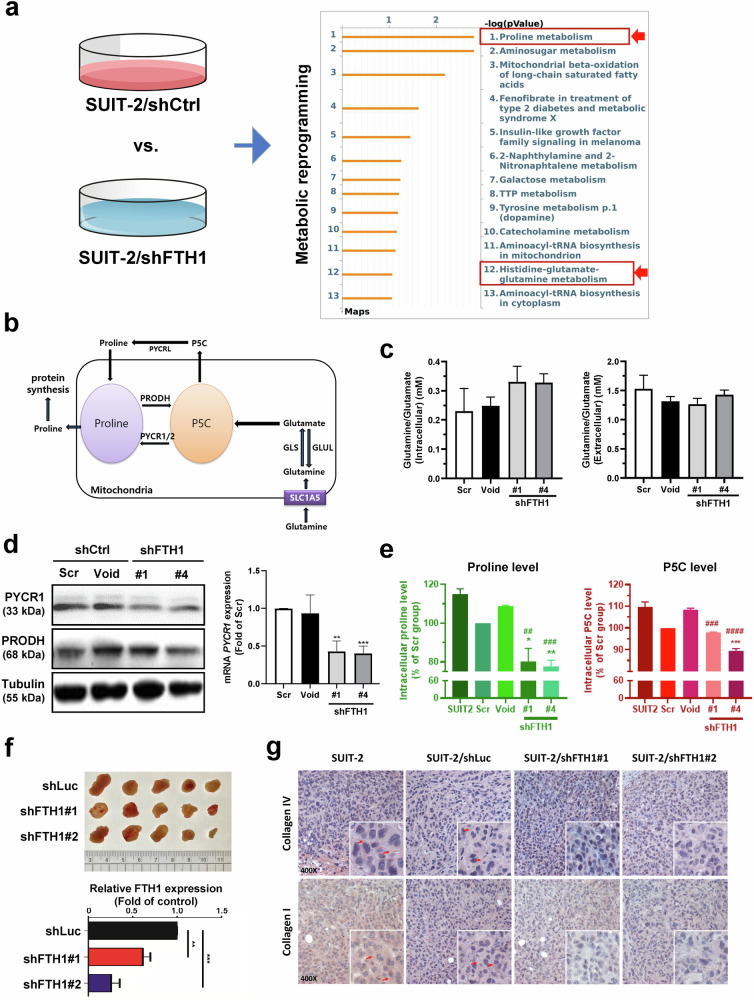
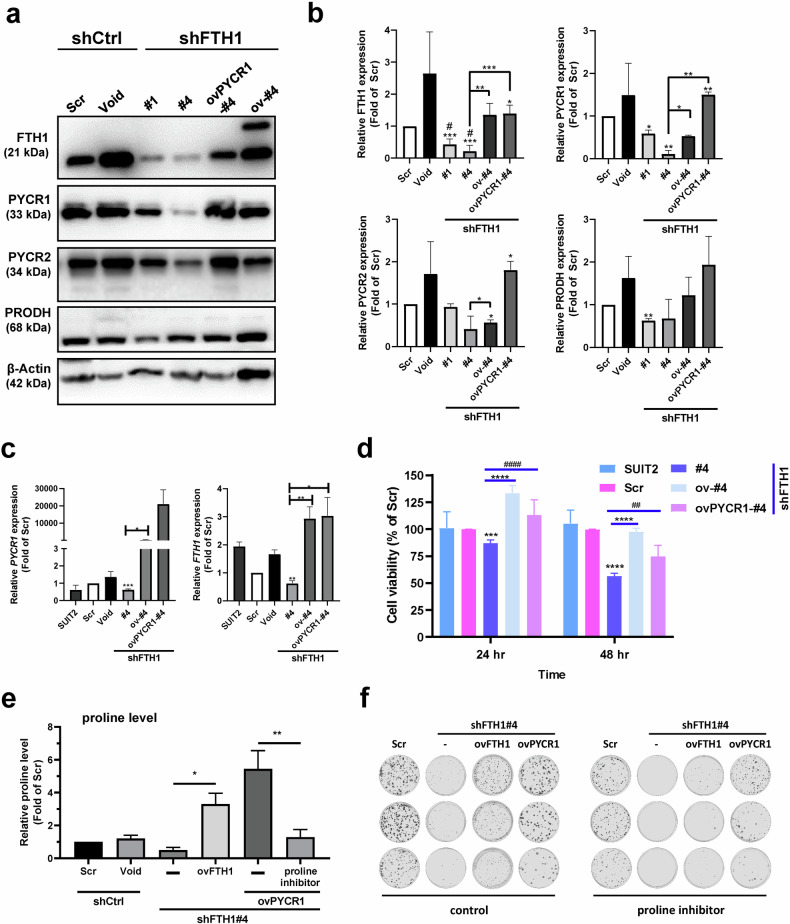
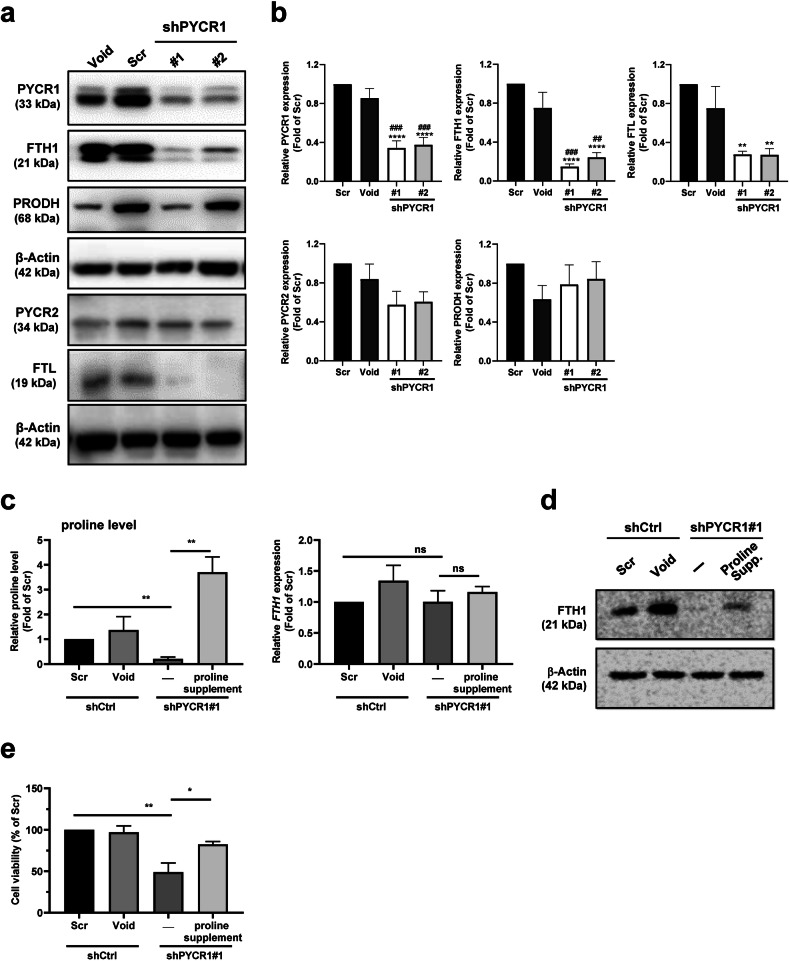
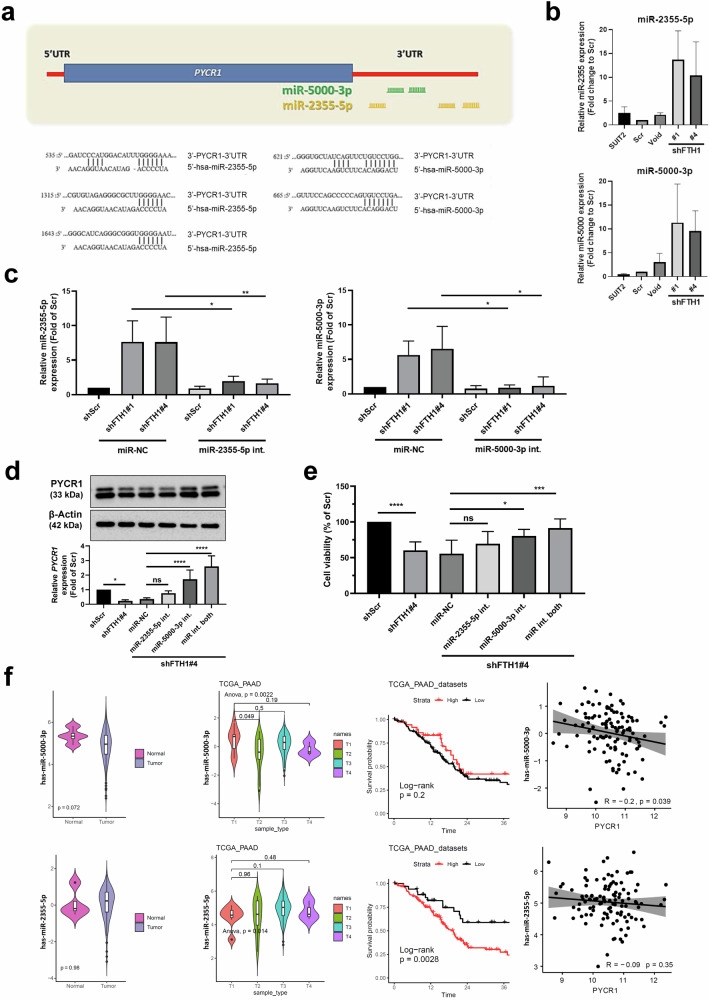
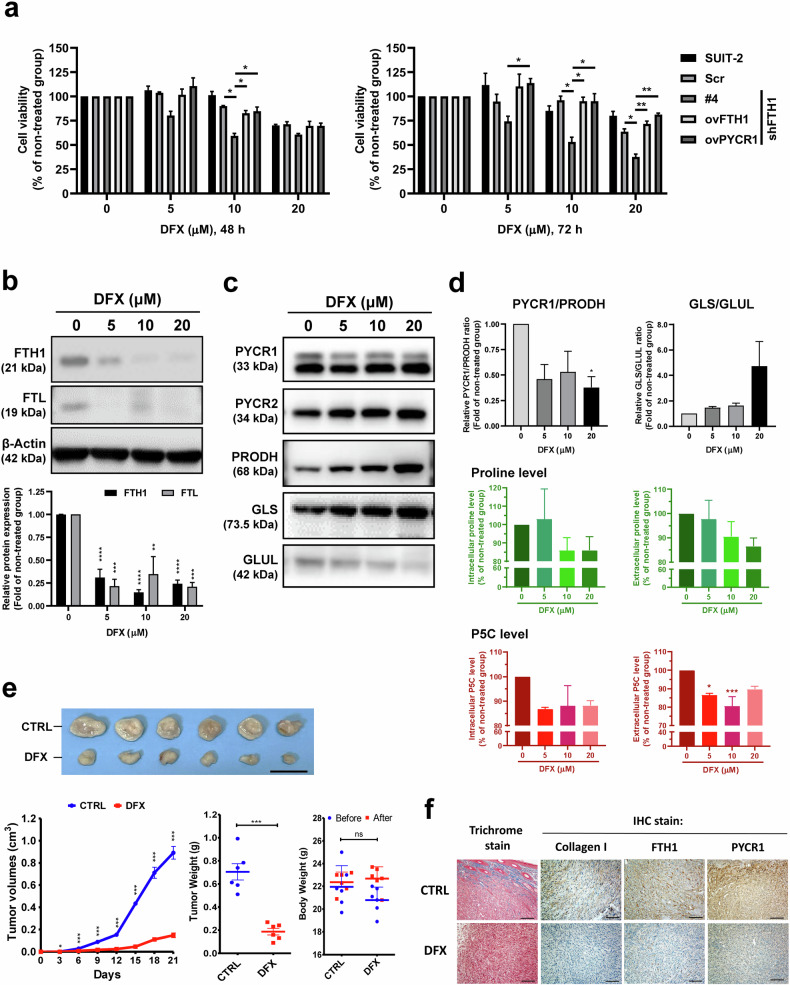
Ferritin, comprising heavy (FTH1) and light (FTL) chains, is the main iron storage protein, and pancreatic cancer patients exhibit elevated serum ferritin levels. Specifically, higher ferritin levels are correlated with poorer pancreatic ductal adenocarcinoma (PDAC) prognosis; however, the underlying mechanism and metabolic programming of ferritin involved in KRAS-mutant PDAC progression remain unclear. Here, we observed a direct correlation between FTH1 expression and cell viability and clonogenicity in KRAS-mutant PDAC cell lines as well as with in vivo tumor growth through the control of proline metabolism. Our investigation highlights the intricate relationship between FTH1 and pyrroline-5-carboxylate reductase 1 (PYCR1), a crucial mitochondrial enzyme facilitating the glutamate-to-proline conversion, underscoring its impact on proline metabolic imbalance in KRAS-mutant PDAC. This regulation is further reversed by miR-5000-3p, whose dysregulation results in the disruption of proline metabolism, thereby accentuating the progression of KRAS-mutant PDAC. Additionally, our study demonstrated that deferasirox, an oral iron chelator, significantly diminishes cell viability and tumor growth in KRAS-mutant PDAC by targeting FTH1-mediated pathways and altering the PYCR1/PRODH expression ratio. These findings underscore the novel role of FTH1 in proline metabolism and its potential as a target for PDAC therapy development.


Conflict of interest statement

The authors declare no competing interests.

Figures

Fig. 1
Fig. 1. FTH1 and FTL expression in pancreatic cancer progression.
a, b FTH1 and FTL expression in pancreatic cancer. Data were retrieved from the Oncomine database (http://www.oncomine.org); FTH1 and FTL mRNA levels were compared between normal pancreatic (left) and pancreatic cancer (right) tissues. c, d Survival curves for patients stratified by FTH1 and FTL expression in pancreatic cancer by using Kaplan–Meier Plotter (www.kmplot.com). e Kaplan–Meier survival curve corrected for comparison of 170 patients with PDAC according to high versus low FTH1/FTL expression ratios from the TCGA dataset, assessed using PROGgeneV2 (http://genomics.jefferson.edu/proggene). f Representative IHC analysis depicting FTH1 expression in adjacent normal human tissue and pancreatic tumor tissues across various tumor grades and stages. Brown staining indicates FTH1 protein expression (magnification, ×100). FTH1 expression is positively correlated with advanced-stage PDAC. g qRT‒PCR analysis of FTH1 expression in pancreatic cancer tissues according to tumor stage (stage 1 and 2 vs. stage 3 and 4; left) and tumor grade (grade 1 and 2 vs. grade 3 and 4; right). The relative levels of FTH1 expression are represented as ΔCP = CP of tested FTH1 – CP of reference FTH1. The median ΔCP of patient samples was used as the cutoff to define high and low FTH1 expression. HR hazard ratio; NT nontumor tissue; TNM tumor, node, and metastasis.
Fig. 2
Fig. 2. Mutant KRAS regulates FTH1 expression in pancreatic cancer.
a Representative Western blot for FTH1 and FTL in hTERT-HPNE, BxPC-3, and KRAS-mutant pancreatic cancer (AsPC-1, Mia PaCa-2, SUIT-2, PANC-1, and PANC-1/GR) cells. β-Actin was used as a loading control. b, c show quantification of FTH1 and FTL expression in the indicated cells via ImageJ, normalized to β-actin, with bars indicating the mean fold change relative to hTERT-HPNE cell expression. The data are expressed as the means ± SDs (n = 3). *p < 0.05 and ***p < 0.001 compared with hTERT-HPNE cells. df HEK293T cells were transiently transfected with plasmids encoding vector, wild-type (WT), V12, or N17 plasmids and probed with d pERK1/2 and ERK1/2, e FTH1, and f FTL. Tubulin was used as a loading control. The data are expressed as the means ± SDs (n = 3). *p < 0.05 and **p < 0.01 compared with RAS V17 cells. g Representative images of FTH1 protein expression during pancreatic cancer development and progression in our KC mouse model. After tamoxifen administration, KC mice developed acinar-to-ductal metaplasia and PanIN. The mice were sacrificed during the indicated months, and their tissues were immunohistochemically stained for FTH1 (magnification, ×100). h IHC staining score for FTH1. The data are expressed as the means ± SDs (n = 6). *p < 0.05 and ****p < 0.0001.
Fig. 3
Fig. 3. FTH1 knockdown reduces KRAS-mutant pancreatic cancer cell viability and tumor growth.
a, b FTH1 was knocked down in KRAS-mutant SUIT-2 cells through stable expression of shRNAs against FTH1 via the lentiviral expression constructs shCtrl (Scr, Void) and shFTH1 (#1, #3, and #4). Western blot (left) and qRT‒PCR (right) analyses of FTH1 and FTL after shFTH1 plasmid transfection into SUIT-2 cells. GAPDH or β-actin was used as a loading control. *p < 0.05, **p < 0.01, ***p < 0.001, and ****p < 0.0001 compared with Scr; #p < 0.05, ##p < 0.01, and ###p < 0.001 compared with Void; and §p< 0.05, §§p < 0.01, §§§p < 0.001, and §§§§p < 0.0001 compared with SUIT-2 cells. c Cell viability in each cell group was determined using an MTT assay after 24 and 48 h. *p < 0.05 and **p < 0.01 compared with the Scr group; #p < 0.05 and ##p < 0.01 compared with the Void group. d Each group of cells was plated in triplicate in 6-well plates at 200 cells per well. After 8 days, colonies were counted using ImageJ after staining with 0.5% crystal violet in methanol. **p < 0.01 compared with the control (Scr and Void) group. e Cell cycle analysis through PI staining following flow cytometry of the transfected shCtrl (Scr or Void)-infected or shFTH1-infected SUIT-2 cells (#1 and #4). f G0/G1, S, and G2/M phase percentages of the indicated SUIT-2 cells were determined using FlowJo with the Dean–Jett–Fox model (with sync.peak). *p < 0.05, **p < 0.01, ***p < 0.001, and ****p < 0.0001 compared with the Scr group. The data are expressed as the means ± SEMs from three independent experiments (n ≥ 3). g, h Male NOD/SCID immunodeficient mice were subcutaneously injected in the back with tumor cells (Scr, Void, #1, and #4). g Tumor sizes were measured at various time points. *p < 0.05 and **p < 0.01 compared with the Scr group; ##p < 0.01, ###p < 0.001, and ####p < 0.0001 compared with the Void group. h Tumor sizes (left) and weights (right) in each group are shown. The data are expressed as the means ± SEMs (n = 7). #p < 0.05 and ##p < 0.01 compared with the Void group.
Fig. 4
Fig. 4. FTH1 mediates proline metabolic reprogramming in SUIT-2 cells.
a Pathway analysis was conducted on metabolites differentially expressed in FTH1-knockdown SUIT-2 cells using metabolomics to identify significant pathways related to genes altered between shFTH1- and shCtrl-infected cells via the MASS Spectrum Browser. Proline metabolism has emerged as a key pathway involved in FTH1 regulation in pancreatic cancer cells. b Schematic of proline metabolism. c Glutamine/glutamate concentration ratios in the indicated SUIT-2 cells with shFTH1 knockdown. d Representative Western blots (left) of PYCR1 and PRODH and qRT‒PCR analysis (right) of PYCR1 expression in the indicated SUIT-2 cells with shFTH1 knockdown. Western blots were normalized to tubulin, with bars representing the mean fold change relative to Scr cells, while GAPDH served as the qRT‒PCR reference. **p < 0.01 and ***p < 0.001 compared with the Scr group. e Proline and P5C levels in the indicated SUIT-2 cells with shFTH1 knockdown. Bars indicate the percentage change compared to the Scr control group. *p < 0.05, **p < 0.01, ***p < 0.001 compared with the Scr group; ##p < 0.01, ###p < 0.001, ####p < 0.0001 compared with the Void group. f Five male NOD/SCID mice were subcutaneously injected in the back with tumor cells (shLuc, shFTH1#1, and shFTH1#2). Tumor sizes (upper) and FTH1 expression (lower) in each group were reduced following FTH1 knockdown (n = 5), with shLuc serving as the control. **p < 0.01 and ***p < 0.001 compared with the shLuc group. g IHC staining revealed collagen I and IV in representative tumor sections from mice bearing subcutaneous tumors generated from control or FTH1-knockdown SUIT-2 cells at ×200 magnification.
Fig. 5
Fig. 5. FTH1 interacts with PYCR1 to regulate proline metabolism, which contributes to pancreatic cancer cell viability.
a FTH1, PYCR1, PYCR2, and PRODH expression in shCtrl-infected (Scr), shFTH1-infected (#1 and #4) SUIT-2 cells, and shFTH1-rescued FTH1 (ov-#4) cells and PYCR1 overexpression in SUIT-2/shFTH1#4 (ovPYCR1-#4) cells were examined through Western blotting. b Western blots were normalized to β-actin, and each bar shows the mean fold change relative to expression in Scr and Void cells. The data are expressed as the means ± SEMs from at least two independent experiments. *p < 0.05, **p < 0.01, ***p < 0.001 compared with the Scr group and #p < 0.05 compared with the Void group. c PYCR1 (left) and FTH1 (right) mRNA expression in the indicated cells was analyzed using qRT‒PCR. GAPDH was used as a loading control. The data are expressed as the means ± SEMs from three independent experiments (n = 3). *p < 0.05, **p < 0.01, ***p < 0.001 compared with the Scr group. d Cell viability of each group of cells was determined using the MTT assay at 24 and 48 h. The data are expressed as the means ± SEMs from three independent experiments (n = 3). ***p < 0.001 and ****p < 0.0001 compared with either the Scr or rescued shFTH1 group and ##p < 0.01 and ####p < 0.0001 compared with the #4 and ovPYCR1-#4 groups. e Proline levels in the designated SUIT-2 cells were measured after exposure to a proline inhibitor (2 mM for 48 hr). Bars indicate the fold change compared to the Scr control group. *p < 0.05, **p < 0.01. f The indicated proline inhibitor-treated SUIT-2 cells were seeded at 200 per well in 6-well plates and incubated with a proline inhibitor for 8 days. After incubation, the colonies were stained with 0.5% crystal violet in methanol.
Fig. 6
Fig. 6. Proline supplementation reversed changes in FTH1 protein expression and cell viability in PYCR1-knockdown cells.
a PYCR1 was knocked down through stable expression of shRNAs against PYCR1 from the following lentiviral expression constructs: Scr, Void (control), and shPYCR1#1 and shPYCR1#2. b Quantification of PYCR1, PYCR2, PRODH, FTH1, and FTL expression in the indicated cells was performed via ImageJ. Blots were normalized to β-actin, with bars indicating the mean fold change relative to Scr cell expression. The data are shown as the means ± SEMs; **p < 0.01, ****p < 0.0001 vs. the Scr group; ##p < 0.01 vs. the Void group. c Effects of PYCR1 knockdown and proline supplementation on proline levels and FTH1 mRNA expression. Left panel: Proline levels relative to those in the Scr control group in shCtrl, shPYCR1#1, and 200 μM proline-supplemented shPYCR1#1 cells. Right panel: FTH1 mRNA expression relative to that in the Scr control group under the same conditions. Bars represent the mean ± SEM; **p < 0.01 indicates significance, while ns denotes not significant. d Western blot analysis showing the protein expression of FTH1. The expression was compared across SUIT-2 cells with control shRNA (Scr and Void), without treatment (−), and cells with 200 μM proline supplementation (Proline Supp.) following shPYCR1#1 knockdown. β-Actin served as a loading control. e MTT assay-based cell viability assessment in SUIT-2 cells following shRNA-mediated knockdown and 48-hour proline supplementation. Viability percentages are relative to those of the Scr control group, indicating the effects of scrambled shRNA (Scr), vector control (Void), shRNA control (shCtrl), and PYCR1 knockdown (shPYCR1#1) with or without the addition of 200 μM proline for 48 hr. The data are shown as the mean ± SEM; *p < 0.05, **p < 0.01.
Fig. 7
Fig. 7. FTH1 knockdown suppresses PYCR1 expression via miRNA regulation.
a Target prediction via TargetScan revealed that the 3′-UTR sequence of PYCR1 contains putative binding sites for miR-2355-5p and miR-5000-3p. b Expression of miR-2355-5p and miR-5000-3p in the indicated SUIT-2, transfected shCtrl (Scr), and shFTH1 knockdown SUIT-2 (#1 and #4) cells was analyzed using qRT‒PCR. The qRT‒PCR data were normalized to U47 levels in each individual sample, and the bar plot shows the fold changes in Scr expression. The data are expressed as the means ± SEMs from three independent experiments (n = 3). c Differential miRNA expression upon FTH1 knockdown in SUIT-2 cells. Left panel: Relative expression of miR-2355-5p in shScr, shFTH1#1, and shFTH1#4 cells treated with either miR-NC (negative control) or the miR-2355-5p inhibitor (int.). Right panel: Relative expression of miR-5000-3p under the same conditions. The expression was normalized to that in the shScr group, with the bars representing the mean ± SEM. Significance is denoted by asterisks (*p < 0.05, **p < 0.01). d Impact of FTH1 knockdown and miRNA inhibition on PYCR1 protein (upper panel) and mRNA expression (bottom panel) in SUIT-2 cells. β-Actin was used as a loading control for the WBs. Relative PYCR1 mRNA expression in shScr, shFTH1#4, and miR-NC cells and in cells treated with miR-2355-5p or miR-5000-3p inhibitors, both individually and in combination (int. both), normalized to that in shScr-treated cells. e Cell viability of the same groups, expressed as a percentage of the shScr control. Significance is indicated as *p < 0.05, ***p < 0.001, and ****p < 0.0001. f Multipanel analysis of miRNA expression and correlation with survival and PYCR1 levels in PAAD. Top left: Violin plots comparing the expression levels of hsa-miR-5000-3p in normal and tumor tissues, p = 0.072. Top second from left: Violin plots of hsa-miR-5000-3p expression across different tumor stages (T1-T4), with ANOVA p = 0.0022. Top middle: Kaplan‒Meier survival curves stratified by high and low expression of hsa-miR-5000-3p, log-rank p = 0.2. Top right: Scatter plot depicting the inverse correlation between hsa-miR-5000-3p and PYCR1 expression, R = −0.2, p = 0.039. Bottom left: Violin plots showing the expression levels of hsa-miR-2355-5p in normal and tumor tissues, p = 0.98. Bottom second from left: Violin plots of hsa-miR-2355-5p expression across different tumor stages; ANOVA, p = 0.014. Bottom middle: Kaplan‒Meier curves based on hsa-miR-2355-5p expression; log-rank p = 0.0028. Bottom right: Scatter plot showing no significant correlation between hsa-miR-2355-5p and PYCR1 expression, R = −0.09, p = 0.35. The data were derived from the TCGA_PAAD dataset.
Fig. 8
Fig. 8. DFX treatment significantly reduces FTH1-mediated tumor growth.
a The effect of deferasirox (DFX) on the viability of SUIT-2 cells and various genetically modified cell lines. The left graph displays cell viability after 48 h of treatment with 0, 5, 10, or 20 µM DFX, while the right graph shows the results after 72 h of treatment. The following cell lines were used: parental SUIT-2, scrambled control (Scr), shFTH1 clone #4 (shFTH1#4), and cells overexpressing FTH1 (ovFTH1) and PYCR1 (ovPYCR1). Viability is presented as a percentage of the untreated control group for each cell line, with bars denoting the mean ± SEM. Significance is indicated by *p < 0.05 and **p < 0.01. b The immunoblots at the top display bands for FTH1 and FTL after 48 hr of treatment with 0, 5, 10, or 20 µM DFX. β-Actin served as the loading control. The bar graph below shows the quantified protein expression normalized to that in the untreated group, with black bars representing FTH1 and gray bars representing FTL. The data are presented as the mean ± SEM (***p < 0.001). c The blot displays bands for PYCR1, PYCR2, PRODH, GLUL, and GLS at DFX concentrations of 0, 5, 10, and 20 µM. β-Actin served as a loading control. d Top panels display the relative enzyme expression ratios of PYCR1/PRODH and GLS/GLUL, normalized to the untreated control. The bottom panels show the intracellular and extracellular levels of proline and P5C (pyrroline-5-carboxylate), which are presented as percentages of those in the nontreated group. All of the data are presented as the means ± SEMs after treatment with 0, 5, 10, or 20 µM DFX. *p < 0.05, ***p < 0.001. e Top, Representative images of tumors excised from mice pretreated with PBS (CTRL) or DFX (160 mg/kg). Scale bars: 20 mm. Bottom left–tumor growth curves at 21 days postimplantation of 1 × 106 DesPanc03 mouse pancreatic cancer cells, with DFX treatment continuing every three days. Bottom middle—Final tumor weight comparison indicating a significant reduction in the DFX group. Bottom right—No significant changes in body weight suggest minimal systemic toxicity of DFX. f Trichrome and IHC staining of tumor sections for collagen I, FTH1, and PYCR1 reflecting the microenvironmental alterations caused by DFX treatment. The data are shown as the mean ± SEM, with *p < 0.05, ***p < 0.001 indicating significance, and ns denoting nonsignificance. Scale bars: 100 µm.

Similar articles

Cited by

References

    1. Alkhateeb, A. A. & Connor, J. R. The significance of ferritin in cancer: anti-oxidation, inflammation and tumorigenesis. Biochim. Biophys. Acta1836, 245–254 (2013). - PubMed
    1. Scully, R. E., Mark, E. J., McNeely, W. F., Ebeling, S. H. & Phillips, L. D. Weekly clinicopathological exercises. N. Engl. J. Med.337, 839–845 (1997). - PubMed
    1. Ji, M. et al. Clinical significance of serum ferritin in elderly patients with primary lung carcinoma. Tumour Biol.35, 10195–10199 (2014). - PubMed
    1. Facciorusso, A. et al. Serum ferritin as a new prognostic factor in hepatocellular carcinoma patients treated with radiofrequency ablation. J. Gastroenterol. Hepatol.29, 1905–1910 (2014). - PubMed
    1. Petekkaya, I. Impact of inflammatory markers on the prognosis of patients with operable breast cancer. J. Balk. Union Oncol.19, 673–680 (2014). - PubMed

MeSH terms