. 2024 Dec;45(12):2579-2597.
doi: 10.1038/s41401-024-01389-3. Epub 2024 Sep 18.

SGLT2 inhibitors ameliorate NAFLD in mice via downregulating PFKFB3, suppressing glycolysis and modulating macrophage polarization

Affiliations

SGLT2 inhibitors ameliorate NAFLD in mice via downregulating PFKFB3, suppressing glycolysis and modulating macrophage polarization

Xia-Fang Lin et al. Acta Pharmacol Sin. 2024 Dec.

Abstract

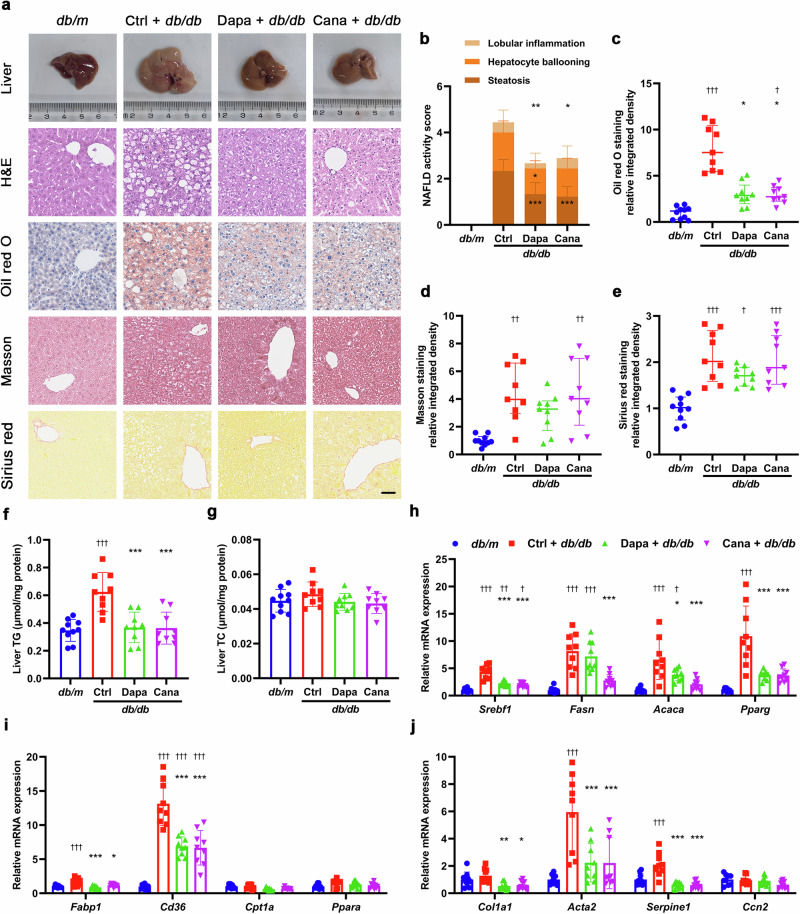
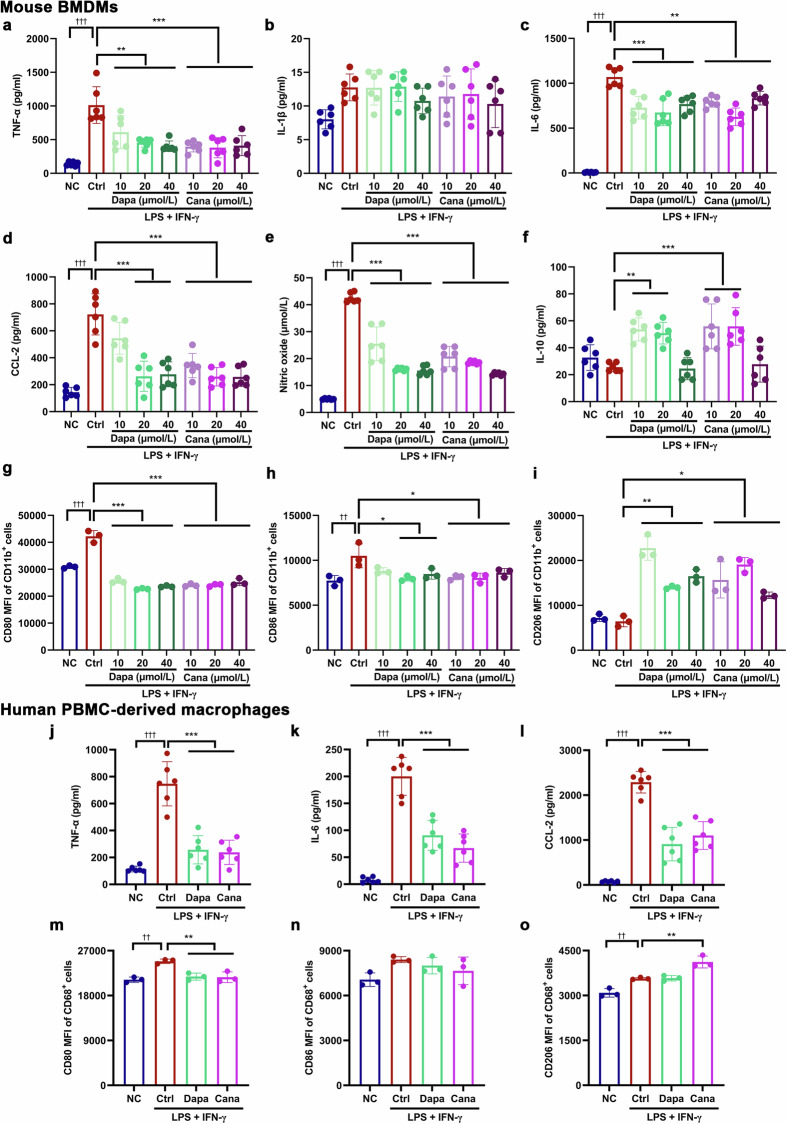
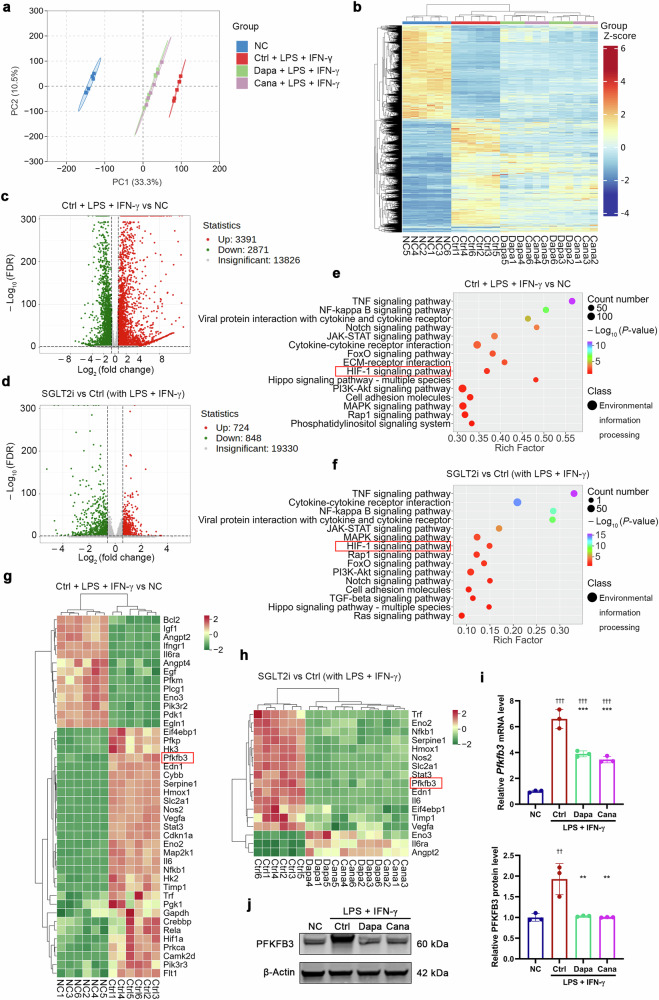
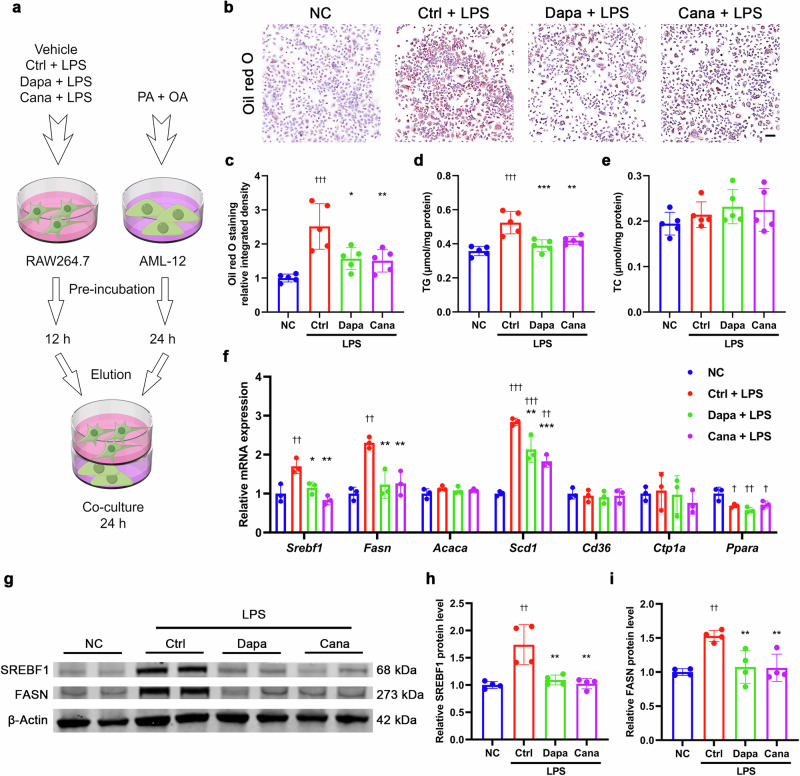
Sodium-glucose co-transporter 2 (SGLT2) inhibitor (SGLT2i) is a novel class of anti-diabetic drug, which has displayed a promising benefit for non-alcoholic fatty liver disease (NAFLD). In this study, we investigated the protective effects of SGLT2i against NAFLD and the underlying mechanisms. The db/db mice and western diet-induced NAFLD mice were treated with dapagliflozin (1 mg·kg-1·d-1, i.g.) or canagliflozin (10 mg·kg-1·d-1, i.g.) for 8 weeks. We showed that the SGLT2i significantly improved NAFLD-associated metabolic indexes, and attenuated hepatic steatosis and fibrosis. Notably, SGLT2i reduced the levels of pro-inflammatory cytokines and chemokines, downregulated M1 macrophage marker expression and upregulated M2 macrophage marker expression in liver tissues. In cultured mouse bone marrow-derived macrophages and human peripheral blood mononuclear cell-derived macrophages, the SGLT2i (10, 20 and 40 μmol/L) significantly promoted macrophage polarization from M1 to M2 phenotype. RNA sequencing, Seahorse analysis and liquid chromatography-tandem mass spectrometry analysis revealed that the SGLT2i suppressed glycolysis and triggered metabolic reprogramming in macrophages. By using genetic manipulation and pharmacological inhibition, we identified that the SGLT2i targeted PFKFB3, a key enzyme of glycolysis, to modulate the macrophage polarization of M1 to M2 phenotype. Using a co-culture of macrophages with hepatocytes, we demonstrated that the SGLT2i inhibited lipogenesis in hepatocytes via crosstalk with macrophages. In conclusion, this study highlights a potential therapeutic application for repurposing SGLT2i and identifying a potential target PFKFB3 for NAFLD treatment.

Keywords: PFKFB3; canagliflozin; dapagliflozin; glycolysis; macrophage polarization; non-alcoholic fatty liver disease.


Conflict of interest statement

Competing interests: The authors declare no competing interests.

Figures

Fig. 1
Fig. 1. SGLT2i ameliorates NAFLD in db/db mice.
Eight-week-old male db/db mice were treated for 8 weeks with dapagliflozin (1 mg·kg−1·d−1), canagliflozin (10 mg·kg−1·d−1) or vehicle. Age-matched male db/m mice treated with vehicle served as normal control. a Representative images of liver morphology, H&E staining, oil red O staining, Masson staining and Sirius red staining. Scale bar = 50 μm. b NAFLD activity score and individual histological scores for hepatic steatosis, hepatocellular ballooning and lobular inflammation based on H&E staining. Quantification of positive area for oil red O staining (c), Masson staining (d) and Sirius red staining (e). f Liver triglyceride (TG). g Liver total cholesterol (TC). Relative mRNA levels of genes related to fatty acid synthesis (h), fatty acid uptake and β-oxidation (i), and fibrosis (j) in liver tissues detected by quantitative real-time PCR. n = 9−10 per group. Data are expressed as mean ± SD or median (interquartile range). Statistical analysis was performed by ANOVA followed by the post hoc Tukey-Kramer test, or by Kruskal–Wallis test followed by the Dunn multiple comparisons test, as appropriate. *P < 0.05, **P < 0.01, ***P < 0.001 vs vehicle control group in db/db mice; P < 0.05, ††P < 0.01, †††P < 0.001 vs db/m mice. Ctrl control, Cana canagliflozin, Dapa dapagliflozin.
Fig. 2
Fig. 2. SGLT2i improves NAFLD in western diet-induced NAFLD mice.
Six-week-old male C57BL/6J mice were fed on a chow diet (CD) or a western diet (WD) for 20 weeks. Subsequently, the WD-fed mice were treated for 8 weeks with dapagliflozin (1 mg·kg−1·d−1), canagliflozin (10 mg·kg−1·d−1) or vehicle. The CD-fed mice treated with vehicle were used as normal control. a Representative images of liver morphology, H&E staining, oil red O staining, Masson staining and Sirius red staining. Scale bar = 50 μm. b NAFLD activity score and individual histological scores for hepatic steatosis, hepatocellular ballooning and lobular inflammation based on H&E staining. Quantification of positive area for oil red O staining (c), Masson staining (d) and Sirius red staining (e). f Liver triglyceride (TG). g Liver total cholesterol (TC). Relative mRNA levels of genes related to fatty acid synthesis (h), fatty acid uptake and β-oxidation (i), and fibrosis (j) in the liver tissues detected by quantitative real-time PCR. n = 6−7 per group. Data are expressed as mean ± SD. Statistical analysis was performed by ANOVA followed by the post hoc Tukey-Kramer test. *P < 0.05, **P < 0.01, ***P < 0.001 vs vehicle control group in WD-fed mice; P < 0.05, ††P < 0.01, †††P < 0.001 vs CD-fed mice. Ctrl control, Cana canagliflozin, Dapa dapagliflozin.
Fig. 3
Fig. 3. SGLT2i alleviates hepatic inflammation and improves macrophage polarization in two NAFLD models.
Eight-week-old male db/db mice were treated for 8 weeks with dapagliflozin (1 mg·kg−1·d−1), canagliflozin (10 mg·kg−1·d−1) or vehicle. Age-matched male db/m mice treated with vehicle served as normal control. a Representative images of macrophages immunostained for F4/80 (mature macrophage marker) and CD86 (M1 marker) or CD163 (M2 marker) in liver sections. Nuclei were labeled with DAPI (blue). Scale bar = 10 μm. bg The levels of inflammatory cytokines and chemokines in liver tissues measured by ELISA. n = 9−10 per group. Six-week-old male C57BL/6J mice were fed on a chow diet (CD) or a western diet (WD) for 20 weeks. Subsequently, the WD-fed mice were treated for 8 weeks with dapagliflozin (1 mg·kg−1·d−1), canagliflozin (10 mg·kg−1·d−1) or vehicle. The CD-fed mice treated with vehicle were used as normal control. h Representative images of macrophages immunostained for F4/80 and CD86 or CD163 in liver sections. Nuclei were labeled with DAPI (blue). Scale bar = 10 μm. in The levels of inflammatory cytokines and chemokines in liver tissues measured by ELISA. n = 6−7 per group. The mean fluorescence intensity (MFI) of M1 marker CD80 (o, q) and M2 marker CD206 (p, r) in liver macrophages isolated from db/db mice or WD-fed mice detected by flow cytometry. n = 4 per group. Data are expressed as mean ± SD. Statistical analysis was performed by ANOVA followed by the post hoc Tukey-Kramer test. **P < 0.01, ***P < 0.001 vs vehicle control group in db/db mice or WD-fed mice; P < 0.05, ††P < 0.01, †††P < 0.001 vs db/m mice or CD-fed mice. Ctrl control, Cana canagliflozin, Dapa dapagliflozin.
Fig. 4
Fig. 4. SGLT2i promotes macrophage polarization from M1 to M2 phenotype in mouse BMDMs and human PBMC-derived macrophages.
Mouse bone marrow-derived macrophages (BMDMs) or human peripheral blood mononuclear cell (PBMC)-derived macrophages were incubated for 12 h with different concentrations or 20 µmol/L of dapagliflozin, canagliflozin or vehicle in the presence or absence of lipopolysaccharide (LPS, 100 ng/mL) + interferon-γ (IFN-γ, 50 ng/mL) that were used for inducing M1 polarization. The supernatant levels of pro-inflammatory (ae) and anti-inflammatory (f) factors in mouse BMDMs measured by ELISA and chemical assay. n = 6 per group. The mean fluorescence intensity (MFI) of M1 markers CD80 and CD86 (g, h), and M2 marker CD206 (i) in mouse BMDMs detected by flow cytometry. n = 3 per group. jl The supernatant levels of pro-inflammatory cytokines and chemokines in human PBMC-derived macrophages measured by ELISA. n = 6 per group. The MFI of CD80 and CD86 (m, n), and CD206 (o) in human PBMC-derived macrophages detected by flow cytometry. n = 3 per group. Data are expressed as mean ± SD. Statistical analysis was performed by ANOVA followed by the post hoc Tukey-Kramer test. *P < 0.05, **P < 0.01, ***P < 0.001 vs vehicle control-treated group with LPS + IFN-γ; ††P < 0.01, †††P < 0.001 vs normal control group. Ctrl control, Cana canagliflozin, Dapa dapagliflozin, NC normal control.
Fig. 5
Fig. 5. SGLT2i downregulates PFKFB3 expression in M1 macrophages.
Mouse bone marrow-derived macrophages (BMDMs) were cultured for 12 h with 20 µmol/L SGLT2i (dapagliflozin or canagliflozin) or vehicle in the presence or absence of lipopolysaccharide (LPS, 100 ng/mL) + interferon-γ (IFN-γ, 50 ng/mL) that were used for inducing M1 polarization. Cells were collected for RNA sequencing (RNA-seq) analysis. a Principal component (PC) analysis. b Heatmap of the sample-to-sample differences based on RNA-seq data. c, d Volcano plot showing differential expression genes (DEGs) identified between LPS + IFN-γ and normal control groups (c), and between SGLT2i- and vehicle control-treated groups with LPS + IFN-γ (d). e, f Top 15 terms in Kyoto Encyclopedia of Genes and Genomes (KEGG) annotation involved in DEGs between LPS + IFN-γ and normal control groups (e), and between SGLT2i- and vehicle control-treated groups with LPS + IFN-γ (f). g, h Clustering heatmap of hypoxia-inducible factor-1 (HIF-1) signaling pathway target genes between LPS + IFN-γ and normal control groups (g), and between SGLT2i- and vehicle control-treated groups with LPS + IFN-γ (h). n = 6 per group. Genes with a P < 0.01 and log2 (fold change) <−0.585 or >0.585 were considered differentially expressed. The PFKFB3 mRNA (i) and protein (j) levels detected by quantitative real-time PCR and Western blot, respectively. n = 3 per group. Data are expressed as mean ± SD. Statistical analysis was performed by ANOVA followed by the post hoc Tukey-Kramer test. **P < 0.01, ***P < 0.001 vs vehicle control-treated group with LPS + IFN-γ; ††P < 0.01, †††P < 0.001 vs normal control group. Ctrl control, Cana canagliflozin, Dapa dapagliflozin, NC normal control.
Fig. 6
Fig. 6. SGLT2i inhibits glycolysis in M1 macrophages.
Mouse bone marrow-derived macrophages (BMDMs) were cultured for 12 h with 20 µmol/L dapagliflozin, canagliflozin or vehicle in the presence or absence of lipopolysaccharide (LPS, 100 ng/mL) + interferon-γ (IFN-γ, 50 ng/mL) that were used for inducing M1 polarization. a The extracellular acidification rate (ECAR), and basal and maximum ECAR capacities were determined by a respirometry and metabolomic instrument Seahorse XF96 Extracellular Flux Analyzer. 2-DG, 2-deoxy-D-glucose; Rot/AA, rotenone/antimycin A. n = 3−4 per group. b, c Relative readcount of genes related to glycolysis based on RNA-seq data. n = 6 per group. d Glucose uptake capacity was measured with a fluorescence-labeled D-glucose analog 2-[N-(7-nitrobenz-2-oxa-1,3-diazol-4-yl) amino]-2-deoxy-D-glucose (2-NBDG) by flow cytometry. MFI, mean fluorescence intensity. ek The intracellular concentrations of glycolysis metabolites measured by liquid chromatography-tandem mass spectrometry (LC-MS/MS). n = 4 per group. l Schematic for the effects of SGLT2i on the key enzymes and metabolites of glycolysis in M1 macrophages. Data are expressed as mean ± SD or median (interquartile range). Statistical analysis was performed by ANOVA followed by the post hoc Tukey-Kramer test, or by Kruskal–Wallis test followed by the Dunn multiple comparisons test, as appropriate. *P < 0.05, **P < 0.01, ***P < 0.001 vs vehicle control-treated group with LPS + IFN-γ; P < 0.05, ††P < 0.01, †††P < 0.001 vs normal control group. Ctrl control, Cana canagliflozin, Dapa dapagliflozin, NC normal control.
Fig. 7
Fig. 7. SGLT2i increases Kreb’s cycle activity in M1 macrophages.
Mouse bone marrow-derived macrophages (BMDMs) were incubated for 12 h with 20 µmol/L dapagliflozin, canagliflozin or vehicle in the presence or absence of lipopolysaccharide (LPS, 100 ng/mL) + interferon-γ (IFN-γ, 50 ng/mL) that were used for inducing M1 polarization. a The oxygen consumption rate (OCR), and basal and maximum OCR capacities were detected by a respirometry and metabolomic instrument Seahorse XF96 Extracellular Flux Analyzer. FCCP, carbonyl cyanide 4-(trifluoromethoxy) phenylhydrazone; Rot/AA, rotenone/antimycin A. n = 3−4 per group. b, c Relative readcount of genes related to tricarboxylic acid (TCA) cycle activity based on RNA-seq data. n = 6 per group. dk The intracellular concentrations of TCA cycle metabolites measured by liquid chromatography-tandem mass spectrometry (LC-MS/MS). n = 4 per group. l Schematic for the effects of SGLT2i on the key enzymes and metabolites of TCA cycle in M1 macrophages. Data are expressed as mean ± SD or median (interquartile range). Statistical analysis was performed by ANOVA followed by the post hoc Tukey-Kramer test, or by Kruskal–Wallis test followed by the Dunn multiple comparisons test, as appropriate. *P < 0.05, **P < 0.01, ***P < 0.001 vs vehicle control-treated group with LPS + IFN-γ; P < 0.05, ††P < 0.01, †††P < 0.001 vs normal control group. Ctrl control, Cana canagliflozin, Dapa dapagliflozin, NC normal control.
Fig. 8
Fig. 8. Downregulation of PFKFB3 is involved in the anti-inflammatory action of SGLT2i in M1 macrophages.
The mouse macrophage cell line RAW264.7 cells were cultured for 12 h with 20 µmol/L dapagliflozin, canagliflozin or vehicle in the presence of lipopolysaccharide (LPS, 100 ng/mL) that were used for inducing M1 polarization. The cells were transfected for 24 h with small interfering RNAs (siRNAs), si-NC, si-Pfkfb3-A and si-Pfkfb3-B, and then incubated with LPS for 12 h. The supernatant levels of pro-inflammatory (a, b) and anti-inflammatory (c) cytokines measured by ELISA. The mean fluorescence intensity (MFI) of M1 markers CD80 and CD86 (d, e), and M2 marker CD206 (f) detected by flow cytometry. RAW264.7 cells were transfected with Pfkfb3 overexpression plasmid (oe-Pfkfb3) or empty vector for 24 h, and then cultured with LPS and 20 µmol/L dapagliflozin, canagliflozin or vehicle for 12 h. The supernatant levels of pro-inflammatory (g, h) and anti-inflammatory (i) cytokines measured by ELISA. The MFI of CD80 and CD86 (j, k), and CD206 (l) detected by flow cytometry. n = 3 per group. Data are expressed as mean ± SD. Statistical analysis was performed by ANOVA followed by the post hoc Tukey-Kramer test. *P < 0.05, **P < 0.01, ***P < 0.001. Ctrl control, Cana canagliflozin, Dapa dapagliflozin, NC negative control.
Fig. 9
Fig. 9. Knockout of Pfkfb3 or specific inhibition of PFKFB3 promotes macrophage polarization from M1 to M2 phenotype.
Six-week-old male global heterozygous Pfkfb3 knockout (Pfkfb3+/−) mice and littermate Pfkfb3+/+ mice were fed on a western diet (WD) for 12 weeks. a Serum alanine aminotransferase (ALT). b Serum aspartate aminotransferase (AST). The levels of pro-inflammatory (ce) and anti-inflammatory (f) cytokines in liver tissues measured by ELISA. n = 6 per group. The mean fluorescence intensity (MFI) of M1 marker CD86 (g) and M2 marker CD206 (h) in isolated mouse liver macrophages detected by flow cytometry. i Representative images of macrophages immunostained for F4/80 (mature macrophage marker) and CD86 or CD163 (another M2 marker) in liver sections. Nuclei were labeled with DAPI (blue). Scale bar = 10 μm. n = 4 per group. BMDMs were isolated from six-week-old male Pfkfb3+/− and Pfkfb3+/+ mice, and were incubated for 12 h with lipopolysaccharide (LPS, 100 ng/mL) + interferon-γ (IFN-γ, 50 ng/mL) that were used for inducing M1 polarization. The supernatant levels of pro-inflammatory (jm) and anti-inflammatory (n) factors measured by ELISA. n = 6 per group. The MFI of CD80 (another M1 marker) and CD86 (o, p), and CD206 (q) detected by flow cytometry. n = 4 per group. Six-week-old male C57BL/6J mice were fed on a WD for 8 weeks, and were treated for 4 weeks with the PFKFB3-specific inhibitor 3-(3-pyridinyl)-1-(4-pyridinyl)-2-propen-1-one (3PO; 50 mg/kg, 4 times every week) or vehicle. The MFI of CD86 (r) and CD206 (s) in isolated mouse liver macrophages detected by flow cytometry. t Representative images of macrophages immunostained for F4/80 and CD86 or CD163 in liver sections. Nuclei were labeled with DAPI (blue). Scale bar = 10 μm. n = 4 per group. BMDMs isolated from C57BL/6J mice were incubated for 12 h with 10 μmol/L 3PO or vehicle in the presence of LPS (100 ng/mL) + IFN-γ (50 ng/mL). The supernatant levels of pro-inflammatory (u, v) and anti-inflammatory (w) cytokines measured by ELISA. n = 6 per group. The MFI of CD80 and CD86 (x, y), and CD206 (z) detected by flow cytometry. n = 3 per group. Data are expressed as mean ± SD. Statistical analysis was performed by Student’s t test. *P < 0.05, **P < 0.01, ***P < 0.001 vs Pfkfb3+/+ mice or vehicle control-treated group with LPS + IFN-γ. Ctrl control.
Fig. 10
Fig. 10. SGLT2i inhibits lipogenesis in hepatocytes via crosstalk with macrophages.
a Schematic diagram of the co-culture experiments. The mouse macrophage cell line RAW264.7 cells were pre-incubated for 12 h with 20 µmol/L dapagliflozin, canagliflozin or vehicle in the presence or absence of lipopolysaccharide (LPS, 100 ng/mL), and the mouse hepatocyte cell line AML-12 cells were pre-incubated for 24 h with palmitic acid (PA, 100 μmol/L) + oil acid (OA, 200 μmol/L). Subsequently, a 24-h co-culture of RAW264.7 cells with AML-12 cells was established by using the transwell chamber. b Representative images of oil red O staining. Scale bar = 100 μm. c Quantification of positive area for oil red O staining. Intracellular triglyceride (TG) content (d) and total cholesterol (TC) content (e) measured by biochemical assay. n = 5 per group. f Relative mRNA levels of genes related to lipid metabolism detected by quantitative real-time PCR. Representative images (g) and quantification of the protein levels of SREBF1 (h) and FASN (i) detected by Western blot. n = 4 per group. Data are expressed as mean ± SD. Statistical analysis was performed by ANOVA followed by the post hoc Tukey-Kramer test. *P < 0.05, **P < 0.01, ***P < 0.001 vs vehicle control-treated group with LPS. P < 0.05, ††P < 0.01, †††P < 0.001 vs normal control group. Ctrl control, Cana canagliflozin, Dapa dapagliflozin, NC normal control.

References

    1. Targher G, Tilg H, Byrne CD. Non-alcoholic fatty liver disease: a multisystem disease requiring a multidisciplinary and holistic approach. Lancet Gastroenterol Hepatol. 2021;6:578–88. - PubMed
    1. Powell EE, Wong VW, Rinella M. Non-alcoholic fatty liver disease. Lancet. 2021;397:2212–24. - PubMed
    1. Chalasani N, Younossi Z, Lavine JE, Charlton M, Cusi K, Rinella M, et al. The diagnosis and management of nonalcoholic fatty liver disease: Practice guidance from the American Association for the Study of Liver Diseases. Hepatology. 2018;67:328–57. - PubMed
    1. Liu Y, Xu R, Gu H, Zhang E, Qu J, Cao W, et al. Metabolic reprogramming in macrophage responses. Biomark Res. 2021;9:1. - PMC - PubMed
    1. Van den Bossche J, O’Neill LA, Menon D. Macrophage immunometabolism: where are we (going)? Trends Immunol. 2017;38:395–406. - PubMed

MeSH terms