. 2024 Oct;9(10):2642-2652.
doi: 10.1038/s41564-024-01791-x. Epub 2024 Sep 18.

Protein interactions in human pathogens revealed through deep learning

Affiliations

Protein interactions in human pathogens revealed through deep learning

Ian R Humphreys et al. Nat Microbiol. 2024 Oct.

Abstract

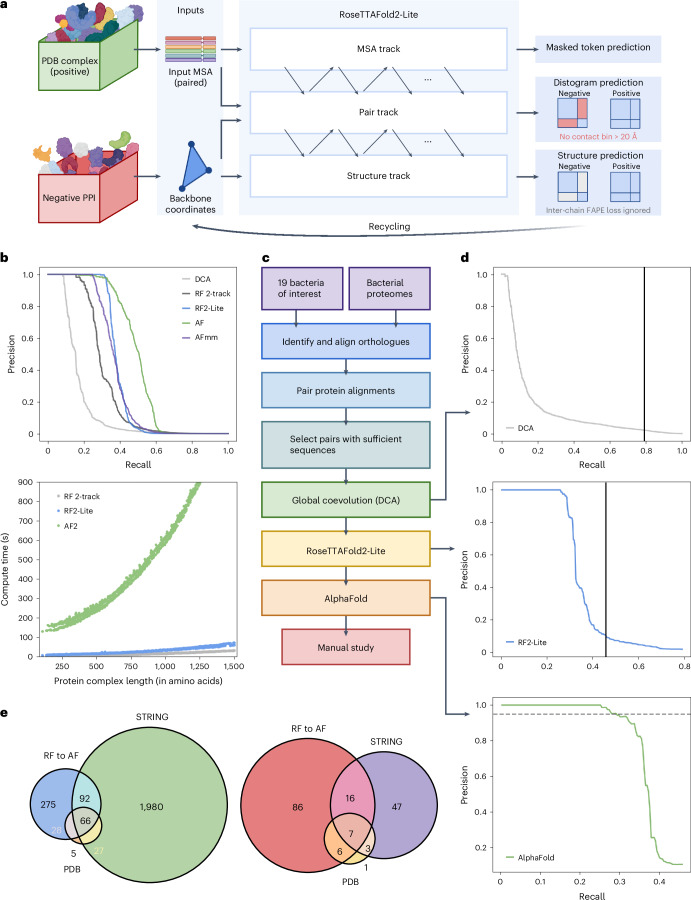
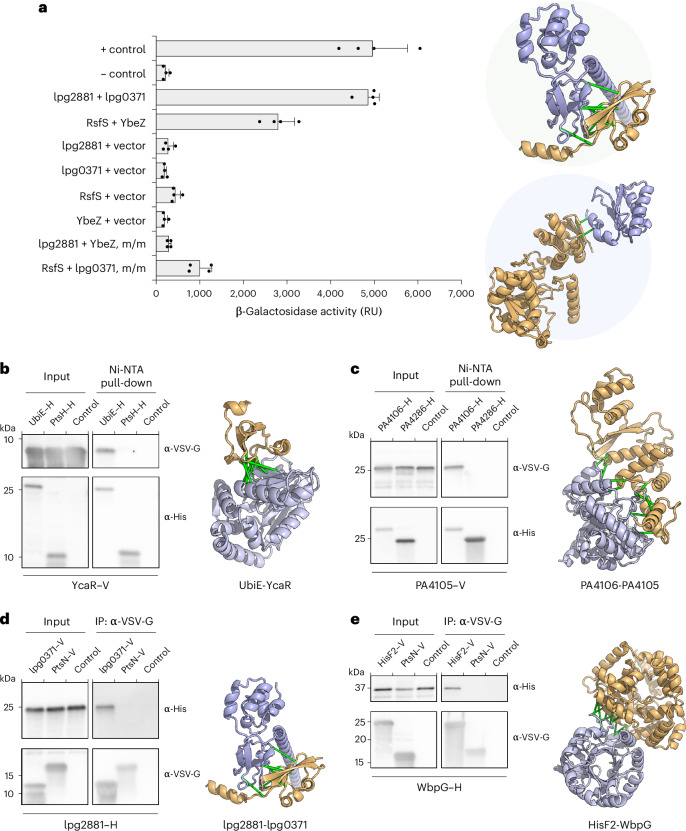
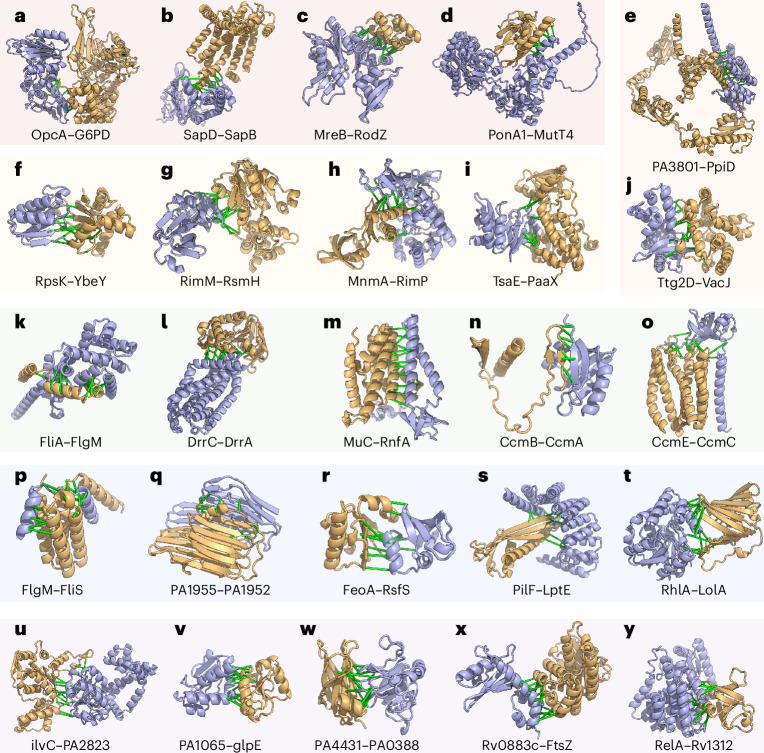
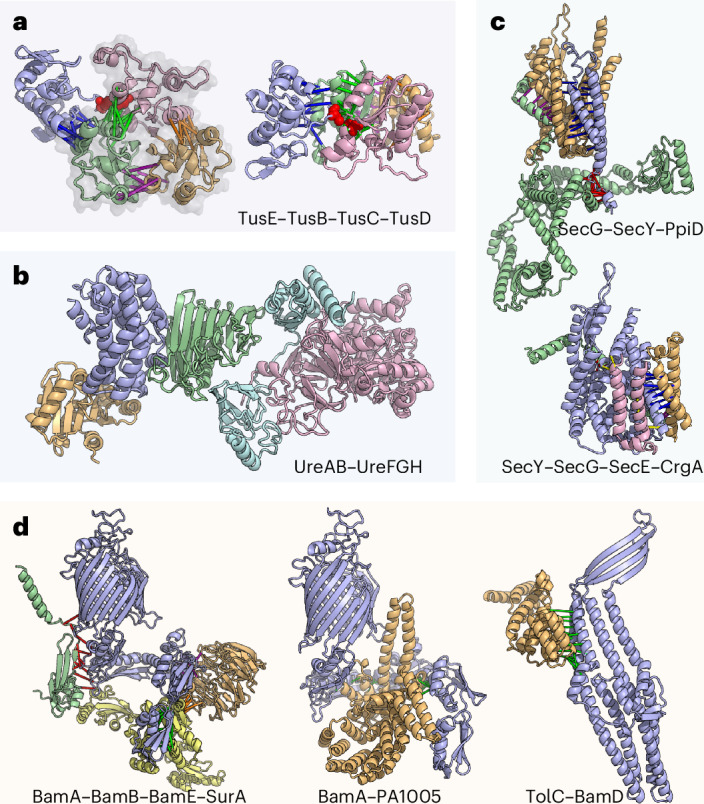
Identification of bacterial protein-protein interactions and predicting the structures of these complexes could aid in the understanding of pathogenicity mechanisms and developing treatments for infectious diseases. Here we developed RoseTTAFold2-Lite, a rapid deep learning model that leverages residue-residue coevolution and protein structure prediction to systematically identify and structurally characterize protein-protein interactions at the proteome-wide scale. Using this pipeline, we searched through 78 million pairs of proteins across 19 human bacterial pathogens and identified 1,923 confidently predicted complexes involving essential genes and 256 involving virulence factors. Many of these complexes were not previously known; we experimentally tested 12 such predictions, and half of them were validated. The predicted interactions span core metabolic and virulence pathways ranging from post-transcriptional modification to acid neutralization to outer-membrane machinery and should contribute to our understanding of the biology of these important pathogens and the design of drugs to combat them.


Conflict of interest statement

The authors declare no competing interests.

Figures

Fig. 1
Fig. 1. PPI identification by coevolution and deep learning methods.
a, Overview of the RF2-Lite network architecture. FAPE, frame-aligned point error. b, Benchmark performance of PPI prediction methods. Top: precision and recall curves of DCA (grey), RF 2-track (black), RF2-Lite (blue), AF (green) and AF-multimer (purple) in distinguishing true PPIs from random protein pairs. For different methods, we used the pMSAs generated by our bioinformatic pipeline (Supplementary Methods). We applied each method on a benchmark set of 1,000 randomly selected positive control pairs and 10,000 negative control pairs (Supplementary Methods). The precision and recall curve for this benchmark is in Supplementary Fig. 6a. Real signal-to-noise ratio for the PPI screen is on the order of 1:1,0001; to reflect the impact of a much larger set of non-interacting pairs, we upsampled the negative control set to 1,000,000 by randomly sampling 100 ‘pseudo’ interacting probabilities from the Gaussian distribution around each real interacting probability we obtained for the negative controls with a standard deviation of 0.1. Bottom: runtime comparison of different PPI identification methods. c, Schematic overview of our PPI screen pipeline. d, Precision and recall curves at different stages in the pipeline. Top: DCA on PPI prediction; solid black vertical line represents the recall cut-off in this stage. Middle: RF2-Lite screen procedure on the ‘pilot set’; solid black vertical line indicates the recall cut-off at this stage. Bottom: AF screen procedure on the ‘pilot set’; dashed horizontal line shows the precision cut-off, that is, 0.95. e, Summary of predicted PPIs for the ‘pilot set’ that focuses on essential genes and virulence factors. Left: interactions between interacting essential genes in the ‘pilot set’ based on different evidence: blue, green and orange circles represent our predicted pairs, functional interactions according to STRING (total score ≥900 and experimental score ≥400) and interacting pairs according to PDB (BLAST hit to complex in PDB e ≤ 0.00001, sequence identity ≥50% and coverage ≥50%), respectively. Right: PPIs involving virulence factors in the ‘pilot set’ supported by difference evidence: red, purple and yellow circles represent our predictions, pairs according to STRING and pairs according to PDB.
Fig. 2
Fig. 2. Experimental validation of selected PPIs.
a, Interactions assessed by B2H that measures β-galactosidase activity resulting from activation of the lacZ reporter gene due to the interaction between two tested proteins that are fused to two domains of a transcription activator. E. coli expressing T25-zip and T18-zip fusion proteins was used as a positive control (+ control), and E. coli harbouring empty T25 and T18 plasmids was used as a negative control (− control). m/m, mix-and-match control. RU, relative unit (luminescence per optical density at 600 nm per h). Error bars indicate ±s.d. (n = 2 biological replicates each with 2 technical replicates). Computed models of experimentally validated PPIs (‘lpg2881 + lpg0371’ and ‘RsfS + YbeZ’) are shown on the right—top: iron-sulfur cluster binding protein lpg2881 (Q5ZRK0) and uncharacterized protein lpg0371 (Q5ZYK1) from L. pneumophila; bottom: ribosomal silencing factor RsfS (Q9HX22) and PhoH-like protein domain-containing protein YbeZ (Q9HX38) from P. aeruginosa. be, Interactions validated by Co-IP/pull-down. Predicted interacting partners in each PPI pair are heterologously expressed and tagged (–H, hexahistidine; –V, VSV-G epitope). A random bait protein was included as a negative control for each experiment. Control lanes correspond to samples with prey proteins and beads added without any bait proteins. Each positive interaction is supported by two independent Co-IP/pull-down experiments. b, Ubiquinone biosynthesis C-methyltransferase UbiE (P0A887) and protein of unknown function YcaR (P0AAZ7) from E. coli. c, Uncharacterized protein PA4106 (Q9HWS2) and a putative transcriptional factor PA4105 (Q9HWS3) from P. aeruginosa. d, lpg2881 and lpg0371 from L. pneumophila, a pair that is tested positive by B2H as well. e, Putative imidazole glycerol phosphate synthase subunit hisF2 (P72139) and lipopolysaccharide biosynthesis protein WbpG (Q9HZ78) from P. aeruginosa. In all the panels, connecting green bars are between representative residue–residue contacts at the interfaces predicted from the summed AF probability for distance bins below 12 Å. Ni-NTA, nickel-nitrilotriacetic acid; VSV-G, vesicular stomatitis virus glycoprotein epitope.
Fig. 3
Fig. 3. Computed models of binary protein complexes.
aj, Interactions involving essential genes. a, Interaction with an enzyme where the enzymatic site is highlighted in light green with an NAD moiety. bd, Additional interactions involving essential genes. e,j Interactions involving transport pathways. fi, Transcription and translation. kt, Interactions involving virulence factors. uy, Interactions with uncharacterized proteins. In all models, the first protein is in blue, and the second is in gold. Green bars are between representative residue–residue contacts at the interfaces predicted from the summed AF probability for distance bins below 12 Å. Additional information (organisms and UniProt annotations) is in Supplementary Table 9.
Fig. 4
Fig. 4. Computed models for multi-component protein complexes.
a, H. pylori tRNA 2-thiouridine synthesizing protein complex. Left: a model of the TusE(blue)–TusB(gold)–TusC(green)–TusD(pink) complex overlaid with the TusBCD PDB structure (2D1P, shown in semi-transparent grey). Right: an alternative view of this complex. b, The UreAB–UreFGH complex (coloured in cyan, pink, blue, gold and green, respectively) in H. pylori assembled through multiple subcomplexes: UreFGH, UreAB and UreAH. c, Accessory components of the Sec translocon. Top: P. aeruginosa SecG(blue)–SecY(gold)–PpiD(green) complex. Bottom: M. tuberculosis SecY(blue)–SecG(gold)–SecE(green)–CrgA(pink) complex. d, Accessory components of the P. aeruginosa and S. typhimurium outer-membrane β-barrel assembly machinery. Left: interaction between SurA (yellow) and Bam proteins (BamA, blue; BamB, gold; BamE, green). Middle: BamA (blue) and PA1005 (gold), a putative BepA orthologue. Right: interaction between TolC (blue) and BamD (gold). In all schematics, green, red, yellow and magenta bars connect representative residue–residue contacts at the interfaces predicted from the summed AF probability for distance bins below 12 Å.

Update of

References

    1. Rajagopala, S. V. et al. The binary protein–protein interaction landscape of Escherichia coli. Nat. Biotechnol.32, 285–290 (2014). - PMC - PubMed
    1. Uetz, P. et al. A comprehensive analysis of protein–protein interactions in Saccharomyces cerevisiae. Nature403, 623–627 (2000). - PubMed
    1. Butland, G. et al. Interaction network containing conserved and essential protein complexes in Escherichia coli. Nature433, 531–537 (2005). - PubMed
    1. Edwards, A. M. et al. Bridging structural biology and genomics: assessing protein interaction data with known complexes. Trends Genet.18, 529–536 (2002). - PubMed
    1. Mackay, J. P., Sunde, M., Lowry, J. A., Crossley, M. & Matthews, J. M. Protein interactions: is seeing believing? Trends Biochem. Sci.32, 530–531 (2007). - PubMed