. 2024 Nov;27(11):2138-2151.
doi: 10.1038/s41593-024-01757-6. Epub 2024 Sep 18.

A cell-autonomous role for border-associated macrophages in ApoE4 neurovascular dysfunction and susceptibility to white matter injury

Affiliations

A cell-autonomous role for border-associated macrophages in ApoE4 neurovascular dysfunction and susceptibility to white matter injury

Antoine Anfray et al. Nat Neurosci. 2024 Nov.

Abstract

Apolipoprotein E4 (ApoE4), the strongest genetic risk factor for sporadic Alzheimer's disease, is also a risk factor for microvascular pathologies leading to cognitive impairment, particularly subcortical white matter injury. These effects have been attributed to alterations in the regulation of the brain blood supply, but the cellular source of ApoE4 and the underlying mechanisms remain unclear. In mice expressing human ApoE3 or ApoE4, we report that border-associated macrophages (BAMs), myeloid cells closely apposed to neocortical microvessels, are both sources and effectors of ApoE4 mediating the neurovascular dysfunction through reactive oxygen species. ApoE4 in BAMs is solely responsible for the increased susceptibility to oligemic white matter damage in ApoE4 mice and is sufficient to enhance damage in ApoE3 mice. The data unveil a new aspect of BAM pathobiology and highlight a previously unrecognized cell-autonomous role of BAM in the neurovascular dysfunction of ApoE4 with potential therapeutic implications.


Conflict of interest statement

Competing interests

D.M.H. is on the scientific advisory board of C2N diagnostics and has equity. He is also on the scientific advisory board of Denali Therapeutics, Genentech and Cajal Therapeutics and consults for Asteroid. C.I. is on the scientific advisory board of Broadview Ventures. The remaining authors declare no competing interests.

Figures
Extended Data Fig. 1 |
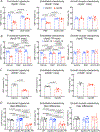
Extended Data Fig. 1 |. Effect of rApoE4 in ApoE−/− or CD36−/− mice, and of VLDL receptor antibodies and sex in ApoE4-TR mice.
a. Topical application of rApoE4 (10 μg/ml), but not rApoE3 (10 μg/ml), leads to neurovascular dysfunction in ApoE−/− mice, prevented by CLO. b. Superfusion with VLDL receptor blocking antibodies (anti-VLDLr; 500 nM) fails to prevent the neurovascular dysfunction in ApoE4-TR mice, while RAP superfusion (200 nM) is effective. c. rApoE4 induces neurovascular dysfunction in mice lacking CD36. d. The detrimental neurovascular effects of ApoE4 are not sexually dimorphic. Data were analyzed using one-way or two-way ANOVA with Tukey’s or paired two-tailed t-test and are presented as mean±SEM. N = 5/group.
Extended Data Fig. 2 |
Extended Data Fig. 2 |. Smooth muscle vasoactivity, BBB, Iba1+ cell, or BAM engraftment in the mice studied.
a. The NOX peptide inhibitor gp91ds-tat or its scrambled control sgp91ds-tat does not alter the CBF increase induced by neocortical application of adenosine (smooth muscle vasoactivity) in WT, ApoE3-TR, and ApoE4-TR mice, or in WT mice treated with vehicle, rApoE4 or rApoE3. b. BBB permeability to 3kD dextran was not altered in ApoE4-TR mice, with or without i.c.v. administration of CLO. c. CLO does not reduce the number of Iba1+ cells. d. Smooth muscle vasoactivity in ApoE3- or 4-TR mice with or without CLO treatment. e. Smooth muscle vasoactivity in Mrc1Cre+, Mrc1Cre+/ApoE4fl/fl, or Mrc1Cre+/ApoE3fl/fl treated with tamoxifen alone or with rApoE4 (10 μg/ml). f. Numbers of GFP+, CD206+, and GFP-CD206 double-positive cells in WT, ApoE3-TR, ApoE4-TR mice transplanted with GFP+ BM. g. Smooth muscle vasoactivity in ApoE3, ApoE4, WT BM chimeras. Data were analyzed using one-way or two-way ANOVA with Tukey’s test and are presented as mean±SEM. N = 4–5/group.
Extended Data Fig. 3 |
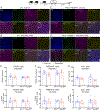
Extended Data Fig. 3 |. Targeting vector, BAM targeting selectivity, and efficiency of ApoE deletion in Mrc1Cre+ mice crossed with R26tdT, ApoE3fl/fl, or ApoE4fl/fl mice.
a. DNA construct used to generate Mrc1Cre+ mice. Tamoxifen (TAM) treatment of Mrc1Cre+/R26tdT crosses induces recombinase activity in over 80–90% of cells expressing the BAM marker CD206 but not in Iba1+ microglia or CD31+ cerebral endothelial cells. N = 5 mice/group; represented images selected from N = 5 mice/group; 2–3 sections analyzed in neocortex per mouse; unpaired t-test; mean±SEM. be. Dual RNAScope in situ hybridization with mRNA probes for Mrc1 (green) and ApoE (magenta), combined with DAPI nuclear staining (blue) and the basement membrane marker laminin (yellow). Representative images showing expression of ApoE in Mrc1+ cells in Mrc1Cre+/ApoE4fl/fl (b) and Mrc1Cre+/ApoE3fl/fl (c) mice treated with vehicle (corn oil). However, in Mrc1Cre+/ApoE4fl/fl (d) and Mrc1Cre+/ApoE3fl/fl (e) mice treated with TAM ApoE levels in Mrc1+ cells are markedly reduced. Scale bars = 20 μm in ae. fg. The number of Mrc1+ cells (f) and their Mrc1 puncta (g) is comparable in vehicle- and TAM-treated Mrc1Cre+/ApoE4fl/fl and Mrc1Cre+/ApoE3fl/fl mice. N = 5 mice/group; 1–2 sections/mouse; 5–12 cells analyzed in neocortex per section; two-way ANOVA with Tukey’s test; mean±SEM.
Extended Data Fig. 4 |
Extended Data Fig. 4 |. ApoE in GFAP+ cells and ApoE levels in CSF and plasma in Mrc1Cre+/ApoE4fl/fl and Mrc1Cre+/ApoE3fl/fl mice.
a-f. Triple or dual RNAScope in situ hybridization with Mrc1 mRNA probes (green in AB), GFAP (gray in AB and green in C-D), and ApoE (magenta), DAPI (blue) and the basal lamina marker laminin (gray in C-D). a, c. In vehicle-treated Mrc1Cre+/AoE4fl/fl (A) and Mrc1Cre+/AoE3fl/fl (C) mice, ApoE expression is found both in Mrc1+ (green, A) and GFAP+ (gray in A and green in C) cells. In tamoxifen (TAM)-treated Mrc1Cre+/AoE4fl/fl (B) and Mrc1Cre+/AoE3fl/f (D) mice, ApoE is deleted in Mrc1+ cells (B), but its expression is not affected in GFAP+ cells (B, D). Representative confocal images (A-D) from N = 3–5 mice/group. Scale bars = 20 μm. EF. The numbers of GFAP+ and ApoE+GFAP+ cells are comparable in vehicle- and TAM-treated Mrc1Cre+/ApoE4fl/fl and Mrc1Cre+/ApoE3fl/fl mice (N = 5 mice/group; 2–3 sections/mice). GH. ApoE levels in CSF (G) and plasma (H), quantified by MSD, are comparable in vehicle- and tamoxifen-treated Mrc1Cre+/ApoE4fl/fl and Mrc1Cre+/ApoE3fl/fl mice. N = 5/group. Data in E-H were analyzed using two-way ANOVA with Tukey’s test and are presented as mean±SEM. N = 5/group.
Extended Data Fig. 5 |
Extended Data Fig. 5 |. Tamoxifen treatment of Mrc1Cre+/ApoE4fl/fl mice reduces ApoE immunoreactivity in CD206+ cells, but not in CD206− cells.
Quadruple labeling with Dapi (nuclei: blue), CD206 (BAM: green), human ApoE (magenta), and CD31 (endothelium: gray) in WT (A, B) or MrcCre+/ApoE4fl/fl (C, F) mice treated with corn oil (A, C) or tamoxifen (B, D). No ApoE immunoreactivity is observed in WT mice, attesting to the specificity of the human ApoE antibody (A, B). In corn oil-treated MrcCre+/ApoE4fl/fl mice strong ApoE immunoreactivity is observed both in CD206+ and CD206 cells (C). However, tamoxifen treatment of MrcCre+/ApoE4fl/fl mice suppresses ApoE immunoreactivity in CD206+ but not in CD206 cells (D) (Scale bar = 100 μm in A-D). The number of CD206+ cells is comparable in corn oil- or tamoxifen-treated WT or MrcCre+/ApoE4fl/fl mice (E). The number of CD206+ApoE+ cells (F), but not CD206ApoE+ cells (G), is markedly reduced in tamoxifen-treated MrcCre+/ApoE4fl/fl mice. Data in E-G were analyzed using two-way ANOVA with Tukey’s test and are presented as mean±SEM. N = 5/group.
Extended Data Fig. 6 |
Extended Data Fig. 6 |. Tamoxifen treatment of Mrc1Cre+/ApoE4fl/fl mice does not alter CD206, TMEM119 or Iba-1 immunoreactivity.
Quadruple labeling with Dapi (nuclei: blue), CD206 (BAM: green), human ApoE (magenta), and CD31 (endothelium: gray) in WT (A, B)or MrcCre+/ApoE4fl/fl (C, D) mice treated with corn oil (A,C) or tamoxifen (B, D). Tamoxifen treatment of WT or MrcCre+/ApoE4fl/fl mice does not alter the number and % area of CD206+ (E) TMEM119+ (F) and Iba1+ cells (G). Scale bars = 100 μm in A-D. N = 5/group. Data in E-G were analyzed using two-way ANOVA with Tukey’s test and are presented as mean±SEM. N = 5/group.
Extended Data Fig. 7 |
Extended Data Fig. 7 |. Effect of ApoE4 on neurovascular function in Mrc1Cre+, ApoE4fl/fl, or Mrc1Cre+/ApoE4fl/fl mice and on ROS in Mrc1Cre+ and Mrc1Cre+/ApoE4fl/fl brain slices.
a. In Mrc1Cre+ mouse, neocortical superfusion of rApoE4 attenuates functional hyperemia and endothelial vasoactivity compared to vehicle (corn oil), but it has no effect on smooth muscle vasoactivity. b. In ApoE4fl/fl mice, neocortical superfusion with RAP (200 nM) reverses the neurovascular dysfunction. c. In vehicle-treated Mrc1Cre+/ApoE4fl/fl mice, functional hyperemia and endothelial vasoactivity, but not smooth muscle vasoactivity, are attenuated as found in ApoE4-TR mice (see Fig. 2a, Extended Data Fig. 2a). In A-C, N = 5/group. d–e. Baseline ROS production in BAM, assessed by DHE in cortical brain slices in which BAM were labeled by i.c.v. injection of Alexa Fluor 680-labeled dextran (10 kDa). ROS production is higher in BAM of MrcCre+/ApoE4fl/fl mice compared to Mrc1Cre+ mice (D) and is reduced by treatment with tamoxifen (E); N = 3–4 mice per group, 1–2 brain slices/mouse, and 3–7 cells/slice; two-tailed t-test. Data are expressed as mean±SEM. Scale bar = 50 μm.
Extended Data Fig. 8 |
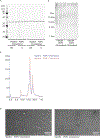
Extended Data Fig. 8 |. Validation steps of preparing the lipidated recombinant ApoE using POPC and cholesterol.
a. Technical replicates of recombinant ApoE3 or ApoE4 lipidated with POPC and cholesterol on an SDS-PAGE gel. ApoE was lipidated at a 1:50:10 molar ratio of ApoE:POPC:Cholesterol. SDS-PAGE was performed under nonreducing (NR) or reducing (R) conditions. Reducing conditions were performed with the addition of 50 mM DTT. One μg of protein was loaded in each well. SDS-PAGE was run on a 4–12% bis-tris gel with MES buffer. Gel was stained with coomassie blue showing only the presence of the ApoE protein. The y-axis represents molecular weight in kDA. Shown are three independent replicates of the samples. b. Native PAGE of technical replicates of recombinant ApoE3 and ApoE4 lipidated with POPC and cholesterol. ApoE was lipidated at a 1:50:10 molar ratio of ApoE:POPC:Cholesterol. One μg of protein was loaded in each well. High molecular weight ladder (Cytiva, 17044501) was detected using PonceauS staining. ApoE was detected by western blot using an anti-ApoE antibody (Academy Bio-Medical, 50A-G1b). Native gel shows the presence of lipidated ApoE. Shown are three independent replicates of the samples. c. FPLC curve of recombinant ApoE3 and ApoE4 lipidated with POPC and cholesterol. Lipidated ApoE was purified from fractions 1520 and verified by negative stain TEM. Samples were run on a Superose 6 Increase 10/300 GL column (Cytiva, 29091596) at 0.5 mL/min in 20 mM phosphate buffer, 50 mM NaCl, pH 7.4. The x axis represents elution volume. d. Negative stain TEM of size exclusion chromatography fractions of recombinant ApoE3 and ApoE4 lipidated with POPC and cholesterol. Negative stain TEM imaging shows the presence of discoidal lipoprotein. Micrographs (N = 1/sample) were taken on a JEOL JEM-1400 at 120 kV at 80,000× magnification (0.138889 nm/pixel).
Extended Data Fig. 9 |
Extended Data Fig. 9 |. Putative pathway by which ApoE4 in BAM induces vascular oxidative stress, neurovascular dysfunction and enhanced white matter injury.
(1) ApoE4 in BAM acts on ApoE receptors, for example, LRP1 as a candidate receptor, to increase intracellular Ca2+ in BAM in a cell autonomous manner resulting in NOX activation, (2) vascular oxidative stress, and (3) neurovascular dysfunction and reduced cerebral perfusion, which, in turn, leads to (4) enhanced white matter damage and cognitive impairment.
Fig. 1 |
Fig. 1 |. The rApoE4 or lipidated rApoE4 alters functional hyperemia and endothelial vasoactivity.
a, Neocortical superfusion of rApoE4 or lipidated rApoE4 attenuating functional hyperemia produced by whisker stimulation and the increase of CBF produced by neocortical superfusion of the endothelium-dependent vasodilator ACh. The increase in CBF produced by neocortical superfusion of the smooth muscle relaxant adenosine (Ade; smooth muscle vasoreactivity) is not impaired (n = 5 per group; one-way ANOVA with Tukey’s test; data presented as mean ± s.e.m.). b, Neocortical superfusion of lipidated rApoE3 not affecting functional hyperemia, endothelial or smooth muscle vasoactivity. c, Neocortical pretreatment with the ApoE receptor inhibitor RAP (200 nM) preventing rApoE4 from altering functional hyperemia and endothelial vasoactivity, but not affecting smooth muscle vasoreactivity. RAP slightly attenuates the CBF response to functional hyperemia in rApoE3-treated mice, but the significance of this small change is unclear (n = 5 per group; one-way ANOVA with Tukey’s test; data presented as mean ± s.e.m.).
Fig. 2 |
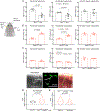
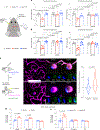
Fig. 2 |. BAMs mediate the deleterious cerebrovascular effects of ApoE4 through NOX-derived ROS.
a, Neocortical superfusion of the NOX peptide inhibitor gp91ds, but not its scrambled control (sgp91ds), rescuing functional hyperemia and endothelial vasoactivity in ApoE4-TR mice. The peptide does affect CBF regulation in ApoE3-TR mice (n = 5 per group; one-way ANOVA with Tukey’s test; data presented as mean ± s.e.m.). b, Pretreatment with gp91ds, but not sgp91ds, preventing the attenuation of functional hyperemia and endothelial vasoactivity induced by neocortical superfusion of rApoE4 in WT mice (10 μg ml−1). CBF responses are not attenuated by rApoE3 and the peptides have no effect (n = 5 per group; one-way ANOVA with Tukey’s test; data presented as mean ± s.e.m.). c, In vivo ROS measurement by two-photon microscopy. Left, WT mice receiving injection i.c.v. of dextran (10 kDa) to label BAMs (blue) and, 24 h later, injection i.v. of the ROS marker DHE (green). Then, WT mice were equipped with an open cranial window and blood vessels were labeled with dextran i.v. (70 kDa, magenta). Middle, representative images illustrating that superfusion of rApoE3 (top) not increasing ROS (green), but superfusion with rApoE4 (bottom) increasing the ROS signal. Right, quantification of ROS production in BAMs (n = 5 mice per group; 3–6 cells per mouse). d, Recombinant ApoE4 (10 μg ml−1), but not rApoE3, increasing ROS production in BAMs and microglia, but not ECs from WT mice. ROS were measured ex vivo by flow cytometry (n = 3 mice per group; one-way ANOVA with Tukey’s test; data presented as mean ± s.e.m.). e, ROS production higher in BAMs of ApoE4-TR mice than in ApoE3-TR mice but not in microglia and ECs (n = 5 mice per group; one-way ANOVA with Tukey’s test; data presented as mean ± s.e.m.). Scale bars for c, 50 μm in left upper and lower panels; 10 μm in the enlarged images in the right panels.
Fig. 3 |
Fig. 3 |. ApoE4 induces Ca2+ currents in BAMs, leading to ROS production.
a, WT cortical brain slices showing penetrating cortical microvessels surrounded by BAMs labeled by Cy3-dextran injected i.c.v. 24 h before sacrifice. Scale bar, 50 μm. b, In patch-clamped BAMs, rApoE4 inducing inward currents that are abolished by the removal of Ca2+ from the medium and blocked by RAP (200 nM). RAP did not prevent the Ca2+ increase induced by ATP (n = 5–12 mice per group; 1 slice per mouse, 1–2 cells per slice; one-way ANOVA with Tukey’s test; data presented as mean ± s.e.m.). c, The rApoE4 increasing ROS production, assessed in Cy3-labelled BAMs using DHE, prevented by Ca2+ removal from the medium (paired two-tailed Student’s t-test; data were acquired from 4–8 mice per group, 1 slice per mouse, 1–2 cells per slice; data presented as mean ± s.e.m.). RFU, relative fluorescence units.
Fig. 4 |
Fig. 4 |. BAM depletion prevents the neurovascular dysfunction induced by ApoE4.
a, BAM depletion by CLO in WT mice. Mice were injected i.c.v. with PBS liposomes (vehicle) or CLO and depletion assessed 7 d later. BAMs (magenta) surround blood vessels labeled by DiO (blue; top). BAM numbers do not differ in WT, ApoE3-TR and ApoE4-TR mice injected with vehicle. CLO depleted BAMs equally in all groups (quantification on right). Scale bar, 1 mm. b, BAM depletion preventing the attenuation in functional hyperemia and endothelial vasoactivity in ApoE4-TR mice compared with WT and ApoE3-TR mice. c, BAM depletion counteracting the deleterious vascular effects of rApoE4 in WT mice (one-way ANOVA and Tukey’s test; n = 5 per group; data presented as mean ± s.e.m.).
Fig. 5 |
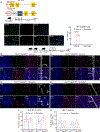
Fig. 5 |. Deletion of ApoE4 selectively in BAMs restores neurovascular function.
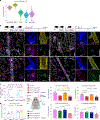
a, BAMs expressing ApoE at levels comparable to those of astrocytes but higher than microglia, ECs and cells of the vascular wall (MCs, mural cells). b, Dual RNAscope in situ hybridization with mRNA probes for Mrc1 (green) and ApoE (magenta), combined with DAPI nuclear staining (blue) and the basement membrane marker laminin (yellow). Representative images illustrate abundant expression of ApoE in Mrc1+ cells in Mrc1Cre+/ApoE4fl/fl and Mrc1Cre+/ApoE3fl/fl mice treated with vehicle (corn oil). However, in Mrc1Cre+/ApoE4fl/fl and Mrc1Cre+/ApoE3fl/fl mice treated with tamoxifen (TAM), ApoE levels in Mrc1+ cells are markedly reduced. Images represent n = 5 per group. c, ApoE puncta quantification in Mrc1+ cells (n = 4–5 mice per group, 1–2 sections per mouse, 5–12 cells per section). In b, larger images on the left were reconstructed using Imaris software and smaller images on the right were cropped from confocal photographs (Extended Data Fig. 2b–e). Scale bars, 20 μm. d, Brain ApoE levels, quantified by MSD (Meso Scale Diagnostics), comparable in vehicle and TAM-treated Mrc1Cre+/ApoE4fl/fl and Mrc1Cre+/ApoE3fl/fl mice (n = 5 per group). e,f, BAM-specific deletion of ApoE restoring functional hyperemia and endothelial vasoactivity in TAM-treated Mrc1Cre+/ApoE4fl/fl mice (n = 5 per group) (e), but not altering CBF responses in TAM-treated Mrc1Cre+/ApoE3fl/fl mice (n = 5 per group) (f). The rApoE4 markedly attenuates functional hyperemia and endothelial vasoactivity in TAM-treated Mrc1Cre+/ApoE4fl/fl and Mrc1Cre+/ApoE3fl/fl mice (n = 5 per group), attesting to the integrity of ApoE4 signaling pathways that lead to neurovascular dysfunction despite BAM ApoE deletion. Data in cf were analyzed using two-way ANOVA with Tukey’s test and are presented as mean ± s.e.m.
Fig. 6 |
Fig. 6 |. ApoE4 in BAMs induces CBF dysfunction in ApoE3-TR mice, whereas ApoE3 in BAMs reverses the dysfunction in ApoE4-TR mice.
a, Mice receiving BM transplantation (BMT) at 2.5 months of age and studied 12 weeks later. b,c, In WT mice transplanted with WT BM (WT → WT), CBF responses (functional hyperemia, b; endothelial vasoactivity, c) are comparable with those in naive WT mice (Figs. 1–3), whereas in ApoE4-TR transplanted with ApoE4 BM (E4 → E4) CBF responses attenuate as in ApoE4-TR mice (Fig. 2a). Remarkably, transplantation of ApoE4 BM into WT (E4 → WT) or ApoE3-TR (E4 → E3) mice attenuates neurovascular responses as in ApoE4-TR mice and, conversely, transplantation of E3 BM into ApoE4-TR mice (E3 → E4) normalizes neurovascular function. Data in b and c were analyzed using one-way ANOVA with Tukey’s test and are presented as mean ± s.e.m.; n = 5 per group.
Fig. 7 |
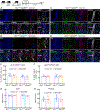
Fig. 7 |. In a model of cerebral hypoperfusion ApoE4 in BAMs worsens CBF reduction and white matter damage in ApoE3-TR mice, whereas ApoE3 in BAMs ameliorates the phenotype.
a, Mice transplanted as in Fig. 6a. After 12 weeks, forebrain hypoperfusion was induced by BCAS. b, The reduction in neocortical CBF assessed by laser-speckle flowmetry worse in E4 → E4 than in E3 → E3 and WT → WT chimeras. However, E3 → E4 BM transplantation ameliorates the CBF reduction whereas E4 → E3 BM transplantation worsened it (n = 5 per group). Representative laser-speckle images were shown from n = 5 per group. Scale bar, 2 mm. Data in b were analyzed with one-way ANOVA and Tukey’s test at each time point and are presented as mean ± s.e.m. P values: 2 h (a = 0.0447, b = 0.0050 and c = 0.0306); 24 h (d = 0.0037, e = 0.0002 and f = 0.0227); 2 weeks (g = 0.0007, h < 0.0001, i < 0.0001 between E3 → E3 and E4 → E4, j < 0.0001 between E3 → E3 and E4 → E3, k < 0.0001 between E3 → E4 and E4 → E3 and l < 0.0001 between E3 → E4 and E4 → E4); and 4 weeks (m < 0.0001, n < 0.0001 between E3 → E3 and E4 → E4, o = 0.0065 between E3 → E4 and E4 → E3, p = 0.0238 between E3 → E3 and E4 → E3, q < 0.0001 between E3 → E3 and E4 → E4 and r < 0.0001). c, KB white matter stain of the corpus callosum in the same groups of mice in which CBF was assessed, showing increased white matter damage in E4 → E3, compared with E3 → E3 chimeras, and reduced white matter damage in E3 → E4 compared with E4 → E4 chimeras (n = 5 mice per group). Scale bar, 100 μm. d, Double-labeling immunofluorescence of MBP (green) and the panaxonal neurofilament marker SMI312 (red) after BCAS, illustrating a worsening of myelin integrity in E4 → E3 chimeras and improvement in E3 → E4 chimeras (n = 5 mice per group). Scale bar, 100 μm. e, Immunofluorescence stain of MBP (green) and the oligodendrocyte marker Olig2 (red) illustrating a worse oligodendrocyte depletion in E4 → E3 compared with E3 → E3 chimeras and an improvement in E3 → E4 compared with E4 → E4 chimeras (n = 5 mice per group). Scale bar, 100 μm. f, Immunofluorescence stain of the nodal Nav1.6 channels (red) and the paranodal protein Caspr (green) showing increased nodal exposure in E4 → E3 compared with E3 → E3 chimeras and an improvement in E3 → E4 compared with E4 → E4 chimeras (n = 5 per group). Scale bar, 3 μm. In bf, representative images are shown on the left and related quantification on the right; representative images for each group are selected from ten sections (two sections per mouse) on which quantification was done. Data in bf, were analyzed using two-way ANOVA with Tukey’s test and are presented as mean ± s.e.m.
Fig. 8 |
Fig. 8 |. In a model of cerebral hypoperfusion, ApoE4 in BAMs worsens cognitive deficits in ApoE3-TR mice, whereas ApoE3 in BAMs ameliorates the cognitive phenotype.
a,b, In agreement with the CBF and white matter damage data, E4 → E3 chimeras exhibiting worse cognitive deficits than E3 → E3 chimeras at the novel object recognition (a, n = 10–12 per group) and Y-maze (b, n = 10–12 per group) tests, whereas E3 → E4 chimeras exhibit cognitive improvement compared with E4 → E4 chimeras. Indices of locomotor activity, recorded during the novel object recognition test (distance traveled) or the Y-maze test (number of arm entries), do not differ among groups. Data in a and b were analyzed using two-way ANOVA and Tukey’s test and are presented as mean ± s.e.m.

Update of

References

    1. Iadecola C et al. The neurovasculome: key roles in brain health and cognitive impairment: a scientific statement from the American Heart Association/American Stroke Association. Stroke 54, e251–e271 (2023). - PMC - PubMed
    1. Iadecola C et al. Vascular cognitive impairment and dementia: JACC Scientific Expert Panel. J. Am. Coll. Cardiol 73, 3326–3344 (2019). - PMC - PubMed
    1. Vemuri P et al. White matter abnormalities are key components of cerebrovascular disease impacting cognitive decline. Brain Commun 3, fcab076 (2021). - PMC - PubMed
    1. Festa LK, Grinspan JB & Jordan-Sciutto KL White matter injury across neurodegenerative disease. Trends Neurosci 47, 47–57 (2024). - PMC - PubMed
    1. McAleese KE et al. Frontal white matter lesions in Alzheimer’s disease are associated with both small vessel disease and AD-associated cortical pathology. Acta Neuropathol 142, 937–950 (2021). - PMC - PubMed

LinkOut - more resources