. 2024 Nov;27(11):2086-2100.
doi: 10.1038/s41593-024-01753-w. Epub 2024 Sep 18.

Inhibiting Ca2+ channels in Alzheimer's disease model mice relaxes pericytes, improves cerebral blood flow and reduces immune cell stalling and hypoxia

Affiliations

Inhibiting Ca2+ channels in Alzheimer's disease model mice relaxes pericytes, improves cerebral blood flow and reduces immune cell stalling and hypoxia

Nils Korte et al. Nat Neurosci. 2024 Nov.

Abstract

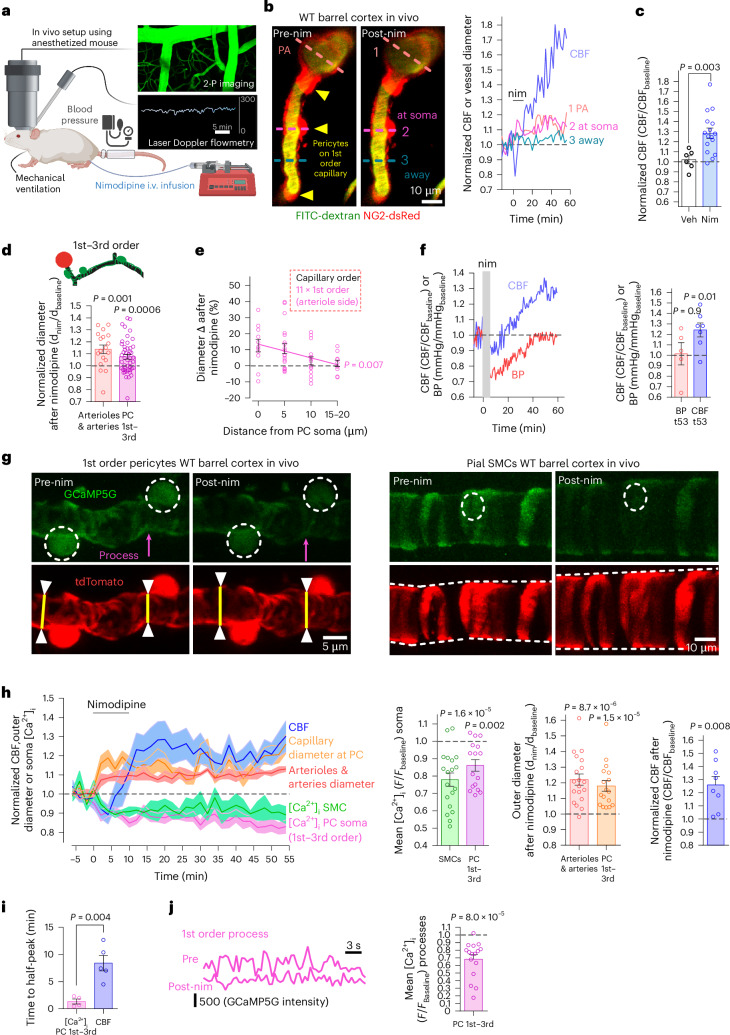
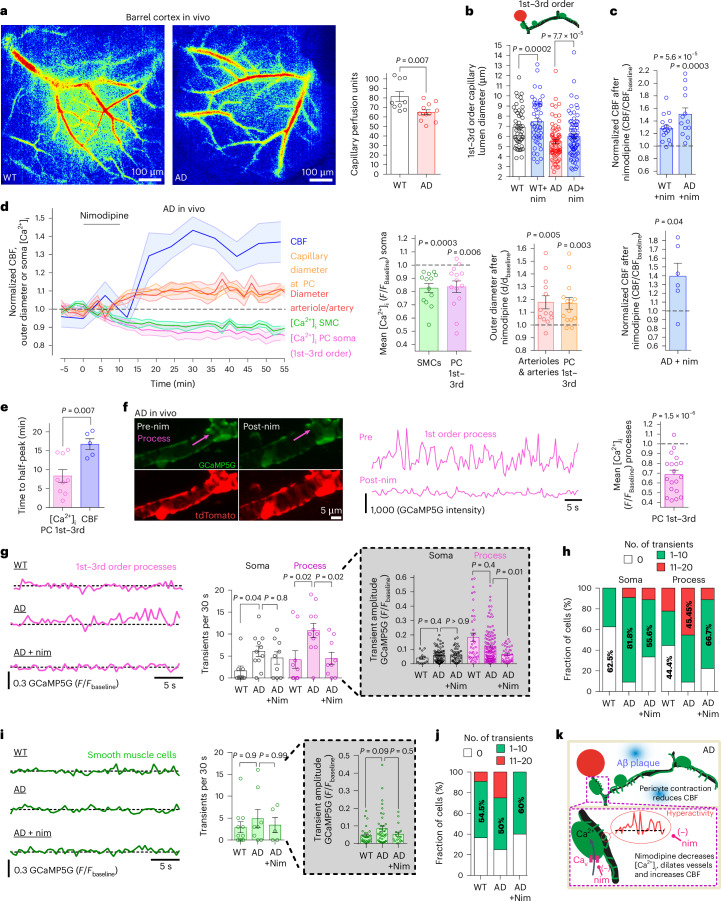
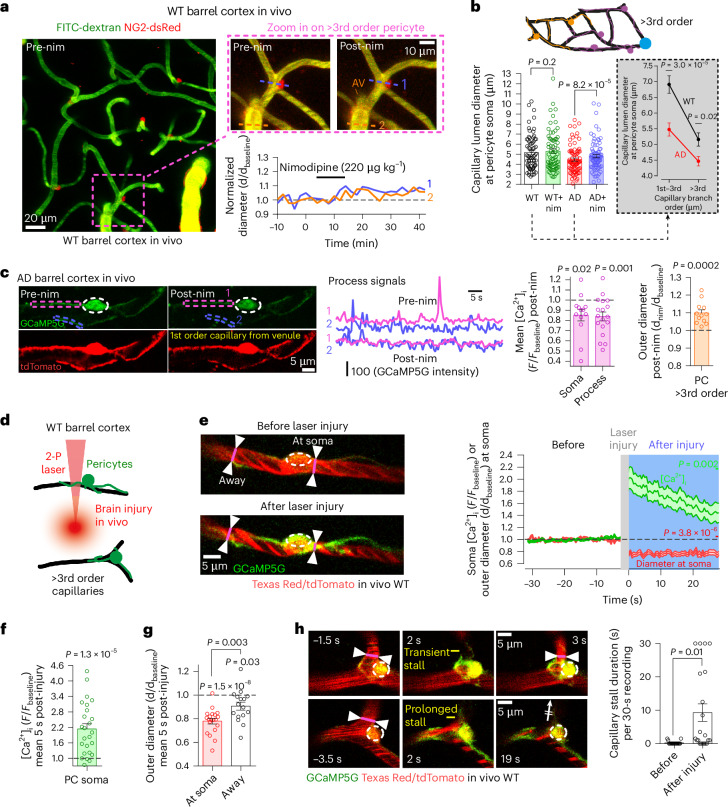
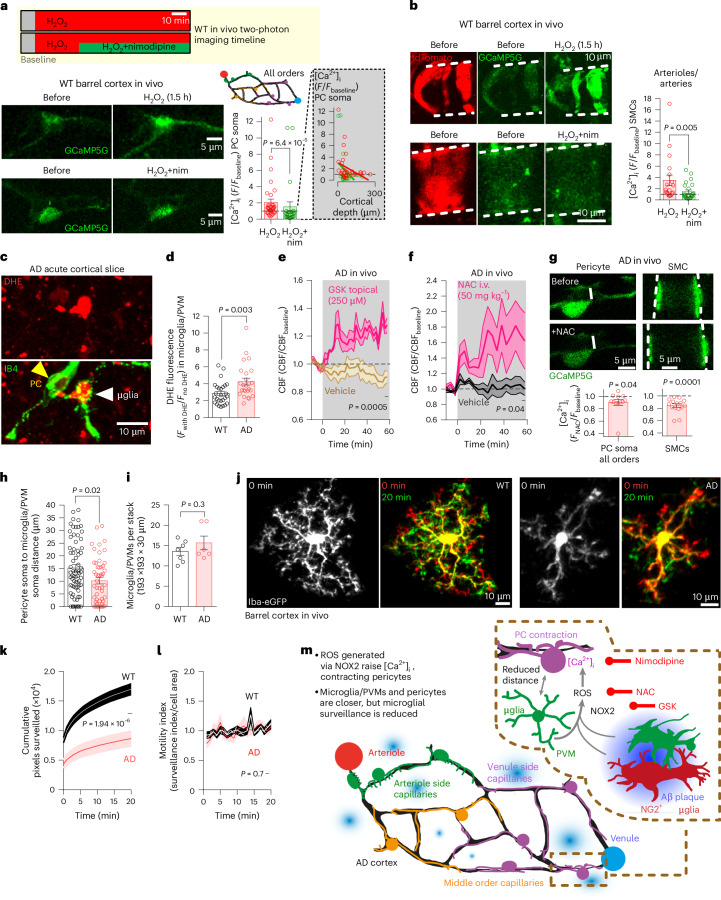
Early in Alzheimer's disease (AD), pericytes constrict capillaries, increasing their hydraulic resistance and trapping of immune cells and, thus, decreasing cerebral blood flow (CBF). Therapeutic approaches to attenuate pericyte-mediated constriction in AD are lacking. Here, using in vivo two-photon imaging with laser Doppler and speckle flowmetry and magnetic resonance imaging, we show that Ca2+ entry via L-type voltage-gated calcium channels (CaVs) controls the contractile tone of pericytes. In AD model mice, we identifed pericytes throughout the capillary bed as key drivers of an immune reactive oxygen species (ROS)-evoked and pericyte intracellular calcium concentration ([Ca2+]i)-mediated decrease in microvascular flow. Blocking CaVs with nimodipine early in disease progression improved CBF, reduced leukocyte stalling at pericyte somata and attenuated brain hypoxia. Amyloid β (Aβ)-evoked pericyte contraction in human cortical tissue was also greatly reduced by CaV block. Lowering pericyte [Ca2+]i early in AD may, thus, offer a therapeutic strategy to enhance brain energy supply and possibly cognitive function in AD.


Conflict of interest statement

The authors declare no competing interests.

Figures

Fig. 1
Fig. 1. CaVs generate tone in SMCs and 1st–3rd order pericytes in WT mice in vivo.
a, Barrel cortex of anesthetized intubated mouse: FITC-dextran (green) in blood, laser Doppler for CBF, tail cuff measures BP (created with BioRender). b, Left, imaging of FITC-dextran in PA and 1st order capillary before and after i.v. nim in NG2-dsRed mouse (arrows: pericytes). Right, diameters at dashed lines on left, and CBF. c, Nim raises CBF compared to vehicle (veh). P value: Mann–Whitney test. d, Normalized diameter of pial arteries/PAs and capillaries at 1st–3rd order pericytes (0–5 μm from soma center) after nim (schematic from Extended Data Fig. 1a). e, Nim-evoked change in 1st order capillary diameter is largest at pericyte somata. P value assesses if the line slope is non-zero. f, Left, specimen nim-evoked changes in BP and CBF. Right, mean CBF (1–2 points per animal with 1–2 Doppler probes) and BP (one point per animal) after i.v. nim. Shortest recording was 53 min, so this timepoint (t53) was plotted for all traces. g, In vivo two-photon images of 1st order capillary pericytes and pial artery SMCs expressing GCaMP5G and tdTomato in NG2-CreERT2-GCaMP5G mice. Yellow lines, capillary outer diameter; magenta arrow, nim-evoked [Ca2+]i drop in process. h, Left, normalized (mean ± s.e.m.) change in CBF, diameter of arterioles and capillaries and [Ca2+]i in SMCs and pericytes, after nim. Bar graphs: (left) nim-evoked fall in [Ca2+]i evoking (middle) vasodilation at 1st–3rd order pericytes and SMCs, facilitating (right) CBF increases in NG2-CreERT2-GCaMP5G mice (as in NG2-dsRed or WT mice: c,f). Bars include some data acquired before and after nim without the whole timecourse being defined. i, Time to half-peak change of [Ca2+]i or CBF for h. j, Left, nim reduces mean [Ca2+]i in the pericyte process (pre-/post-nim traces start ~2,500/2,000 units above zero, respectively). Right, mean [Ca2+]i in processes in nim relative to baseline. P values are from paired t-tests in d,f,h,j (for SMC and process [Ca2+]i, arteriole/artery diameter and CBF), Wilcoxon test in h (pericyte [Ca2+]i and diameter) and unpaired t-test in i. P values are two-tailed. Error bars: s.e.m. 2-P, two-photon; nim, nimodipine; Veh, vehicle. Source data
Fig. 2
Fig. 2. Pericyte-mediated capillary constriction and CBF decrease involve CaVs.
a, Laser speckle imaging in the barrel cortex of WT and AD mice; blue/red show low/high perfusion. Capillary perfusion (between large vessels) was reduced in AD. P value: unpaired t-test. b, Capillary diameters 0–5 µm from soma center of 1st–3rd order pericytes in vivo in WT or AD NG2-dsRed mice (FITC-dextran in blood). P values: WT versus WT+nim paired t-test, AD versus AD+nim Wilcoxon test. WT data are from Fig. 1. c, Nim raises CBF (laser Doppler) in mature WT and AD (NG2-dsRed) mice. WT data are from Fig. 1c. d, Left, mean (±s.e.m.) normalized CBF, capillary diameter and pericyte soma [Ca2+]i after i.v. nim in mature AD NG2-CreERT2-GCaMP5G mice. Bar graphs: nim reduces [Ca2+]i in 1st–3rd order pericytes and SMCs, evoking dilation and raising CBF. Bars include some data acquired before and after nim without the whole timecourse being defined. e, Time to half-peak change of [Ca2+]i or CBF in d. P value: unpaired t-test. f, Nim reduces [Ca2+]i (image; also shows dilation) and its fluctuations (middle: pre-nim trace starts 3,004 units above zero) in processes of 1st–3rd order pericytes (AD cortex in vivo: see Supplementary Video 2). Right bar graph: mean [Ca2+]i in processes in nim relative to baseline. P values in c,d,f from paired t-tests. g,h, Quantification of Ca2+ transients in 1st–3rd order pericyte processes and somata (2-Hz acquisition). g, [Ca2+]i traces in processes of WT and AD mice with and without nim. Bar charts: transient rates and amplitudes in somata and processes. h, Fraction of cell somata or processes with transient rates/30 s in different ranges. i,j, As g,h but for SMCs. k, Summary: Aβ accumulation raises Ca2+ transient rates and mean [Ca2+]i, evoking pericyte contraction, capillary constriction and reduced CBF; nim reverses these changes. P values in g (soma rate and amplitudes) and i are from Kruskal–Wallis test with Dunn’s multiple comparison test and in g (process rate) from one-way ANOVA with Dunnett’s multiple comparison test. P values are two-tailed. Error bars are s.e.m. nim, nimodipine. Source data
Fig. 3
Fig. 3. Mid-capillary bed pericytes exert enhanced contractile tone in AD mice.
a, In vivo two-photon imaging of mid-capillary bed in the barrel cortex of a WT NG2-dsRed mouse with FITC-dextran in the blood. Lines in the inset show sites of diameter measurements (graph: nim has little effect in WT vessels) at a pericyte soma (red, 1) on a capillary of >3rd branch order from the nearest PA and 2nd branch order from the AV, and at the AV (2). b, Intravenous nim partially restores capillary diameter decreases at the soma of >3rd order pericytes in AD NG2-dsRed mice. Inset: capillary diameter as a function of branch order in WT and AD mice in the absence of nim. P values for WT versus WT+nim (pre-nim versus post-nim) and AD versus AD+nim are from (paired) Wilcoxon tests; those for WT versus AD are from unpaired Mann–Whitney tests. c, Nim reduces [Ca2+]i in the soma and processes of >3rd order pericytes in vivo in AD NG2-CreERT2-GCaMP5G mice (images, colored traces are for processes 1 and 2 on images; pre-nim traces start at 368 and 310 for 1 and 2; left bar graph shows mean normalized changes). Nim evokes capillary dilation at pericyte somata (right bar graph). d, Schematic of laser-evoked in vivo brain injury near >3rd order capillaries in the barrel cortex of WT NG2-CreERT2-GCaMP5G mice. eg, Laser-evoked injury raises [Ca2+]i (e,f) and contracts >3rd order pericytes near their somata (e,g; see also Supplementary Video 4 and Extended Data Fig. 4b). Injury-evoked capillary constriction was attenuated away from pericyte somata (g, P values above bars compare bar means with unity). h, Brain injury induces capillary stalling of blood near pericyte somata. Transient and prolonged capillary blocks were seen as in top and bottom panels. P values are from paired t-tests in c,f, paired and unpaired t-tests in g and a Wilcoxon test in e,h. P values are two-tailed. Error bars are s.e.m. 2-P, two-photon; nim, nimodipine. Source data
Fig. 4
Fig. 4. ROS from brain immune cells drive pericyte contraction in AD mice.
a, In vivo two-photon imaging of pericytes in the barrel cortex of NG2-CreERT2-GCaMP5G mice before and after H2O2 application without or with nim (see timeline). Inset: H2O2-evoked [Ca2+]i rise versus cortical depth. b, As a but for SMCs of pial arteries and PAs (green signal is [Ca2+]i; red is td-Tomato expressed with GCaMP5g). c, Confocal image of parenchymal microglial (μglia) cell generating ROS (DHE) in acute cortical slice of AD mouse (microglia and pericytes (PCs) labeled using IB4). d, Microglia generate more ROS in AD than in WT. e, In AD mice, NOX2 block with GSK2795039 (but not vehicle) increases CBF. f,g, The antioxidant NAC (but not vehicle) increases CBF (f) and lowers [Ca2+]i in pericyte somata and SMCs (g). h, Cortical microglia/PVMs are closer to pericytes in AD mice than in WT mice (assessed as distance of NG2-dsRed-labeled pericyte soma surface to Iba1-stained cell surface). i, Microglia/PVM numbers do not differ in the barrel cortex of mature WT and AD mice. j, In vivo two-photon imaging of microglia in WT and ADxIba1-eGFP mice. Overlay of 0 min (red) and 20 min (green) images shows that microglia extend and retract processes over time. k, Cumulative number of pixels surveilled by 21 WT and 16 AD microglia in maximum intensity projection images as in j. Initial value is cell area at t = 0. l, Microglial motility index (ratio of surveillance index to cell area) is unaltered in AD mice. m, Pathway evoking capillary constriction in AD. Lower left, vascular schematic with Aβ plaques (blue) surrounded (top right) by NG2 (green) and NG2+ (red) microglia. Top right, ROS generated by microglia and NG2-expressing microglia raise PC [Ca2+]i and evoke contraction. Targeting the pathway by blocking CaVs with nim or ROS with NAC or GSK improves CBF. P values are from Mann–Whitney tests in ad,f,h, unpaired t-tests in e,i,k,l and a Wilcoxon test and paired t-test in g for PCs and SMCs, respectively. P values are two-tailed. Error bars are s.e.m. nim, nimodipine. Source data
Fig. 5
Fig. 5. CaV inhibition reduces pericyte-evoked capillary block by blood cells in AD.
a, Imaging cortex of NG2-dsRed WT and AD mice; FITC-dextran in blood. Yellow triangles: pericytes at blocks (Supplementary Video 6). Plot: percentage of capillary segments with blocks in 94 μm × 94 μm × 10 μm image stacks. b, Probability distribution of distance of nearest pericyte soma to block (black) in AD cortex. Magenta: prediction for pericytes uniformly spaced along capillary (Extended Data Fig. 2b) if blocks occur randomly (P value: Kolmogorov–Smirnov test). c, Percentage of blocks in different branch order capillaries from PA or AV in AD. d, In vivo imaging of Ly6G-labeled neutrophils or Iba1-eGFP-expressing monocytes in lumen (labeled with Texas Red or (left-most and top right panels) outlined by NG2-dsRed pericyte processes). Yellow arrows: left, pericyte circumferential processes; right, PVMs and monocytes (top right, monocyte also indicated by a green line). Blue boxes: blocks without neutrophils or monocytes. Graph: percentage of capillaries with blocks containing neutrophil or monocyte (Supplementary Videos 7 and 8). e, Stall duration of cells in AD cortex. f, Capillary images and diameters during neutrophil stall in AD (Supplementary Video 9). Graph: stalled neutrophils are larger than capillary lumen (without a neutrophil) where they stall. g, Stalled monocytes are not larger than capillaries they stall in. h, AD mice perfused with FITC-albumin in gelatin (re-colored red) when alive (to label patent vessels) show impaired perfusion at pericyte somata (yellow triangles). Capillary blocks contain Ly6G-labeled neutrophils (top), CD45-labeled leukocytes (bottom left) and ter119-labeled RBCs (bottom right). Aβ plaques labeled with 82E1 in top image. ik, Nimodipine in vivo largely restores capillary perfusion (percent of vessel segments that are patent) at Aβ plaques (i, pale pink bar is for capillaries away from plaques) and reduces the number of leukocytes (j) and RBCs (k) stuck in capillaries. Note, there may be more than one cell type per block, with RBCs also present at leukocyte blocks. P values are from Mann–Whitney tests in a,dg, and Kruskal–Wallis tests in ik. P values are two-tailed. Error bars are s.e.m. Source data
Fig. 6
Fig. 6. Nimodipine improves CBF and reduces brain hypoxia in AD mice and reduces Aβ-evoked pericyte contraction in human brain tissue.
a, Schematic of long-term nim or vehicle treatment via the drinking water for 1.5 months starting from 2–3 months of age in WT and AD mice and use of mice for MRI, hypoxia assessment or immunohistochemistry (created with BioRender). b, Long-term nim increased the diameter of capillaries, arterioles and arteries in AD cortex. P values are from unpaired t-test for 1st–3rd order capillaries and Mann–Whitney tests for >3rd order and arterioles/arteries. c, Nim reduces stalling in >3rd order capillaries in AD mice (see also Supplementary Video 10). P values are from Mann–Whitney tests. d, CBF (from MRI) was increased in the thalamus of AD mice treated with nim (each point is one animal). P value is from unpaired t-test. e,f, AD increased and nim reduced in vivo labeling with pimonidazole (to identify hypoxia) in the cortex (e) and hippocampus (f) (P values are from Kruskal–Wallis test and one-way ANOVA, respectively). g, Nim reduces plaque-associated labeling with LAMP1 (P values are from Kruskal–Wallis test). h,i, Effect of nim on human pericytes. h, Top schematic: human tissue from neurosurgery was transported on ice-cold aCSF, incubated for 120 min in aCSF or Aβ with or without nim and fixed for tissue clearing and confocal imaging (created with BioRender). Bottom schematic: specimen images of fixed human cortical tissue incubated in aCSF (left image and middle zoom-in image) or 75 nM soluble Aβ oligomers (right image) when alive and labeled with isolectin B4 to identify pericytes (arrows) and measure capillary diameter (red lines at yellow arrowheads). i, Mean capillary diameter at approximtely 5 µm and ≥20 µm from the pericyte soma in human cortical tissue incubated in aCSF (n = 99 pericytes) or Aβ in the absence (n = 145) or presence (n = 120) of nim (P values are from one-way ANOVA for 5-µm distance and from Kruskal–Wallis test for ≥20-µm distance; additional P values are stated in the main text). P values are two-tailed. Error bars are s.e.m. 2-P, two-photon; nim, nimodipine; veh, vehicle. Source data
Extended Data Fig. 1
Extended Data Fig. 1. L-type voltage-gated Ca2+ channels and Ca2+-gated Cl channels interact to control pericyte contraction.
a Anatomy of mural cells (defined by NG2-tdTomato label, recolored as below, in NG2-CreERT2-GCaMP5G-IRES-tdTomato mice) across the cerebral vasculature. SMCs form rings around pial arteries and penetrating arterioles (PAs, red image, red in schematic), pericytes of 1st-3rd branching order (green) from PAs wrap circumferential processes around capillaries, pericytes in the middle (orange) and on the venule side (purple, 1st-3rd branch order from venule, blue) of the capillary bed show more longitudinal and fewer circumferential processes (Supplementary Video 1). b Two-photon microscopy images (maximum intensity projections) of pericytes on 1st-3rd order capillary branches in acute cortical slices from wild-type NG2-CreERT2-GCaMP5G mice. Endothelin-1 (ET-1) was applied in the absence or presence of nimodipine (CaV blocker) and [Ca2+]i in pericyte somata (white dashed circles) and capillary diameter (white line) were measured. c Left: time course of ET-1 evoked [Ca2+]i rise in pericytes in the absence or presence of nimodipine or 10bm (TMEM16A blocker). Right: nimodipine or 10bm reduce the ET-1 evoked pericyte [Ca2+]i rise. P values from one-way ANOVA. d Nimodipine and 10bm reduce the ET-1 evoked capillary constriction at pericyte somata. P values from KruskalWallis test. e Nimodipine reduces ET-1 evoked [Ca2+]i rise in SMCs. P value from unpaired t-test. f Incubation with vehicle used to dissolve nimodipine does not alter pericyte [Ca2+]i, but ET-1 applied in last 4 mins of recording raised [Ca2+]i, confirming pericytes remain responsive to ET-1 during prolonged imaging. P value from unpaired t-test. g Proposed mechanism of ET-1 evoked pericyte contraction (see also refs. ,): ET-1 evoked Ca2+ release from stores activates TMEM16A Ca2+-gated Cl channels. The resulting Cl efflux depolarises the pericyte, which promotes Ca2+ entry via CaVs, activating myosin-light chain kinase (MLCK) and pericyte contraction. h-i In awake head fixed mature WT mice, imaging (h) revealed that nimodipine (220 μg/kg i.v.) dilates arterioles/arteries, and capillaries (i). P values from unpaired t-tests. P-values are 2-tailed. Error bars are s.e.m. Source data
Extended Data Fig. 2
Extended Data Fig. 2. Pericytes show most circumferential process coverage near their somata.
a Left: arteriole side and venule side pericytes. Right: Pericyte coverage decreases with distance from pericyte soma centre (0 µm), and in AD is enhanced on venule side of capillary bed. Fluorescence intensity of processes at different distances along vessel from soma (averaged across the lumen) was normalised to value at pericyte soma centre (see also ref. for counts of circumferential processes versus distance). b Length of 3D-traced capillaries (between arteriole and venule) per pericyte did not differ between mature WT (106 pericytes/13337 µm capillary length) and AD mice (84 pericytes/11509 µm capillary length; see also Extended Data Fig. 10f with mature and old mice). c Nimodipine evoked CBF increases in mature WT and AD mice regardless of dsRed or NG2-CreERT2-GCaMP5g co-expression (these data are also plotted in Extended Data Fig. 10a as mature mice). d As in Fig. 2d and f, but infusing vehicle for nimodipine. e-g GCaMP fluorescence. e In vivo GCaMP5g traces of pericytes (cells 1-3, all >3rd branch order) in cortex imaged (2 Hz) at 940 nm (where GCaMP5g signal reflects [Ca2+]i) or 800 nm (where signal is [Ca2+]i-independent; Supplementary Video 3). f Frequency and amplitude of [Ca2+]i transients in somata and processes from images like (e) (one 1st, one 2nd and five >3rd order pericytes). g Mean GCaMP fluorescence excited at 940 and 800 nm in pericyte somata of AD mice. h Ca2+ transient frequency and amplitude in >3rd branch order pericyte processes and somata. i Ca2+ transient frequency in somata versus processes of 1st-3rd or >3rd order pericytes. j Ca2+ transient frequency in 1st-3rd versus >3rd order pericyte somata and processes. P values from unpaired t-tests in panels b, c, f, g, i (for AD data) and j (except for WT soma data), from paired t-tests in d, from a KruskalWallis test with Dunn’s multiple comparison for h except for p-values assessing transient frequency which were from one-way ANOVA, and a Mann-Whitney test for i (WT) and j (WT soma). P-values are 2-tailed. Error bars are s.e.m. Source data
Extended Data Fig. 3
Extended Data Fig. 3. Pericytes and smooth muscle cells express CaV1.2 L-type Ca2+ channels.
a-d Single-cell RNA sequencing in mouse cortex (left bar chart) and histology of human cortex (black labeling on right images), respectively, reveal pericyte (PC) expression of CaV1.2 (a) but little or no expression of CaV1.3 (b), CaV1.1 (c) or CaV1.4 (d). Abbreviations: mRNA level (counts), venous smooth muscle cells (vSMCs), arteriolar SMCs (aSMCs), arterial SMCs (aaSMCs), microglia (MG), two fibroblast classes (FB1, FB2), oligodendrocytes (OL), three classes of broadly distributed endothelial cells (EC1-EC3), venous ECs (vEC), capillary ECs (capilEC), arterial ECs (aEC), and astrocytes (AC). Data obtained from refs. , (v23.proteinatlas.org). e Single-cell RNA sequencing of the BBB in patients with AD or control individuals (with no cognitive impairment) indicates that CaV1.2 is expressed in pericytes (T-PC, M-PC) and SMCs (aSMC, aaSMC), although with some decrease in AD (red arrows). Other abbreviations: arterial (ART), capillary (CAP), venous (VEN), perivascular fibroblast (P.FB), meningeal fibroblast (M.FB), T cell (TC), Ependymal (EPEN), astrocyte-hippocampus (AST-Hpc), astrocyte-cortex (AST-Ctx), perivascular macrophage (PM), microglia (MG), oligodendrocyte (OL), Oligodendrocyte Precursor Cell (OPC), Neuron (NEU). Data from ref. . Error bars are s.e.m.
Extended Data Fig. 4
Extended Data Fig. 4. Capillaries in the middle and on the venule side of the capillary bed are a major vascular compartment, covered by pericytes that generate contractile tone in response to laser injury (unlike pericytes and SMCs on the arteriole side of the vascular bed).
a 3D capillary tracing of barrel cortex microvasculature in vivo from the start of the 1st capillary branch off a penetrating arteriole (star, also shown in (b) as a z projection without the overlying pial artery; note that in (a) the arteriole is hidden behind the artery) to the start of the venule (diamond) connecting to a pial vein in an NG2-CreERT2-GCaMP5g WT mouse (with Texas Red given i.v.). Left bar graph: shortest capillary length between PA and AV. Right bar graph: capillaries of the >3rd branch order comprise >90% of the total capillary length in WT and AD mice. b Left: low magnification in vivo two-photon z projection of capillaries branching from arteriole (star marking start of 1st capillary branch as shown in 3D in (a)) in WT mouse. Branching orders in high magnification images on the right and in the bottom [Ca2+]i traces are indicated as numbers; these images are color-framed (according to position in vascular bed, see inset) and shown pre- and post-laser injury. Bottom traces: laser injury evoked [Ca2+]i rises increase with increasing vessel branching order (see also Fig. 3d–h and Supplementary Video 4). The 7th order capillary in the low power view is the same capillary rotated in Fig. 3e. c-d Laser injury does not significantly modulate [Ca2+]i or diameter of arterioles (c) or 1st-2nd order capillaries (d) in WT mice (see also Supplementary Video 5). P-values are 2-tailed. Error bars are s.e.m. Source data
Extended Data Fig. 5
Extended Data Fig. 5. Brain immune cells generate ROS in AD.
a scRNA sequencing in mouse cortex and human brain: the major cerebral ROS-generating NADPH oxidase, NOX2, is only expressed in microglia/PVMs. Upper graph abbreviations: mRNA level (counts), pericytes (PCs), venous SMCs (vSMCs), arteriolar SMCs (aSMCs), arterial SMCs (aaSMCs), microglia (MG), fibroblast classes (FB1, FB2), oligodendrocytes (OL), broadly-distributed endothelial cell classes (EC1-EC3), venous ECs (vEC), capillary ECs (capilEC), arterial ECs (aEC), astrocytes (AC), from. Lower graph: 45 clusters (c-0 to c-44) of neuronal and glial cells including MG, ACs, oligodendrocyte progenitor cells (OPCs) and subtypes of excitatory neurons, inhibitory neuons and OLs, from ref. (v23.proteinatlas.org). b Top: confocal images of live AD acute cortical slice with DHE-labeling of ROS in microglia (white arrow) but not pericytes (yellow arrow) or extravascular cells (blue asterisks). Bottom: DHE labeling quantification in WT and AD cortical slices in pericyte somata, capillary segments without (w/o) pericyte somata and (non-immune) extra-vascular cells. c Mitochondrial ROS measured using MitoSOX in microglia or pericyte somata does not differ in WT and AD slices. P values: b-c from Mann-Whitney tests,d from paired t-test. d Laser speckle imaging in barrel cortex of AD mice in vivo shows intravenous glutathione (GSH) does not alter capillary perfusion. e NG2-expressing microglia are in cortex but not cerebellum of mature AD mice nor in cortex and cerebellum of WT mice. f Top: NG2-expressing microglia (arrow heads) but not pericytes (PCs) express Iba1 and P2Y12Rs. Bottom: NG2-expressing microglia cluster around Aβ plaques (labeled with 82E1 antibody). g Percentage of Iba1 cells co-labeling for NG2. h Most Iba1-NG2-labeled cells co-express P2Y12Rs. i Most NG2-expressing microglia are at Aβ plaques. j Number of NG2-expressing microglia increases with ageing in AD cortex. P-value for AD cortex (cx) graph assesses whether the slope of linear regression fit deviates from 0 (cb=cerebellum). k ROS generation measured using CellROX is increased in immune cells at and away from plaques in AD cortex. The antioxidant NAC reduces ROS production. P values are from Mann-Whitney tests for Iba1+ cells and unpaired t-tests for NG2-expressing microglia. P-values are 2-tailed. Error bars are s.e.m. Source data
Extended Data Fig. 6
Extended Data Fig. 6. Microglial and perivascular macrophage (PVM) interactions with pericytes are enhanced in AD mice.
a In vivo two-photon imaging in the barrel cortex of WT and AD x Iba1-eGFP x NG2-dsRed mice used to quantify the percentage of microglia/PVM somata <10 µm vs. >10 µm from the nearest pericyte soma. Yellow and light red triangles point at pericytes that are <10 and >10 µm from microglia/PVMs, respectively. b Microglia/PVMs are located closer to 1st-3rd order and >3rd order pericytes in AD mice (co-expressing NG2-dsRed either with Iba1-eGFP or CX3CR1-eGFP) than in WT mice. c CD206-labeled PVMs in the pia mater (top panel), along venules and arterioles (bottom left and right panel), and on capillaries of the 1st-2nd branch order off an arteriole (bottom middle and right panels). Blue triangles point at pericytes that are <10 µm from PVMs. Yellow and light red triangles point at pericytes that are <10 and >10 µm from P2Y12R-labeled microglia, respectively. d Mean number of PVMs per capillary segment decreases as the branch order from the arteriole increases (quantified from images as shown in c). e Percentage of 1st-3rd order pericytes closest to a CD206 or P2Y12R-labeled cell in fixed cortical tissue from WT and AD mice. f Distance of 1st-3rd order pericyte soma to P2Y12R or CD206-expressing soma quantified from images such as shown in e. g Fixed AD cortical tissue imaging of Alexa Fluor 647 conjugated NOX2 antibody (or 647-excited autofluorescence control) in microglia and PVMs. P values in panels a and upper bar graph of f are from unpaired t tests and in b and lower bar graph of f from Mann-Whitney tests. P-values are 2-tailed. Error bars are s.e.m. Source data
Extended Data Fig. 7
Extended Data Fig. 7. Long-term nimodipine treatment does not modulate cortical expression of VCAM-1 or ICAM-1 in endothelial cells of AD mice and blood leukocyte numbers do not differ between WT and AD mice.
a Confocal images of VCAM-1 and endothelial CD31 staining in fixed cortical slices after ~1.5 months of treatment with the vehicle for nimodipine (DMSO) in an AD (NG2-dsRed) mouse. Capillaries branch from the ascending venule (left) and penetrating arteriole (right). b-c VCAM-1 fluorescence intensity measured in capillaries (b) or arterioles/venules (c) of WT mice treated with vehicle or in AD mice treated with vehicle or nimodipine in the drinking water. d Confocal images of ICAM-1 and CD31 staining in fixed cortical slices in an AD (NG2-dsRed) mouse. Right: high magnification image of 2nd-4th order capillaries branching from the arteriole. e-f ICAM-1 fluorescence intensity in capillaries (e) or arterioles/venules (f) of WT mice treated with vehicle or AD mice treated with vehicle or nimodipine in the drinking water. g Circulating leukocyte and neutrophil numbers counted using flow cytometry do not differ between WT and AD mice. h 52% of stalled neutrophils are within 10 µm of the pericyte soma centre in AD cortex. i Capillary perfusion and the number of capillaries containing adhering neutrophils does not differ between WT and AD cerebellum. j Low-dose anti-Ly6G (0.1 mg/kg i.v.) treatment for 1.5 hrs (to reduce β2 integrin surface expression without depleting neutrophils) increases cerebral blood flow in AD mice. Co-injection of anti-Ly6G with the monocyte marker F4/80 (0.1 mg/kg) results in a similar CBF increase in AD mice as anti-Ly6G injection alone. k Proposed mechanism. Ly6G, a glycosylphosphatidylinositol (GPI)–anchored protein, promotes β2 integrin surface expression in neutrophils required for adhesion to VCAM-1 and ICAM-1 on endothelial cells. A low dose of anti-Ly6G ligates Ly6G without inducing neutrophil death resulting in reduced integrin-mediated adhesion and increased cerebral blood flow in AD mice. P values in panels b, c and e are from KruskalWallis tests, in f from a one-way ANOVA, in i from Mann-Whitney tests and in j from paired t-tests and an unpaired t-test. P-values are 2-tailed. Error bars are s.e.m. Source data
Extended Data Fig. 8
Extended Data Fig. 8. Drinking water intake, mouse weight, brain volume and plaque load are unchanged by long-term nimodipine treatment in AD mice.
a Daily drinking volume per AD mouse weight of nimodipine or vehicle (DMSO) supplemented water over 1.5 months. b Nimodipine does not modulate mouse weight compared to vehicle treatment alone. c High resolution in vivo MRI scans of AD mice treated for 1.5 months with vehicle or nimodipine supplemented drinking water. Yellow lines outline hippocampal and cortical regions. Nimodipine treatment does not affect cortical area, hippocampal area or breathing rate during MRI in isoflurane-anesthetised AD mice in vivo. d Axioscan images of sagittal sections stained for Aβ (82E1) from AD mice treated for 1.5 months with vehicle or nimodipine. Aβ plaque load quantified in the cortex or hippocampus was not modulated by nimodipine treatment. e-g In vivo two photon-imaging in the barrel cortex of anesthesised AD mice 10-11 days after nimodipine or vehicle treatment (e) showed that nimodipine increases capillary (but not significantly arteriole/artery) diameters (f) and reduces capillary stalling in >3rd order capillaries (g). P values in panels a, c and g are from Mann-Whitney tests, in panel b from paired t-tests, in panel d from a one-way ANOVA and a KruskalWallis test for cortex and hippocampus, respectively, and in panel f from an unpaired t-test. P-values are 2-tailed. Error bars are s.e.m. Source data
Extended Data Fig. 9
Extended Data Fig. 9. FITC-dextran extravasation and plaque-associated fibrinogen deposition are increased in AD mice.
a Two-photon images (projections with all pixels summed) in barrel cortex at 0 min and 8 min corresponding to 2 min and 10 min after injection of 70 kDa FITC-dextran into the femoral vein of mature (upper panel) or old (lower panel) WT and AD mice in vivo. b-c FITC-dextran extravasation measured as the mean intensity increase in FITC-dextran signal in the extravascular space as a function of time from injection. FITC-dextran fluorescence was quantified from images as in (a) in the most superficial 40 μm of the cortex including the pia and part of layers I/II (b) and in the region from 40–126 μm deep in layers I-II (c). FITC-dextran extravasation is significantly increased in both mature and old AD mice at depths >40 μm, and is increased from pial and intraparenchymal vessels in the most superficial 40 μm of old but not mature AD mice. Points on bar chart are data from individual extravascular regions for which FITC-dextran was quantified. Mature mice were aged P120-180 (WT) and P125-156 (AD), and old mice were aged P208-361 (WT) and P211-364 (AD). d Fibrinogen and amyloid β (Aβ) plaque (82E1) staining in fixed cortical tissue sections of mature NG2-dsRed WT and AD mice that underwent cardiac perfusion with FITC-albumin in gelatin (see Methods). e Cortical fibrinogen deposits are elevated at plaques in cortex of AD mice. The fluorescence intensity of the fibrinogen channel was measured from multiple regions of interest in the extravascular space for each confocal stack and then averaged for each stack. Each point on bars is a different confocal stack. P values in panels b, c and e are from Kruskal-Wallis tests. P-values are 2-tailed. Error bars are s.e.m. Source data
Extended Data Fig. 10
Extended Data Fig. 10. Ageing reduces the nimodipine-evoked increase in CBF in AD, but not in WT mice.
a Time course of CBF in response to nimodipine in all mature and old WT and AD mice studied regardless of dsRed or NG2-CreERT2-GCaMP5g co-expression. Bar graph: Ageing reduces the nimodipine-evoked increase in CBF in AD, but not in WT mice (p = 0.1, Mann-Whitney test comparing mature to old WT mice, see also Fig. 1c, f). Mature mice were aged P110-P191 and old mice are aged P211-P364. b In WT mice, ageing increases nimodipine-evoked CBF rises. c In AD mice, nimodipine-evoked CBF rises decrease with age. d Axioscan images of fixed P145 and P290 AD sagittal sections labelled with DAPI and for Aβ using the 82E1 antibody. Nimodipine-evoked CBF rises negatively correlated with plaque load. e Left bar graph: nimodipine evokes a small dilation of arteries/arterioles but not veins/venules in old AD mice. Right bar graph: nimodipine increases 1st-3rd order capillary diameter but does not alter >3rd order capillary diameter at pericyte somata in old AD mice. f Pericyte loss during ageing in WT and AD mice. P values in panel a are from a Kruskal-Wallis test and in panel e from a paired t-test except for ‘>3rd order’, which is from a Wilcoxon test. P values in b, c, d and f assess whether regression lines have a slope significantly different from zero. P-values are 2-tailed. Error bars are s.e.m. Source data

References

    1. Mehta, D., Jackson, R., Paul, G., Shi, J. & Sabbagh, M. Why do trials for Alzheimer’s disease drugs keep failing? A discontinued drug perspective for 2010–2015. Expert Opin. Investig. Drugs26, 735–739 (2017). - PMC - PubMed
    1. McDade, E., Llibre-Guerra, J. J., Holtzman, D. M., Morris, J. C. & Bateman, R. J. The informed road map to prevention of Alzheimer disease: a call to arms. Mol. Neurodegener.16, 49 (2021). - PMC - PubMed
    1. Asllani, I. et al. Multivariate and univariate analysis of continuous arterial spin labeling perfusion MRI in Alzheimer’s disease. J. Cereb. Blood Flow Metab.28, 725–736 (2008). - PMC - PubMed
    1. Marshall, R. S. et al. Recovery of brain function during induced cerebral hypoperfusion. Brain124, 1208–1217 (2001). - PubMed
    1. Wang, X. et al. Cerebrovascular hypoperfusion induces spatial memory impairment, synaptic changes, and amyloid-β oligomerization in rats. J. Alzheimers Dis.21, 813–822 (2010). - PubMed