. 2024 Oct;56(10):2213-2227.
doi: 10.1038/s41588-024-01911-7. Epub 2024 Sep 18.

Pharmacological restriction of genomic binding sites redirects PU.1 pioneer transcription factor activity

Affiliations

Pharmacological restriction of genomic binding sites redirects PU.1 pioneer transcription factor activity

Samuel J Taylor et al. Nat Genet. 2024 Oct.

Abstract

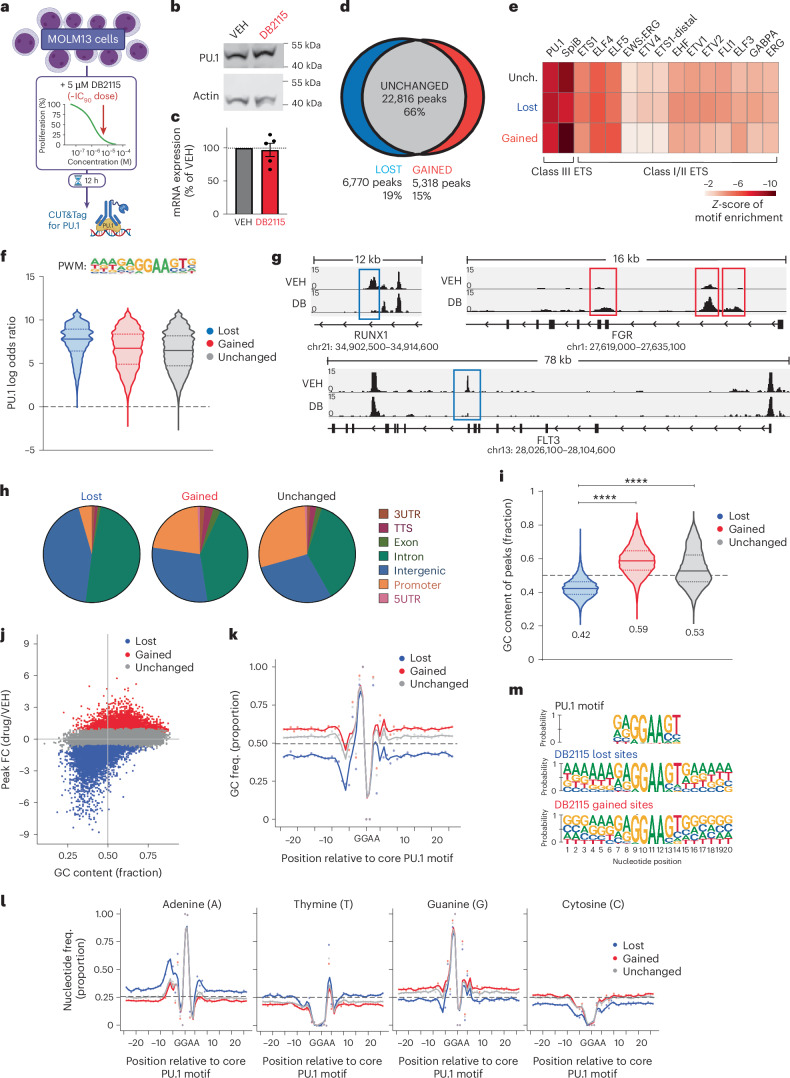
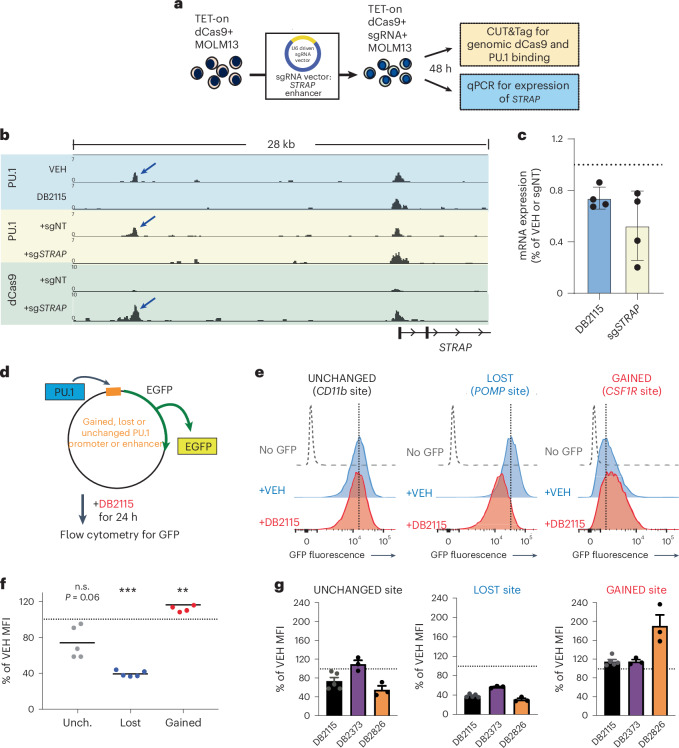
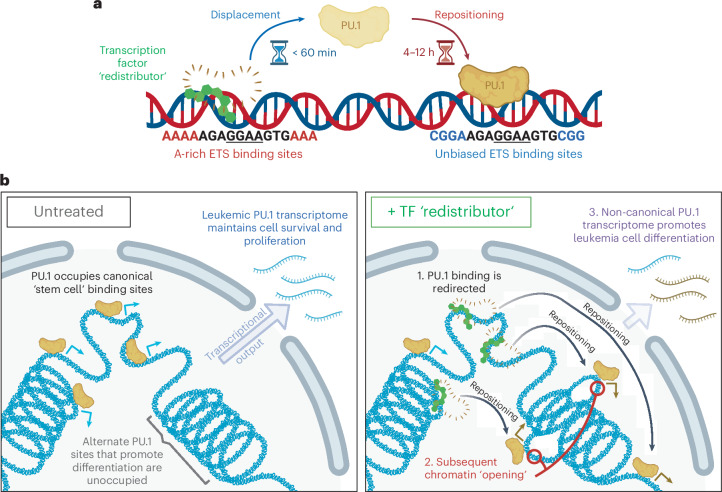
Transcription factor (TF) DNA-binding dynamics govern cell fate and identity. However, our ability to pharmacologically control TF localization is limited. Here we leverage chemically driven binding site restriction leading to robust and DNA-sequence-specific redistribution of PU.1, a pioneer TF pertinent to many hematopoietic malignancies. Through an innovative technique, 'CLICK-on-CUT&Tag', we characterize the hierarchy of de novo PU.1 motifs, predicting occupancy in the PU.1 cistrome under binding site restriction. Temporal and single-molecule studies of binding site restriction uncover the pioneering dynamics of native PU.1 and identify the paradoxical activation of an alternate target gene set driven by PU.1 localization to second-tier binding sites. These transcriptional changes were corroborated by genetic blockade and site-specific reporter assays. Binding site restriction and subsequent PU.1 network rewiring causes primary human leukemia cells to differentiate. In summary, pharmacologically induced TF redistribution can be harnessed to govern TF localization, actuate alternate gene networks and direct cell fate.


Conflict of interest statement

U.S. has received research funding from GlaxoSmithKline, Bayer Healthcare, Aileron Therapeutics and Novartis; has received compensation for consultancy services and for serving on scientific advisory boards from GlaxoSmithKline, Bayer Healthcare, Celgene, Aileron Therapeutics, Stelexis Therapeutics and Pieris Pharmaceuticals; and has equity ownership in and is serving on the board of directors of Stelexis Therapeutics. The other authors declare no competing interests.

Figures

Fig. 1
Fig. 1. PU.1 binding site blockade causes a GC content-biased repositioning of genomic PU.1 binding.
a, Schematic of the experimental approach to preparing MOLM13 cells for CUT&Tag following a 12 h 5 µM DB2115 treatment. b,c, Representative western blot displaying protein (b) and RNA expression of PU.1 following 12 h of 5 µM DB2115 treatment (mean ± s.e.m., n = 3 experimental replicates) (c). d, Proportions of lost, gained and unchanged PU.1 peaks following DB2115 treatment. Differential binding was calculated by Diffbind with an FDR < 0.1, n = 3. e, Z-score heatmap of ETS motif enrichments. Known ETS motifs were identified from Homer analysis of lost, gained and unchanged PU.1 peaks. f, Log odds ratio score for the PU.1 consensus sequence (from a previous publication) in lost, gained and unchanged PU.1 peaks. PWM, position weight matrix. g, Representative viewer tracks of genomic loci displaying lost (blue boxes), gained (red boxes) and unchanged (unmarked) PU.1 binding. h, Annotation in relation to distance to gene transcription start site of lost, gained and unchanged PU.1 peaks. UTR, untranslated region; TTS, transcription termination site. i, Proportion of GC content from the central 100 bp of lost, gained and unchanged PU.1 peaks. ****P < 0.0001, two-sided Mann–Whitney test. j, Comparison of log2fold change (FC) in PU.1 peak score (DB2115-treated/vehicle) versus GC content of central 100 bp of all peaks (colored according to peak groups). k, GC content position frequency matrix of lost, gained and unchanged peaks that have been centered on a short consensus ETS motif (GAGGAAGT) and examined ±25 bp. l, Single-nucleotide position frequency matrices for adenine, thymine, guanine and cytosine, comparing lost, gained and unchanged PU.1-centered peaks. m, Motif generation from PU.1-centered, lost (DB-sensitive) and gained (DB-resistant) peaks displaying a robust and extended upstream enrichment of A nucleotides in lost peaks. Also shown is the PU.1 motif used for centering peaks. VEH, vehicle. Source data
Fig. 2
Fig. 2. TF redistributors mediate selective, class-specific PU.1 repositioning in cell lines and primary AML samples.
a, Comparison of log2fold change of PU.1 peak score (12 h of 5 µM DB2115-treated/vehicle) versus GC content of the central 100 bp for all peaks for THP1, HL60 and MV411, showing the number and percentage of peaks redistributed in each cell line (n = 2 for each cell line). b, Similarity between MOLM13 PU.1 peak changes with the other three cell lines. Peaks were classed as either common change to MOLM13 in one, two or three other cell lines or not commonly changed to MOLM13. Lost peaks were first filtered to exclude peaks not detected in other cell lines. c, Scatter plots comparing log2fold change of PU.1 peak score (DB2115-treated/vehicle) versus GC content of the central 100 bp for all peaks from two AML primary patient samples, including the number and percentage of peaks that are lost and gained in each sample. d, Motif generation from PU.1-centered, pooled primary AML sample redistributed peaks displaying a robust and extended upstream enrichment of A nucleotides in lost peaks. Also shown is the PU.1 motif used for centering peaks. e,f, Representative genomic loci displaying lost (e; blue boxes), gained (f; red boxes) and unchanged (unmarked) PU.1 binding in primary AML samples. g, Percentage of lost and gained CUT&Tag peaks of the TFs PU.1, RUNX1, ELF1 and GABPA in MOLM13 cells treated for 12 h with 5 µM DB2115. The dashed line represents the percentage of PU.1 lost or gained peaks. h, The percentage of lost or gained TF peaks that overlap with redistributed PU.1. N/A, not applicable. i, Percentage of lost and gained CUT&Tag peaks of the TFs GATA3, RUNX1, ELF1 and FLI1 in JURKAT cells treated for 12 h with 5 µM DB2115. The dashed line represents the percentage of PU.1 lost or gained peaks found in MOLM13 cells. j,k, Scatter plots comparing log2fold change of PU.1 peaks (drug-treated/vehicle) versus GC content of the central 100 bp following 12 h of 5 µM DB2373, DB2313 and DB2826 (j), or 400 nM cytarabine (ARA-C) and 200 nM daunorubicin (DAUN.; k). Shown as an inset in each graph are the numbers and percentage of lost or gained PU.1 peaks, n = 1.
Fig. 3
Fig. 3. CLICK-on-CUT&Tag identifies sensitive, A-rich PU.1 sites as direct targets of drug binding.
a, Chemical structure of DB2750, an alkyne-linker-tagged version of DB2115. b, Representative immunofluorescence image of MOLM13 cells treated with vehicle or 5 µM DB2750, and CLICK-chemistry stained with azide-AF488 (green) and DAPI (gray). c, Dose–response curve of MOLM13 proliferation (cell titer blue assay) for DB2750 and DB2115; n = 3 experimental replicates displaying mean ± s.e.m. d, Scatter plots comparing log2fold change of PU.1 peaks (DB2115-treated/vehicle) with GC content of the central 100 bp following 12 h of DB2750. Shown as an inset in the graph are the number and percentage of lost or gained PU.1 peaks; n = 1. e, Schematic of CLICK-on-CUT&Tag and artificial fragment CLICK pulldown experimental procedures. NGS, next-generation sequencing. f, Enrichment of the two artificial DNA fragments (AT-rich and AT-poor; see Extended Data Fig. 2) following pulldown with DB2750-coated or non-drug-coated magnetic beads. Data are represented as a percentage of input cycle threshold score ± s.e.m.; n = 3 experimental replicates, *P < 0.05 (P = 0.0312) with two-sided Student’s t-test. g, Proportion of DB2750 binding sites out of all PU.1 binding sites (drug binding was determined to be log2fold change > log2(0.5)). h, Representative genome viewer tracks of vehicle or DB2115-treated PU.1 CUT&Tag (gray) as well as CLICK-on-CUT&Tag (purple), showing drug binding at specific PU.1 loci only. i, Summary enrichment scores of CLICK-on-CUT&Tag data, represented as the log2fold change of DB2750-pulldown/input. j, Highest ranked de novo motif found enriched in drug binding and non-drug-binding PU.1 sites. k,l, Scatter plot comparing CLICK-on-CUT&Tag enrichment score versus GC content of central 100 bp of each peak (k) or log2fold change of DB2115 over vehicle-treated PU.1 peak score (l). m, Color-coded scatter plot of CLICK-on-CUT&Tag enrichment score versus GC content displaying only lost (blue) and gained (red) peaks.
Fig. 4
Fig. 4. PU.1 repositioning restructures the accessible chromatin landscape and rewires the PU.1-driven transcriptome.
a, Schematic of the experimental approach to preparing MOLM13 cells for ATAC and RNA sequencing. b, Venn diagram of chromatin accessibility changes following DB2115 treatment (analyzed using Diffbind with an FDR < 0.1, n = 2). c, De novo motifs found in closing, opening or unchanged accessible chromatin regions (binomial exact test, Homer). d, GC content of the central 100 bp of closing, opening and unchanged accessible chromatin. e, Annotation of closing, opening or unchanged accessible chromatin. f, Summary pie charts of lost, gained and unchanged PU.1 peaks displaying their chromatin accessibility status following treatment. g, Representative viewer tracks of genomic loci displaying lost (blue box), gained (red boxes) or unchanged (unmarked) PU.1 binding regions with both PU.1 CUT&Tag (top) and ATAC data (bottom). h, Enriched de novo motifs from the following categories of peaks: lost PU.1 and closing, lost PU.1 and unchanged, gained PU.1 and opening and gained PU.1 and unchanged (Homer analysis with background of lost PU.1 and unchanged for lost PU.1 and closing peaks (and vice versa) or background of gained PU.1 and unchanged for gained PU.1 and opening peaks (and vice versa)). i, Differentially expressed genes (DEGs) identified following 20 h of DB2115 treatment (DESeq2, log2fold change >/< 0.5 and FDR < 0.1, n = 3). j,k, Gene set enrichment analysis (GSEA; MSigDB) of upstream TF pathways (j) and chemical and genetic perturbations (k). l, Volcano plots of gained, lost and unchanged PU.1 peak-associated gene expression. Accompanying pie charts illustrate the proportions of DEGs that are up-regulated and down-regulated. m,n, Volcano plots of the transcriptional changes of gained (m) and lost (n) PU.1 peak-associated genes filtered on opening or closing chromatin, and in promoter–intron–exon regions only. Accompanying pie charts illustrate the proportion of DEGs that are up-regulated and down-regulated. o, The promoter–intronic–exonic DB2115-target genes that were lost and closing (194) or gained and opening (506) were analyzed for cell identity from the human gene atlas (Enrichr). Average expression, P value (Fisher’s exact test) and odds ratio (OR) are shown. RPKM, reads per kilobase per million mapped reads. p, K-means clustering of binarized human cell ATAC peaks uncovered ten clusters associating with differing cell identities. q, Using this k-means cluster as a reference, the ‘identity’ of PU.1 CUT&Tag lost, gained and unchanged peaks was determined; only clusters showing enrichment were labeled.
Fig. 5
Fig. 5. Temporally resolved pioneering of chromatin accessibility and nascent transcription by redistributed endogenous PU.1.
MOLM13 cells were treated with 5 µM DB2115 for 1 h, 4 h or 12 h and CUT&Tag, ATAC–seq and PRO–seq were performed. a, Time of PU.1 peak changes and corresponding gains and losses at each time point. b, Time of chromatin accessibility changes and corresponding opening and closing at each time point. c, Known motif enrichment z-scores from closing and opening regions at 1 h, 4 h and 12 h (Homer analyses). d,e, Representative viewer tracks of genomic loci displaying both PU.1 CUT&Tag (top tracks) and ATAC–seq (bottom tracks) over the time course. Arrows indicate time of first detection of gain (d) or loss (e) of PU.1 or opening (d) and closing (e) chromatin. f,g, Heatmap depicting the time of chromatin opening for PU.1-gained sites (f) or depicting the time of chromatin closing for PU.1-lost sites over the time course (g). Sites were filtered to remove gained and lost PU.1 sites without changes in chromatin accessibility. h, Comparison of log2fold change of gene expression from PRO–seq data versus associated PU.1 peak log2fold change from PU.1 CUT&Tag conducted over the time course. The proportions of reduced DEGs out of all lost PU.1-associated DEGs (blue font) and increased DEGs out of gained PU.1-associated DEGs (red font) are shown in each dot plot. i,j, Representative IGV tracks of positive and negative sense PRO–seq data displaying loss (i) or gain (j) of transcription over the time course. k, Cumulative pie charts depicting time of gene up-regulation or down-regulation from PRO–seq data grouped by time (1 h, 4 h or 12 h) of associated PU.1 loss or gain. l, Representative smFISH images from MOLM13 cells for the lost and gained PU.1-associated genes MYC (upper panels), and FGR (lower panels) over the DB2115 time course. MYC and FGR transcripts are in white pseudo-color; DNA is in blue pseudo-color. m,n, Transcription site (TS) burst frequency per cell for MYC (m) and FGR (n) over the time course. o,p, Number of nascent mRNA molecules per cell of MYC (o) and FGR (p) over the time course. PU.1 CUT&Tag and ATAC sequencing peaks were created using Diffbind, n = 2 and FDR < 0.1. PRO–seq DEGs were called using the NRSA pipeline; n = 2 and Padj < 0.05.
Fig. 6
Fig. 6. Both genetic and pharmacological PU.1 redistribution activates gene expression at known and newly identified alternate PU.1 target sites.
a, Experimental schematic for generation and evaluation of dCas9 and sgRNA-expressing MOLM13 cells b, Representative viewer tracks of genomic loci displaying PU.1 CUT&Tag of vehicle or DB2115-treated cells (top two tracks), sgNT-expressing or sgSTRAP-expressing cells (middle two tracks) and dCas9 CUT&Tag of sgNT-expressing and sgSTRAP-expressing cells (bottom two tracks). Arrows highlight the PU.1 or dCas9 binding at the STRAP enhancer. sgNT, non-targeting control sgRNA. c, Relative mRNA expression of STRAP by qPCR for DB2115-treated cells (for 24 h, compared to vehicle) and sgSTRAP dCas9+ cells (48 h of doxycycline, compared to sgNT dCas9+); n = 4 experimental replicates displaying mean ± s.e.m. d, Experimental schematic for the design and evaluation of the native PU.1-driven eGFP reporter assay in MOLM13 cells. e,f, Representative eGFP fluorescence histograms (e) and summary mean fluorescence intensity (MFI) data for the three eGFP reporter-transduced MOLM13 cells (unchanged-CD11b site, lost-POMP site and gained-CSF1R PU.1 binding sites; see Extended Data Fig. 8b) following 24 h treatment with 5 µM DB2115 or vehicle (f); n = 4–5 experimental replicates, two-sided, paired Student’s t-tests, **P < 0.001 (P = 0.0096), ***P < 0.0005 (P = 0.0005). g, Mean change in eGFP MFI for the three reporter MOLM13 cell lines following 24 h treatment with 5 µM DB2115 (black), DB2373 (purple) or DB2836 (orange) compared to vehicle ± s.e.m., n = 3–5 experimental replicates.
Fig. 7
Fig. 7. Pharmacological TF redistribution induces myeloid lineage receptor responsiveness and promotes differentiation of leukemic cells.
a,b, Proportion of CSF1R+ (a) and IL-4R+ MOLM13 cells (b) after 24 h or 48 h of treatment with vehicle or 1 µM DB2115, and a representative histogram of staining intensity after 48 h; n = 7 experimental replicates displaying mean ± s.e.m. **P < 0.01 (P = 0.0057 (24 h IL-4) and P = 0.0096 (48 h IL-4)) and ****P < 0.0001. c, Schematic of approach to invoke surface receptor expression on MOLM13 cells and assess response to ligands (CSF1 and IL-4). d, Fold change of pS6 MFI versus baseline for CSF1 stimulations of drug-invoked MOLM13 cells, including representative histograms; n = 3 experimental replicates displaying mean ± s.e.m.; *P < 0.05 (P = 0.0234) and **P < 0.01 (P = 0.005). e, Fold change of pSTAT6 MFI versus baseline for IL-4 stimulations of drug-invoked MOLM13 cells, including representative histograms; n = 3 experimental replicates displaying mean ± s.e.m.; *P < 0.05 (P = 0.0164) and **P < 0.01 (P = 0.006 (3 ng ml−1) and P = 0.0025 (10 ng ml−1)). f, Representative day 7 colony assay images of drug-invoked or vehicle-invoked MOLM13 cells grown in methylcellulose containing no growth factors, +100 ng ml−1 CSF1 or +100 ng ml−1 IL-4. g, Summary D7 colony numbers from DB2115-pretreated or vehicle-pretreated MOLM13 cells in the absence or presence of ligands, n = 3–4 experimental replicates displaying mean ± s.e.m, *P < 0.05 (P = 0.0248). h, May-Grünwald Giemsa cytospin image of MOLM13 cells treated with vehicle or 1 µM DB2115 for 5 days. The experiment was repeated independently three times with similar results. i,j, Representative histograms (i) and fold change in MFI versus vehicle for cell surface markers from 5-day treated cells, n = 7 experimental replicates displaying mean ± s.e.m (j). k, Experimental schema illustrating the evaluation of primary AML samples following vehicle or DB2115 exposure in methylcellulose colony assays. l, Representative light microscope images of AML colonies (sample 6) after vehicle or 5 µM DB2115 treatment for 8 days. Example image is from one experiment with two technical replicates with similar results. m, Colony counts from samples from the seven patients with AML exposed to vehicle, 1 µM or 5 µM DB2115 for 8–13 days, n = 2 technical replicates per sample. n, Summary heatmap of the percentage change in CD marker expression in primary AML cells following 5 µM DB2115 compared to vehicle. All statistical tests displayed were unpaired, two-sided Student’s t-tests.
Fig. 8
Fig. 8. The molecular mechanism of action and cellular consequences of pharmacological PU.1 redistribution.
a, TF ‘redistributors’ (for example, DB2115, DB2313, DB2373 or DB2826) directly and rapidly displace PU.1 from canonical adenine-rich ETS binding sites and subsequently redistribute it to second-tier, sequence-unbiased ETS binding sites. b, Under steady-state conditions, canonical PU.1 binding and the ensuing PU.1-driven transcriptome is essential for leukemia cell survival; however, this is perturbed through the administration of TF redistributors. PU.1 is repositioned to alternate binding sites, redirecting its pioneer activity leading to subsequent chromatin opening and a rewiring of the PU.1-driven transcriptome, ultimately driving myeloid differentiation.
Extended Data Fig. 1
Extended Data Fig. 1. PU.1 redistribution in MOLM13.
(a) Correlation heatmap of the differentially bound PU.1 peaks from Diffbind analysis of MOLM13 VEH vs DB2115 treated samples. (b) PCA plot showing association between replicates of VEH vs DB2115 treated MOLM13 differential peaks from Diffbind analysis. (c) Randomization of the VEHvsDB2115 treatment pairs to determine Diffbind peak calling robustness. PCA plot of differential peaks from randomized treatment pairs and (d) numbers of significantly changed peaks, FDR < 0.1, are shown. (e) Representative viewer tracks of genomic loci displaying lost, gained and unchanged PU.1 binding from Fig. 1g, plus an additional track displaying minimal reads detected from IgG CUT&Tag.The FIMO tool (MEME suite, p-value cut-off of p < 0.0001) was used to identify (f) poly-A upstream and (g) poly-T upstream PU.1 motifs (AAAAAWRRGGAAGT and TTTTTWRRGGAAGT respectively) in the entire human (hg38) genome. Also shown is the overlap between these genomic sites and total PU.1 CUT&Tag sites.
Extended Data Fig. 2
Extended Data Fig. 2. Classical ChIP examination of PU.1 redistribution in MOLM13.
(a) Summary of the overlap of MACS2 called peaks between classical PU.1 ChIP (n = 1) and PU.1 CUT&Tag (n = 3). (b) The proportion of GC content in the central 100 bp of lost, gained and unchanged classical ChIP PU.1 peaks. (c) Comparison of log2fold change in classical ChIP PU.1 peak score (DB2115-treated/Vehicle) with GC content of central 100 bp of all peaks (colored according to peak groups). (d) The top de novo motif identified from homer analysis of each group of classical PU.1 peaks. (e) Representative viewer tracks of genomic loci displaying PU.1 CUT&Tag (top tracks) and classical PU.1 ChIP (bottom tracks). Highlighted are lost (blue boxes), gained (red boxes) and unchanged (unmarked) PU.1 binding instances.
Extended Data Fig. 3
Extended Data Fig. 3. Multi-cell line analysis of PU.1 redistribution.
(a-c) GC content of the central 100 bp of lost, gained and unchanged PU.1 peaks from the three cell lines THP1, HL60 and MV411 following 12 hr of 5 µM DB2115. (d & e) Representative viewer tracks of genomic loci displaying lost (blue boxes), gained (red boxes) and unchanged (unmarked) PU.1 binding for all four cell lines. (f) Log odds ratio score for the PU.1 consensus sequence (Pham et al., 2013) in the 8 categories of commonly lost/gained peaks identified from MOLM13,THP1,HL60 and MV411 cell lines. (g) GC content of the central 100 bp of PU.1 gained and lost peaks which were classified according to their degree of commonality across the 4 cell lines (MOLM only, common to 1, 2 or 3 other cell lines). One-way ANOVA with Tukey multiple comparisons was performed, *p < 0.05(p = 0.0445[MOLMonly vs +1 cell line]), ****p < 0.0001. (h) Central PU.1 motif identified in the 4 categories of commonly lost PU.1 peaks or (i) 4 categories of commonly gained peaks. (j) GC-content position frequency matrix of lost and gained pooled primary AML sample peaks, which have been centered on a short consensus ETS motif (GAGGAAGT) and examined ±25 bp. (k) Similarity between primary AML PU.1 peak changes and MOLM13 data. (l) Dose-response curve for MOLM13 viability (Cell titer blue assay) for the four diamidine compounds, DB2115, DB2373, DB2313 and DB2826, n = 3 experimental replicates per drug displaying mean ± SEM.
Extended Data Fig. 4
Extended Data Fig. 4. Other transcription factor redistribution after DB2115 treatment.
(a) Comparison of log2fold change of RUNX1, ELF1 and GABPA peak score (12 hr of 5 µM DB2115-treated/Vehicle) versus GC content of the central 100 bp in MOLM13 cells. n = 1, except for RUNX1 where n = 2 (b) Comparison of log2fold change of RUNX1, GATA3, ELF1 and GABPA peak score (12 hr of 5 µM DB2115-treated/Vehicle) versus GC content of the central 100 bp in the PU.1-null cell line, JURKAT. n = 1 and differential analyses was conducted via Goodpeaks script.
Extended Data Fig. 5
Extended Data Fig. 5. Characterization of linker-tagged DB2115 (known as DB2750).
(a) Correlation heatmap of the differentially bound PU.1 peaks from Diffbind analysis of MOLM13 VEH vs DB2115 vs DB2750 treated samples, showing grouping of DB2750 with DB2115 samples. (b) Overlap of all PU.1 peaks from DB2750 versus DB2115 CUT&Tag. (c) DB2750 PU.1 peaks grouped as gain, loss or unchanged and examined for the peak status in the DB2115 peak dataset. Representative viewer tracks of PU.1 CUT&Tag from vehicle and DB2115 treated MOLM13 cells showing the (d) AT-rich/SENP2 and (e) AT-poor/SPI1 upstream sequences used to synthesize artificial fragments used in experiments from Fig. 3e.
Extended Data Fig. 6
Extended Data Fig. 6. Additional transcriptomic and chromatin accessibility characterization following DB2115 exposure.
(a) Comparison of log2fold change in PU.1 peak score (DB2115-treated/Vehicle) with log2fold change of ATAC peak score (colored according to PU.1 CUT&Tag groups). (b) Comparison of log2fold change in PU.1 peak score (DB2115-treated/Vehicle) with log2fold change of RNA expression of associated genes (colored according to PU.1 peak groups). (c) A high confidence list of promoter/intronic/exonic DB2115-target genes being either lost/closing (194) or gained/opening (506) were analyzed for enrichment of pathways from GO biological processes using the molecular signature database. (d) K-means clustering of normalized and binarized raw count ATAC data from Corces et al., 2016; confirming correct groupings of cellular identity, used for Fig. 4p, q.
Extended Data Fig. 7
Extended Data Fig. 7. Additional PU.1 redistribution time course data.
(a) Proportion of GC content or (b) CLICK enrichment score of lost and gained PU.1 peaks (left & right panels respectively) for each timepoint of DB2115 treatment (1,4 and 12 hr). (c) Representative viewer tracks of genomic loci displaying both PU.1 CUT&Tag (top tracks) and ATAC sequencing (bottom tracks) over the time course. Arrows indicate time of first detection of gain/loss of PU.1, or opening/closing chromatin. (d) Occurrence of first detectable PU.1 gained sites over time (as a % of total gained sites, red) compared to the occurrence of detectable open chromatin at these same PU.1 gained sites over time (black). (e) Occurrence of first detectable PU.1 loss over time (as a % of total lost sites, blue) compared to the occurrence of detectable open chromatin at these same PU.1 lost sites over time (black). (f) The time at which DEGs (NRSA pipeline with a p-adj. cut-off <0.1) are first detected and the corresponding proportion of increases and decreases at 1, 4, and 12 hr. (g) Comparison of 20 hr RNA-seq. log2FC and 12 hr PRO-seq log2FC expression values from DB2115 treated MOLM13 cells. (h) Heatmaps depicting the time of chromatin opening versus the time of nascent transcript increase of PU.1 gained sites from 1, 4 or 12 hrs, (left panels) or depicting the time of chromatin closing versus the time of nascent transcript decrease for PU.1 lost sites from 1, 4, or 12 hrs. (i) Representative smFISH images from MOLM13 cells for the unchanged PU.1-associated gene, SPI1, over the DB2115 time course. SPI1 transcripts are in white pseudo-color, DNA is in blue pseudo-color. (j) Total nascent transcript counts for SPI1 mRNA per cell and (k) frequency of transcription burst sites per cell for SPI1 over the DB2115 time course.
Extended Data Fig. 8
Extended Data Fig. 8. dCAS9 and GFP reporter assay details.
(a) Representative viewer tracks of PU.1 CUT&Tag from vehicle and DB2115 treated MOLM13 cells showing the STRAP locus. Identified is the PU.1 binding site where the sgRNA was designed to enable dCas9 targeting (sequence is highlighted in red). (b) Representative viewer tracks of PU.1 CUT&Tag from vehicle and DB2115 treated MOLM13 cells showing the lost POMP, gained CSF1R (alternate promoter) and unchanged CD11b sites. Identified in green is the PU.1 peak and corresponding sequence which was used as the enhancer for eGFP expression in the lentiviral vector. (c) Raw baseline MFI value of the unchanged, lost and gained eGFP reporter cells without drug treatment, n = 5.
Extended Data Fig. 9
Extended Data Fig. 9. Additional data from drug-induced differentiated cell lines.
(a) Representative histograms and (b–e) average percentage positive for CD15, CD14, CD86 and CD11b in drug-invoked (or vehicle) MOLM13 cells following 7 days of culture in methylcellulose, n = 3 experimental replicate displaying mean ± SEM. (f) May-Grunwald Giemsa cytospin image of THP1 cells treated with vehicle or 1 µM DB2115 for 5 days. Experiment was repeated independently 3 times with similar results. (g) Representative histograms and (h) fold change in MFI vs vehicle for CD209, CD15, CD14, CD86, CD34 and CD11b in 5 day treated cells, n = 3 experimental replicates displaying mean ± SEM.
Extended Data Fig. 10
Extended Data Fig. 10. Raw flow cytometry data for primary AML samples.
(a) Representative gating schema for primary AML samples grown in methylcellulose with vehicle, 1 µM or 5 µM DB2115 for 8–13 days. (b) Histograms displaying expression of CD15, CD14, CD86 and CD11b in primary AML samples following treatment with DB2115 or vehicle after 8–13 days. (c) Summary heatmap displaying changes in expression of CD15, CD14, CD86 and CD11b after 8-13 days of 1 µM DB2115 vs vehicle.

References

    1. Lambert, S. A. et al. The human transcription factors. Cell172, 650–665 (2018). - PubMed
    1. Perry, J. A., Seong, B. K. A. & Stegmaier, K. Biology and therapy of dominant fusion oncoproteins involving transcription factor and chromatin regulators in sarcomas. Annu. Rev. Cancer Biol.3, 299–321 (2019).
    1. Henley, M. J. & Koehler, A. N. Advances in targeting ‘undruggable’ transcription factors with small molecules. Nat. Rev. Drug Discov.20, 669–688 (2021). - PubMed
    1. Hosokawa, H. et al. Transcription Factor PU.1 represses and activates gene expression in early T cells by redirecting partner transcription factor binding. Immunity48, 1119–1134.e7 (2018). - PMC - PubMed
    1. Zhang, P. et al. PU.1 inhibits GATA-1 function and erythroid differentiation by blocking GATA-1 DNA binding. Blood96, 2641–2648 (2000). - PubMed

MeSH terms