. 2024 Nov;25(11):5141-5168.
doi: 10.1038/s44319-024-00253-z. Epub 2024 Sep 18.

miRNA-mediated control of gephyrin synthesis drives sustained inhibitory synaptic plasticity

Affiliations

miRNA-mediated control of gephyrin synthesis drives sustained inhibitory synaptic plasticity

Theresa M Welle et al. EMBO Rep. 2024 Nov.

Abstract

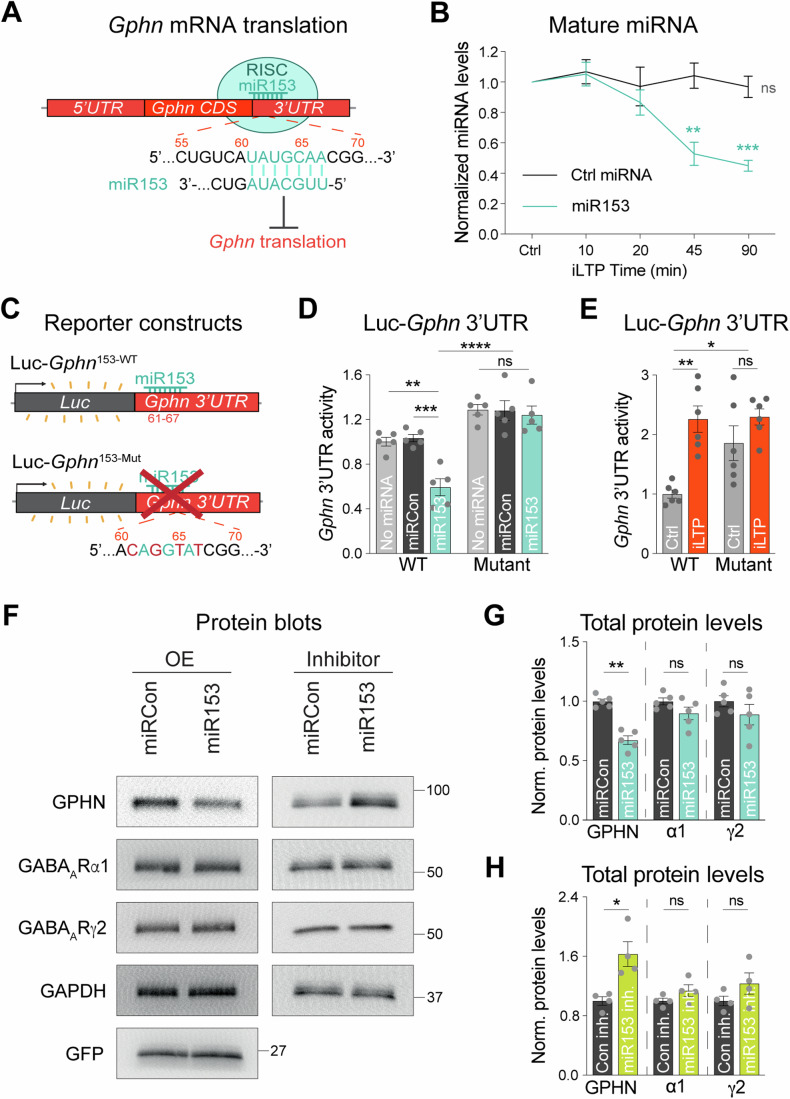
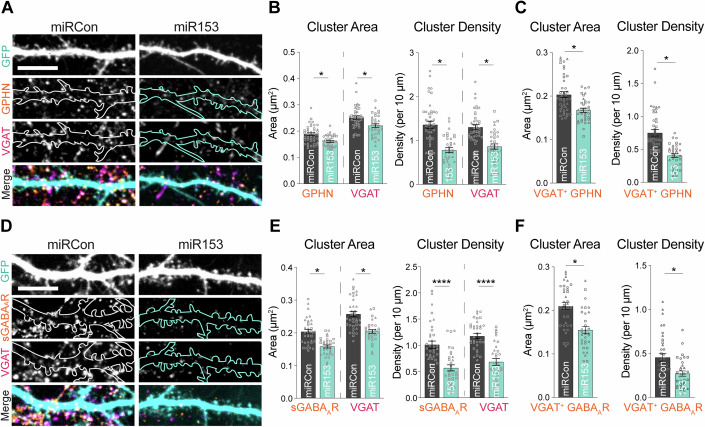
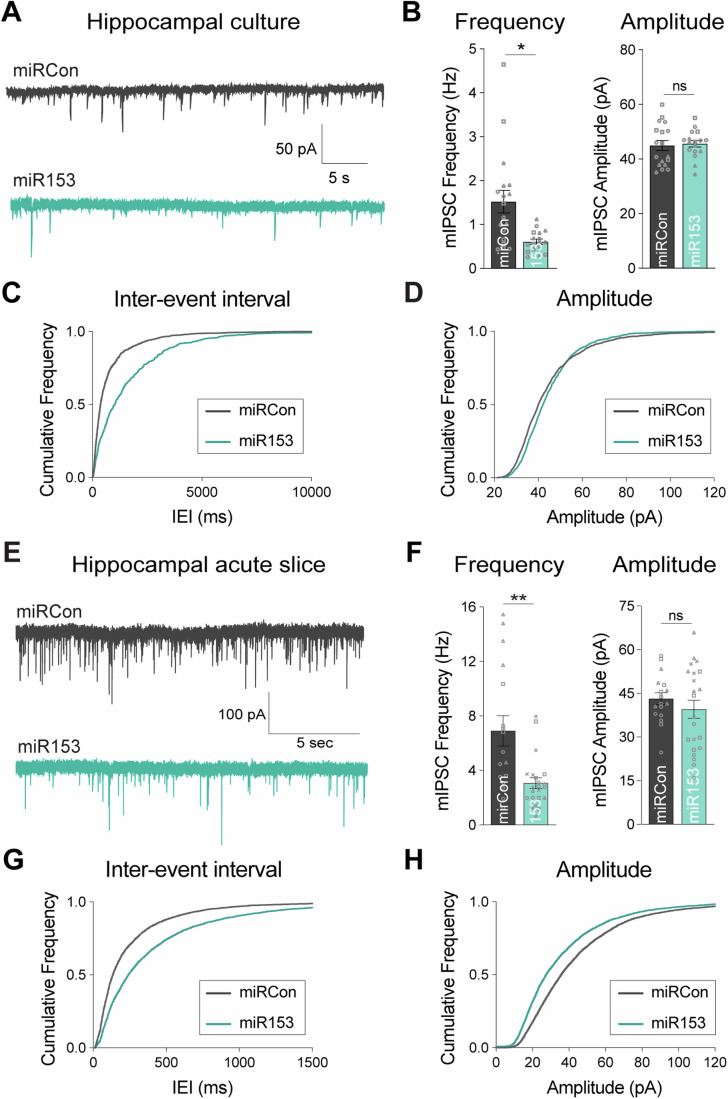
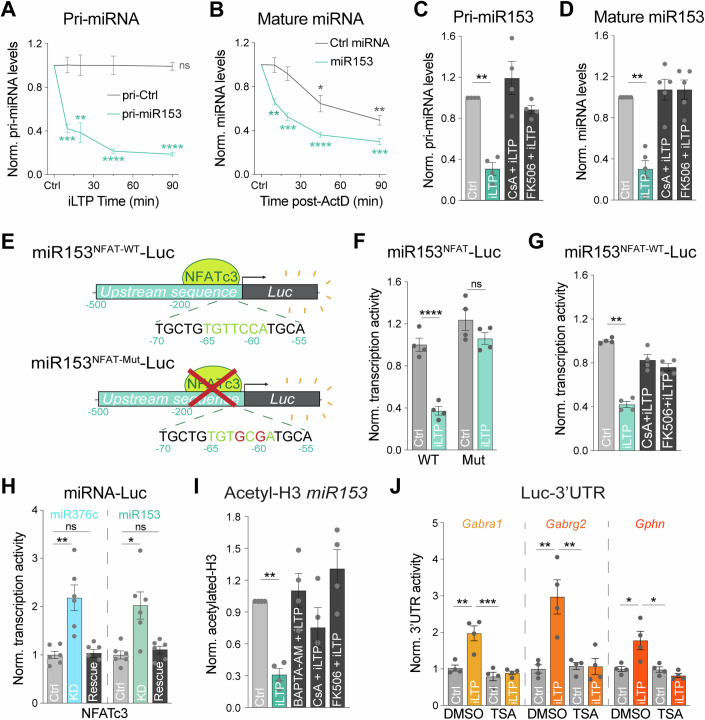
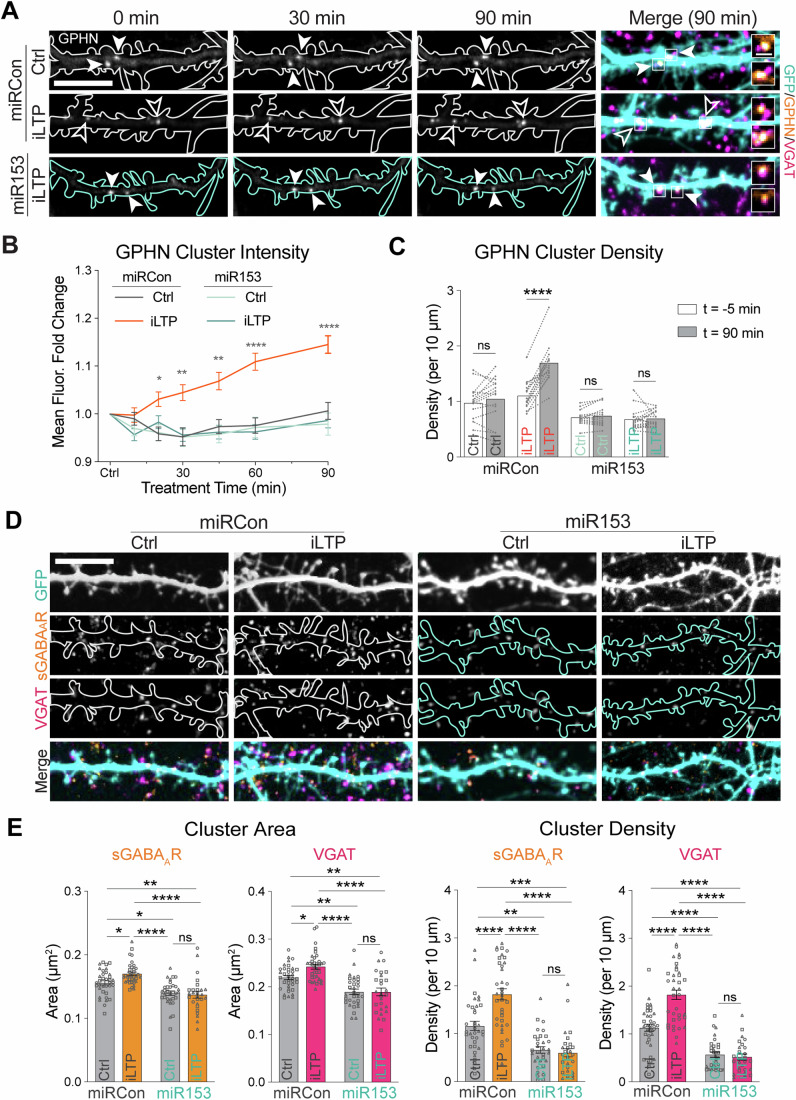
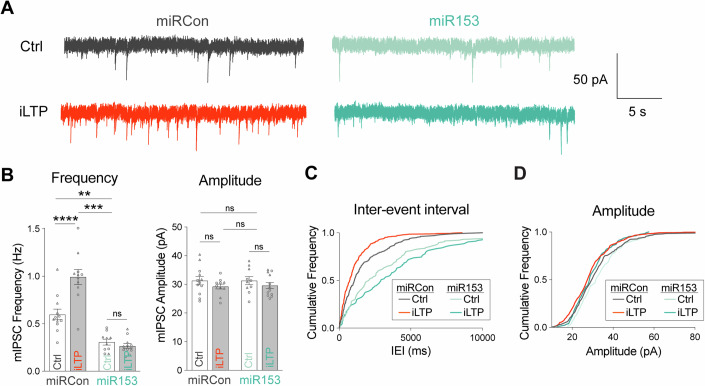
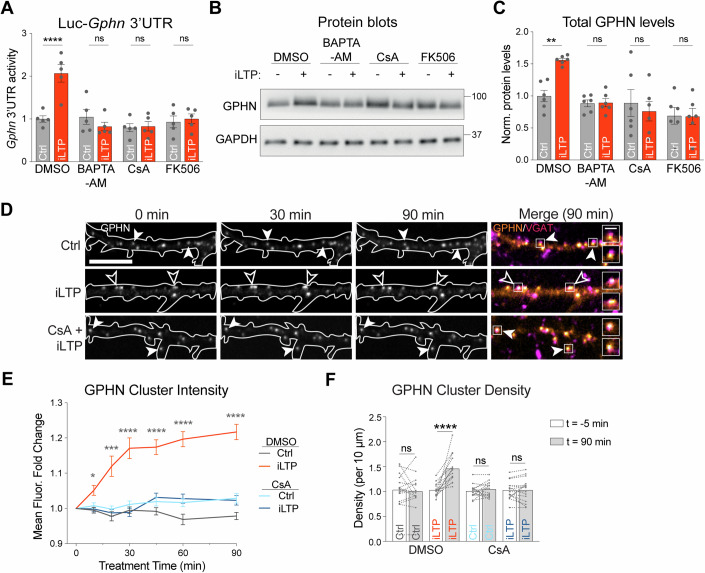
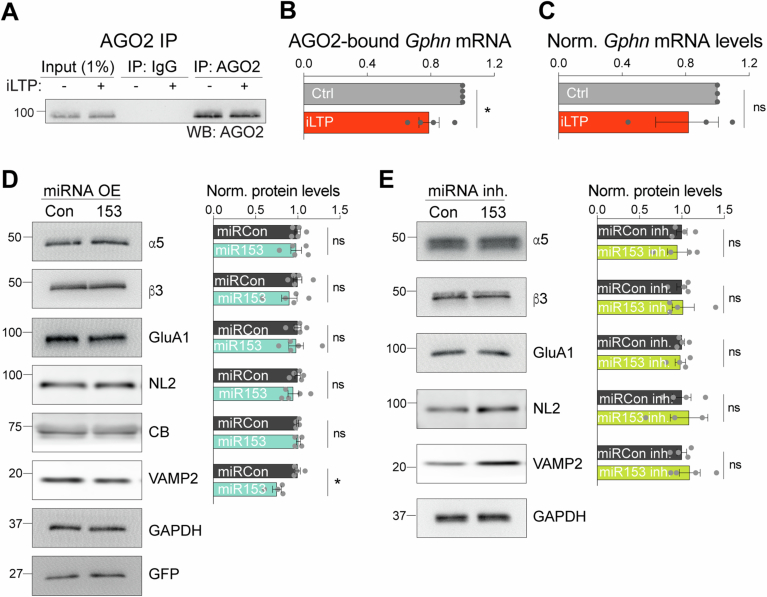
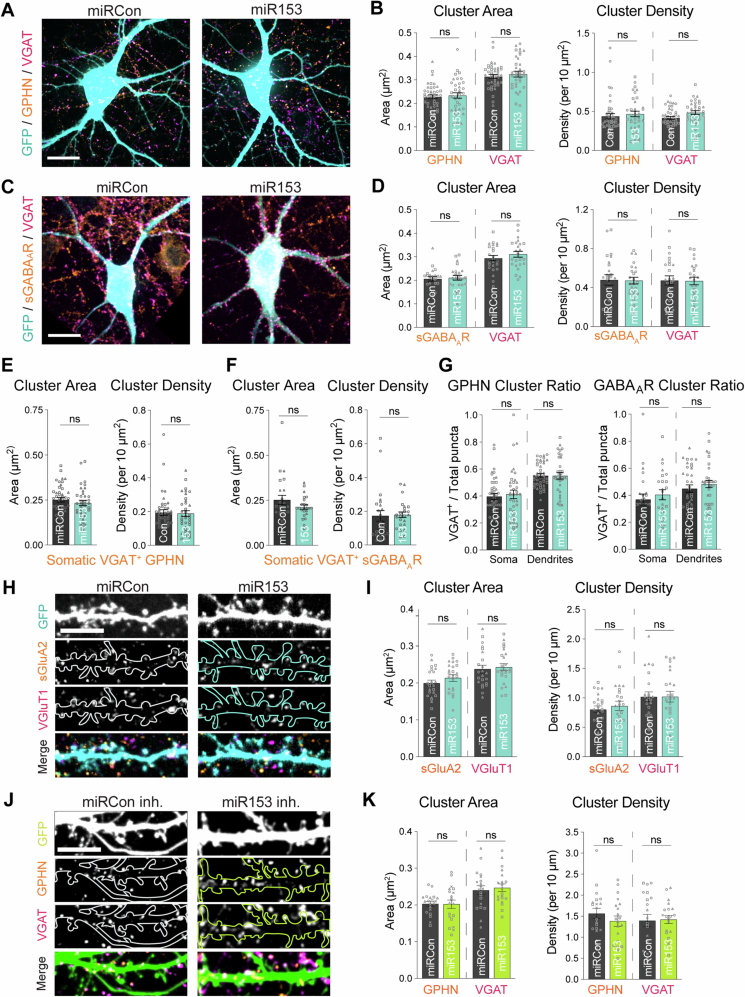
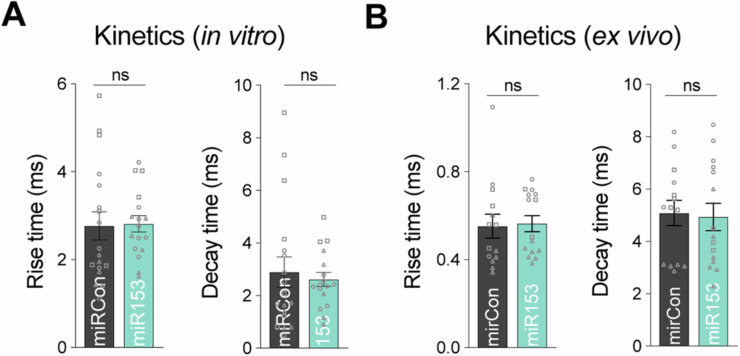
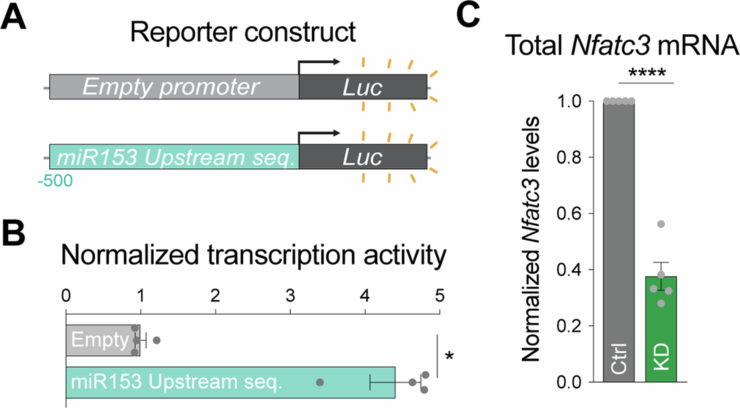
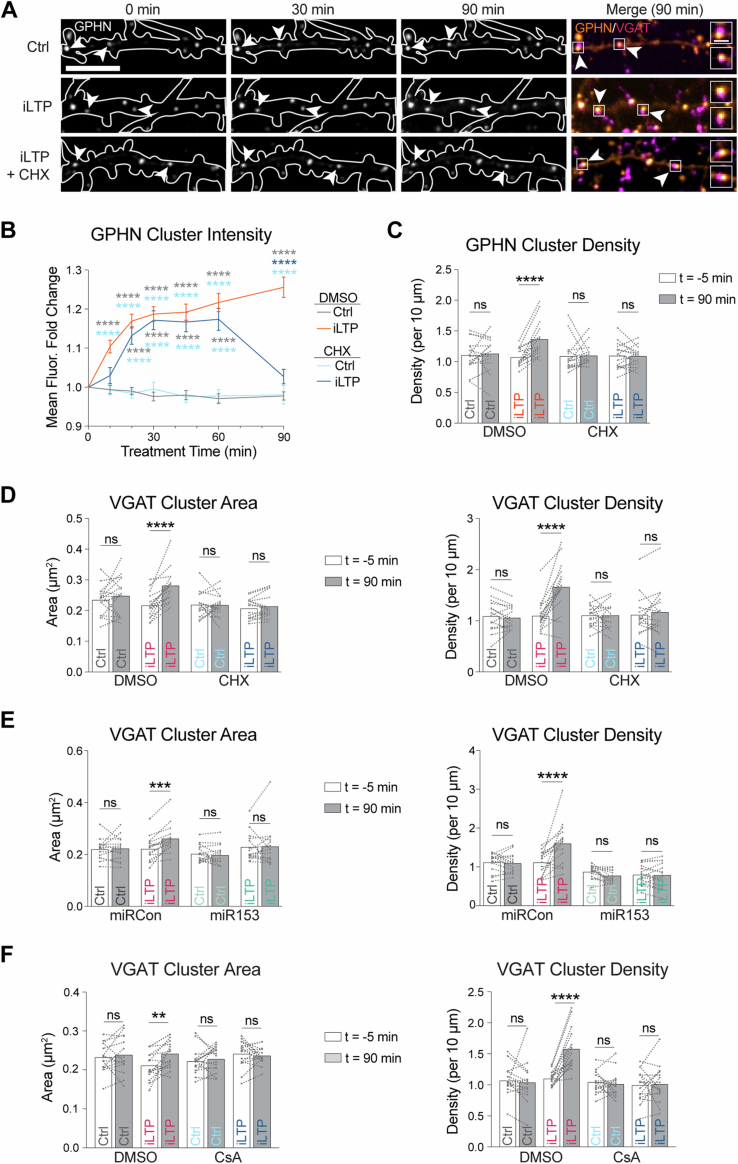
Activity-dependent protein synthesis is crucial for long-lasting forms of synaptic plasticity. However, our understanding of translational mechanisms controlling GABAergic synapses is limited. One distinct form of inhibitory long-term potentiation (iLTP) enhances postsynaptic clusters of GABAARs and the primary inhibitory scaffold, gephyrin, to promote sustained synaptic strengthening. While we previously found that persistent iLTP requires mRNA translation, the mechanisms controlling plasticity-induced gephyrin translation remain unknown. We identify miR153 as a novel regulator of Gphn mRNA translation which controls gephyrin protein levels and synaptic clustering, ultimately impacting inhibitory synaptic structure and function. iLTP induction downregulates miR153, reversing its translational suppression of Gphn mRNA and promoting de novo gephyrin protein synthesis and synaptic clustering during iLTP. Finally, we find that reduced miR153 expression during iLTP is driven by an excitation-transcription coupling pathway involving calcineurin, NFAT and HDACs, which also controls the miRNA-dependent upregulation of GABAARs. Together, we delineate a miRNA-dependent post-transcriptional mechanism that controls the expression of the key synaptic scaffold, gephyrin, and may converge with parallel miRNA pathways to coordinate gene upregulation to maintain inhibitory synaptic plasticity.

Keywords: GABAA Receptor; Gephyrin; Inhibitory Synapse; Translation; miRNA.


Conflict of interest statement

The authors declare no competing interests.

Figures

Figure 1
Figure 1. miR153 is downregulated during iLTP and controls endogenous gephyrin expression.
(A) Schematic of RNA-Induced Silencing Complex (RISC) and miR153 interaction with the seed site in Gphn 3’UTR, which is predicted to suppress translation of this mRNA. (B) qRT-PCR of miR153 and miR15a (Ctrl miRNA) expression in cultured hippocampal neurons harvested at different time-points following iLTP stimulation. miRNA levels were normalized to U6. N = 4. P-values (Ctrl vs iLTP t = 10/20/45/90 min): miR15a = 0.3113/0.8460/0.6049/0.3843, miR153 = 0.3811/0.8735/0.0040/<0.0001 (C) Schematic of the Luc-Gphn luciferase reporters. miR153 seed site is mutated in Luc-Gphn153-Mut. (D) Quantification of Luc-Gphn activities in HEK293T cells co-expressing control miRNA (miRCon), miR153, or no miRNA. Firefly was normalized to Renilla, and the data quantified as relative change in normalized Luc activity. N = 5. P-values: WT no miRNA vs miR153 = 0.0005, WT miRCon vs miR153 = 0.0002, Mut no miRNA vs miR153 = 0.8692, Mut miRCon vs miR153 = 0.9018, WT miR153 vs Mut miR153 < 0.0001. (E) Quantification of Luc-Gphn activities in hippocampal neurons under control conditions (Ctrl) or 90 min post-iLTP stimulation. N = 6. P-values: WT Ctrl vs iLTP = 0.0009, WT Ctrl vs Mut Ctrl = 0.0249, WT Ctrl vs Mut iLTP = 0.0007, Mut Ctrl vs Mut iLTP = 0.4386. (F) Western blots of gephyrin (GPHN), GABAAR subunits α1 and γ2, GAPDH, and GFP protein levels in neurons overexpressing miRCon or miR153 (left), and miRCon inhibitor or miR153 inhibitor (right). miRNA overexpression (OE) constructs contain a GFP reporter. (G) Quantification of GPHN, α1, and γ2 levels in miRCon or miR153 OE neurons. Protein levels were normalized to GAPDH, and the data quantified as relative change in normalized protein expression. N = 5. P-values (miRCon vs miR153): GPHN = 0.0079, α1 = 0.1508, γ2 = 0.3095. (H) Quantification of GPHN, α1, and γ2 in neurons expressing miRCon or miR153 inhibitors. N = 4. P-values (anti-Con vs anti-153): GPHN = 0.0286, α1 = 0.2000, γ2 = 0.2000. N = independent neuronal cultures/experiments. All values represent mean ± SEM. *p < 0.05, **p < 0.01, ***p < 0.005, ****p < 0.0001; one-sample t-test (B), two-way ANOVA with Tukey’s (D) or Šidák’s (E) multiple comparisons post-hoc test, and Mann–Whitney test (G, H).
Figure 2
Figure 2. miR153 overexpression disrupts gephyrin and GABAAR synaptic clustering.
(A) Representative dendritic segments of miRCon or miR153 OE-expressing neurons labeled with antibodies to gephyrin (GPHN) and VGAT. Scale bar, 10 μm. (B) Quantification of GPHN and VGAT cluster area (left) and cluster density (right) in neurons from (A). N = 3 / n = 35–42 neurons per condition. P-values (miRCon vs miR153): GPHN area = 0.0428, VGAT area = 0.0459, GPHN density = 0.0292, VGAT density = 0.0405. (C) Quantification of VGAT+ GPHN cluster area (left) and density (right) from total GPHN puncta quantified in (B). N = 3 / n = 35–42 neurons per condition. P-values (miRCon vs miR153): GPHN area = 0.0143, GPHN density = 0.0495. (D) Representative dendritic segments of miRCon or miR153 OE-expressing neurons labeled with antibodies to surface GABAAR subunit γ2 (sGABAAR) and VGAT. Scale bar, 10 μm. (E) Quantification of sGABAAR and VGAT cluster area (left) and cluster density (right) in neurons from (C). N = 3 / n = 32–35 neurons per condition. P-values (miRCon vs miR153): γ2 area = 0.0158, VGAT area = 0.0448, γ2 density <0.0001, VGAT density <0.0001. (F) Quantification of VGAT+ sGABAAR cluster area (left) and density (right) from total sGABAAR puncta quantified in (B). N = 3 / n = 32–35 neurons per condition. P-values (miRCon vs miR153): γ2 area = 0.0406, γ2 density = 0.0412. N = independent neuronal cultures/experiments, n = neurons. All values represent mean ± SEM. Neurons from different culture preparations are represented by different symbols of data points. *p < 0.05, **p < 0.01, ***p < 0.005, ****p < 0.0001; nested t-test.
Figure 3
Figure 3. miR153 overexpression impacts GABAergic synaptic transmission.
(A) Representative mIPSC current traces from miRCon and miR153 OE-expressing neurons in hippocampal culture. (B) Quantification of mIPSC frequency (left) and amplitude (right) from miRCon and miR153 OE-expressing neurons. N = 3 / n = 17–18 neurons per condition. P-values (miRCon vs miR153): frequency = 0.0366, amplitude = 0.7475. (C) Cumulative frequency distribution of mIPSC inter-event intervals (IEI) for events in miRCon and miR153 OE-expressing neurons. (D) Cumulative frequency distribution of mIPSC amplitude for events in miRCon and miR153 OE-expressing neurons. (E) Representative traces recorded from miRCon and miR153 OE-expressing neurons in acute hippocampal slices. (F) Quantification of mIPSC frequency (left) and amplitude (right) from miRCon and miR153 OE-expressing neurons. N = 3–4/n = 17–22 neurons per condition. P-values (miRCon vs miR153): frequency = 0.0041, amplitude = 0.3327. (G) Cumulative frequency distribution of mIPSC IEI for events in miRCon and miR153 OE-expressing neurons. (H) Cumulative frequency distribution of mIPSC amplitude for events in miRCon and miR153 OE-expressing neurons. N = independent neuronal cultures/experiments, n = neurons. All values represent mean ± SEM. Neurons from different neuronal preparations are represented by different symbols of data points. *p < 0.05, **p < 0.01, ***p < 0.005, ****p < 0.0001; nested (B) or Welch’s (F) t-test.
Figure 4
Figure 4. miR153 and miR376c transcriptional repression are controlled by a common CaN-NFAT signaling pathway during iLTP.
(A) qRT-PCR of primary miR153 transcript (pri-miR153) and pri-miR410 (pri-Ctrl) expression in neurons harvested at increasing time-points following iLTP stimulation. pri-miRNA levels were normalized to U6 and quantified as fold change from Ctrl condition. N = 4. P-values (Ctrl vs iLTP t = 10/20/45/90 min): pri-miR410 = 0.9570/0.9826/0.9874/0.8777, pri-miR153 = 0.0006/0.0063/<0.0001/<0.0001. (B) qRT-PCR of mature miR153 and miR410 (Ctrl miRNA) expression in neurons harvested at increasing time-points following treatment with actinomycin-D (ActD). miRNA levels normalized to U6 and quantified as fold change from Ctrl condition. N = 4. P-values (Ctrl vs ActD t = 10/20/45/90 min): miR410 = 0.9773/0.2783/0.0186/0.0014, miR153 = 0.0012/0.0009/<0.0001/<0.0001. (C) qRT-PCR of pri-miR153 expression in hippocampal neurons following control treatment (Ctrl) or 90 min post-iLTP stimulation in the presence or absence of CaN inhibitors cyclosporin A (CsA) and FK506. Quantified as fold change in pri-miR153 levels from Ctrl condition. N = 4. P-values (Ctrl vs iLTP): DMSO = 0.0015, CsA = 0.3163, FK506 = 0.0675. (D) qRT-PCR of mature miR153 expression in Ctrl and iLTP-90 neurons in the presence or absence of CsA and FK506. Quantified as miR153 fold change from Ctrl condition. N = 5. P-values (Ctrl vs iLTP): DMSO = 0.0012, CsA = 0.5027, FK506 = 0.4661. (E) Schematic of the miR153-Luc luciferase reporters. Predicted NFAT binding site is mutated in miR153NFAT-Mut-Luc. (F) Quantification of miR153-Luc activities in neurons under control conditions (Ctrl) or 90 min post-iLTP stimulation. Firefly was normalized to Renilla, and the data quantified as relative change in normalized Luc activity with error-corrected control values. N = 4. P-values (Ctrl vs iLTP): WT = 0.0001, Mut = 0.3094. (G) Quantification of miR153-Luc activities in Ctrl and iLTP-90 neurons in the presence or absence of CsA and FK506. Quantified as fold change in miR153-Luc activity from Ctrl condition. N = 4. P-values (Ctrl vs iLTP): DMSO = 0.0011, CsA = 0.4125, FK506 = 0.1128. (H) Quantification of miR376c-Luc and miR153-Luc activities in Ctrl, NFATc3 knockdown (KD) and NFATc3 KD + rescue (Rescue) neurons. N = 6. P-values: miR376c Ctrl vs KD = 0.0059, miR376c Ctrl vs Rescue >0.9999, miR153 Ctrl vs KD = 0.0116, miR153 Ctrl vs Rescue >0.9999. (I) qPCR readout of acetyl-histone H3 chromatin immunoprecipitation (ChIP) from neurons to show acetylation status of the miR153 promoter in Ctrl and iLTP-90 conditions in the presence or absence BAPTA-AM, CsA, and FK506. N = 4. P-values (Ctrl vs iLTP): DMSO = 0.0013, BAPTA-AM = 0.5615, CsA = 0.2802, FK506 = 0.1865. (J) Quantification of Luc-Gabra1, Luc-Gabrg2, and Luc-Gphn activities in Ctrl and iLTP-90 neurons in the presence or absence of HDAC inhibitor trichostatin-A (TSA). N = 4. P-values: Gabra1 DMSO Ctrl vs iLTP = 0.0010, Gabra1 DMSO iLTP vs TSA Ctrl = 0.0001, Gabra1 DMSO iLTP vs TSA iLTP = 0.0003; Gabrg2 DMSO Ctrl vs iLTP = 0.0011, Gabrg2 DMSO iLTP vs TSA Ctrl = 0.0016, Gabrg2 DMSO iLTP vs TSA iLTP = 0.0015; Gphn DMSO Ctrl vs iLTP = 0.0092, Gphn DMSO iLTP vs TSA Ctrl = 0.0081, Gphn DMSO iLTP vs TSA iLTP = 0.0019. N = independent neuronal cultures/experiments. All values represent mean ± SEM. *p < 0.05, **p < 0.01, ***p < 0.005, ****p < 0.0001; one-sample t-test (AD, I), two-way ANOVA with Šidák’s (F) or Tukey’s (J) multiple comparisons post-hoc test, and Kruskal–Wallis with Dunn’s multiple comparisons post-hoc test (G, H).
Figure 5
Figure 5. miR153 overexpression prevents increased GABAergic synaptic clustering during iLTP.
(A) Representative dendritic segments of miRCon or miR153 OE-expressing neurons over time in control and iLTP conditions. Neurons co-expressed the gephyrin intrabody (GPHN IB, arrowheads) and labeled live with VGAT Oyster650. Puncta are labeled with filled arrowheads when the fluorescence is unchanged and open arrowheads when fluorescence increases over time. Boxes indicate the fluorescent puncta enlarged in the merged images (dendrite scale bar, 10 μm; synapse scale bar, 2 μm). (B) Quantification of fold change in GPHN puncta fluorescence intensity over time following treatment in neurons from (A). N = 3 / n = 15 neurons per condition. P-values (miRCon Ctrl vs iLTP): 10 min > 0.9999, 20 min = 0.0125, 30 min = 0.0049, 45 min = 0.0012, 60 min < 0.0001, 90 min < 0.0001. (C) Paired measurements of GPHN cluster density in dendrites prior to (−5 min) and 90 min following treatment. N = 3 / n = 15 neurons per condition. P-values (t = −5 min vs t = 90 min): GPHN density miRCon Ctrl = 0.9137, GPHN density miRCon iLTP < 0.0001, GPHN density miR153 Ctrl = 0.9965, GPHN density miR153 iLTP = 0.9999. (D) Representative dendritic segments of miRCon or miR153 OE-expressing neurons labeled with antibodies to surface GABAAR γ2 subunit (sGABAAR) and VGAT following control treatment or 90 min post-iLTP stimulation. Scale bar, 10 μm. (E) Quantification of sGABAAR and VGAT cluster area (left) and density (right) in neurons from (D). N = 3/n = 27–36 neurons per condition. P-values: γ2 area miRCon Ctrl vs iLTP = 0.0270, γ2 area miRCon Ctrl vs miR153 Ctrl = 0.0110, γ2 area miRCon Ctrl vs miR153 iLTP = 0.0040, γ2 area miRCon iLTP vs miR153 Ctrl < 0.0001, γ2 area miRCon iLTP vs miR153 iLTP < 0.0001, γ2 area miR153 Ctrl vs iLTP = 0.9985; VGAT area miRCon Ctrl vs iLTP = 0.0179, VGAT area miRCon Ctrl vs miR153 Ctrl = 0.0016, VGAT area miRCon Ctrl vs miR153 iLTP = 0.0024, VGAT area miRCon iLTP vs miR153 Ctrl < 0.0001, VGAT area miRCon iLTP vs miR153 iLTP < 0.0001, VGAT area miR153 Ctrl vs iLTP > 0.9999; γ2 density miRCon Ctrl vs iLTP < 0.0001, γ2 density miRCon Ctrl vs miR153 Ctrl = 0.0016, γ2 density miRCon Ctrl vs miR153 iLTP = 0.0006, γ2 density miRCon iLTP vs miR153 Ctrl < 0.0001, γ2 density miRCon iLTP vs miR153 iLTP < 0.0001, γ2 density miR153 Ctrl vs iLTP = 0.9989; VGAT density miRCon Ctrl vs iLTP < 0.0001, VGAT density miRCon Ctrl vs miR153 Ctrl < 0.0001, VGAT density miRCon Ctrl vs miR153 iLTP < 0.0001, VGAT density miRCon iLTP vs miR153 Ctrl < 0.0001, VGAT density miRCon iLTP vs miR153 iLTP < 0.0001, VGAT density miR153 Ctrl vs iLTP = 0.9986. N = independent neuronal cultures/experiments, n = neurons. All values represent mean ± SEM. *p < 0.05, **p < 0.01, ***p < 0.005, ****p < 0.0001; mixed-effects model with Geisser-Greenhouse correction (B) and Šidák’s multiple comparisons post-hoc test (B, C) and ordinary two-way ANOVA with Tukey’s multiple comparisons post-hoc test (E).
Figure 6
Figure 6. miR153 overexpression prevents inhibitory synaptic potentiation following iLTP stimulation.
(A) Representative mIPSC current traces from miRCon and miR153 OE cultured neurons in Ctrl or iLTP conditions. (B) Quantification of mIPSC frequency (left) and amplitude (right) from miRCon and miR153 OE-expressing neurons. N = 2 / n = 10–12 neurons per condition. P-values: frequency miRCon Ctrl vs iLTP < 0.0001, miRCon Ctrl vs miR153 Ctrl = 0.0016, miRCon Ctrl vs miR153 iLTP = 0.0001, miR153 Ctrl vs iLTP = 0.9703; amplitude miRCon Ctrl vs iLTP = 0.6500, miRCon Ctrl vs miR153 Ctrl > 0.9999, miRCon Ctrl vs miR153 iLTP = 0.7670, miR153 Ctrl vs iLTP = 0.7880. (C) Cumulative frequency distribution of mIPSC inter-event intervals (IEI) for events in miRCon and miR153 OE neurons in Ctrl or iLTP conditions. (D) Cumulative frequency distribution of mIPSC amplitude for events in miRCon and miR153 OE neurons in Ctrl or iLTP conditions. N = independent neuronal cultures/experiments, n = neurons. All values represent mean ± SEM. Neurons from different culture preparations are represented by different symbols of data points. *p < 0.05, **p < 0.01, ***p < 0.005, ****p < 0.0001; two-way ANOVA with Šidák’s multiple comparisons post-hoc test (B).
Figure 7
Figure 7. Calcium and calcineurin signaling are required for increased gephyrin translation and synaptic clustering during iLTP.
(A) Graph of Luc-Gphn activities in Ctrl or iLTP-90 neurons in the presence or absence of BAPTA, CsA, and FK506. Firefly was normalized to Renilla, and the data quantified as relative change in normalized Luc activity. N = 5. P-values (Ctrl vs iLTP): DMSO = 0.0061, BAPTA-AM > 0.9999, CsA = 0.9428, FK506 > 0.9999. (B) Western blots of GPHN and GAPDH protein levels in Ctrl and iLTP-90 neurons in the presence or absence of BAPTA, CsA, and FK506. (C) Quantification of GPHN from blots in (B). Protein levels were normalized to GAPDH, and the data quantified as relative change in normalized protein expression. N = 6. P-values (Ctrl vs iLTP): DMSO = 0.0074, BAPTA-AM > 0.9999, CsA = 0.9087, FK506 > 0.9999. (D) Representative dendritic segments of neurons expressing GPHN IB and labeled with an antibody to VGAT, imaged over time in control and iLTP conditions in the presence or absence of CsA. Puncta are labeled with filled arrowheads when the fluorescence is unchanged and open arrowheads when fluorescence increases over time. Boxes indicate the fluorescent puncta enlarged in the merged images (dendrite scale bar, 10 μm; synapse scale bar, 2 μm). (E) Quantification of fold change in GPHN puncta fluorescence intensity in neurons over time following treatment, as shown in (D). N = 3 / n = 15 neurons per condition. P-values (DMSO Ctrl vs iLTP): 10 min = 0.0158, 20 min = 0.0003, 30 min < 0.0001, 45 min < 0.0001, 60 min < 0.0001, 90 min < 0.0001. (F) Paired measurements of GPHN cluster density in dendrites prior to (−5 min) and 90 min following treatment. N = 3 / n = 15 neurons per condition. P-values (t = −5 min vs t = 90 min): GPHN density DMSO Ctrl = 0.9740, GPHN density DMSO iLTP < 0.0001, GPHN density CHX Ctrl = 0.9558, GPHN density CHX iLTP > 0.9999. N = independent neuronal cultures/experiments, n = neurons. All values represent mean ± SEM. *p < 0.05, **p < 0.01, ***p < 0.005, ****p < 0.0001; two-way ANOVA (A, C) or mixed-effects model with Geisser-Greenhouse correction (E) and Šidák’s multiple comparisons post-hoc test (A, C, E, F).
Figure EV1
Figure EV1. Control experiments for AGO2 IPs and impact of miR153 on other synaptic proteins.
(A) Western blot (WB) of AGO2 immunoprecipitated from neurons following control treatment (Ctrl) or 90 min post-iLTP stimulation (iLTP). (B) qRT-PCR of Gphn mRNA bound to AGO2 in neurons from (A). AGO2-bound Gphn was normalized to total Gphn mRNA expression, and fold change from Ctrl was quantified for each condition. N = 4. P = 0.0452. (C) qRT-PCR of total Gphn mRNA levels in Ctrl and iLTP-90 neurons. Gphn mRNA levels were normalized to U6 expression, and fold change from Ctrl was quantified for each condition. N = 3. P = 0.7500. (D) Left: western blots of GABAAR subunits α5 (extrasynaptic) and β3 (synaptic), AMPAR subunit GluA1, GPHN binding proteins neuroligin-2 (NL2) and collybistin (CB), miR153 target VAMP2, GAPDH, and GFP protein levels in neurons overexpressing miRCon or miR153miRNA overexpression (OE) constructs contain a GFP reporter. Right: quantification of α5, β3, GluA1, NL2, CB, VAMP2 in miRCon or miR153 OE neurons. Protein levels were normalized to GAPDH, and the data quantified as relative change in normalized protein expression. N = 5. P-values (miRCon vs miR153): α5 > 0.9999, β3 = 0.5476, GluA1 = 0.5476, NL2 = 0.4206, CB > 0.9999, VAMP2 = 0.0286. (E) Left: western blots of α5, β3, GluA1, NL2, VAMP2, and GAPDH protein levels in neurons expressing miRCon or miR153 inhibitors. Right: quantification of α5, β3, GluA1, NL2, CB, VAMP2 in miRCon neurons or neurons in which miR153 was inhibited. Protein levels were normalized to GAPDH, and the data quantified as relative change in normalized protein expression. N = 4. P-values (anti-Con vs anti-153): α5 = 0.8857, β3 = 0.8857, GluA1 = 0.8857, NL2 = 0.8857, CB > 0.9999, VAMP2 = 0.6857. N = independent neuronal cultures/experiments. All values represent mean ± SEM. *p < 0.05, **p < 0.01, ***p < 0.005, ****p < 0.0001; one-sample t-test (B), Wilcoxon signed rank test (C), and Mann–Whitney test (D, E).
Figure EV2
Figure EV2. Control experiments for impact of miR153 manipulations on inhibitory somatic synapses and glutamatergic synapses.
(A) Representative somata of miRCon or miR153 OE-expressing neurons labeled with antibodies to GPHN and VGAT. Scale bar, 80 μm. (B) Quantification of GPHN and VGAT cluster area (left) and cluster density (right) in neurons from (A). N = 3 / n = 37–43 neurons per condition. P-values (miRCon vs miR153): GPHN area = 0.7738, VGAT area = 0.6588, GPHN density = 0.7784, VGAT density = 0.3919. (C) Representative somata of miRCon or miR153 OE-expressing neurons labeled with antibodies to surface GABAAR γ2 subunit (sGABAAR) and VGAT. Scale bar, 80 μm. (D) Quantification of sGABAAR and VGAT cluster area (left) and cluster density (right) in neurons as shown in (C). N = 3 / n = 32–35 neurons in each condition. P-values (miRCon vs miR153): γ2 area = 0.7593, VGAT area = 0.4208, γ2 density = 0.9159, VGAT density = 0.9221. (E) Quantification of VGAT+ GPHN cluster area (left) and density (right) from total GPHN puncta quantified in (B). N = 3 / n = 37–43 neurons per condition. P-values (miRCon vs miR153): GPHN area = 0.3569, GPHN density = 0. 8065. (F) Quantification of VGAT+ sGABAAR cluster area (left) and density (right) from total sGABAAR puncta quantified in (D). N = 3 / n = 32-35 neurons per condition. P-values (miRCon vs miR153): γ2 area = 0.3028, γ2 density = 0.8555. (G) Proportion of VGAT+ GPHN clusters (left) and VGAT+ sGABAAR clusters (right) in soma and dendrites. N = 3 / n = 32–42 neurons. P-values (miRCon vs miR153): somatic GPHN = 0.7279, dendritic GPHN = 0.9519, somatic γ2 = 0.5695, dendritic γ2 = 0.3768 (H) Representative dendritic segments of miRCon or miR153 OE neurons labeled with antibodies to surface AMPAR subunit GluA2 (sGluA2) and VGluT1. Scale bar, 10 μm. (I) Quantification of surface GluA2 and VGluT1 cluster area (left) and cluster density (right) in neurons from (H). N = 3 / n = 23–24 neurons per condition. P-values (miRCon vs miR153): sGluA2 area = 0.2599, VGluT1 area = 0.7703, sGluA2 density = 0.5529, vGluT1 density = 0.9867. (J) Representative dendritic segments of miRCon or miR153 inhibitor-expressing neurons labeled with antibodies to gephyrin (GPHN) and VGAT. Scale bar, 10 μm. (K) Quantification of GPHN and VGAT cluster area (left) and cluster density (right) in neurons from (A). N = 4 / n = 20 neurons per condition. P-values (anti-Con vs anti-153): GPHN area = 0.9630, VGAT area = 0.7950, GPHN density = 0.5259, VGAT density = 0.9461. N = independent neuronal cultures/experiments, n = neurons. All values represent mean ± SEM. Neurons from different culture preparations are represented by different symbols of data points. *p < 0.05, **p < 0.01, ***p < 0.005, ****p < 0.0001; nested t-test.
Figure EV3
Figure EV3. Measurement of mIPSC kinetics.
(A) Quantification of mIPSC rise time (left) and decay time (right) from miRCon and miR153 OE-expressing neurons in culture. N = 3 / n = 17–18 neurons per condition. P-values (miRCon vs miR153): rise time = 0.7836, decay time = 0.9860 (B) Quantification of mIPSC rise time (left) and decay time (right) from miRCon and miR153 OE-expressing neurons in slice. N = 3–4 / n = 17–22 neurons per condition. P-values (miRCon vs miR153): rise time = 0.6531, decay time = 0.8593. N = independent neuronal cultures/experiments, n = neurons. All values represent mean ± SEM. Neurons from different neuronal preparations are represented by different symbols of data points. *p < 0.05, **p < 0.01, ***p < 0.005, ****p < 0.0001; nested t-test (A) and Mann–Whitney test (B).
Figure EV4
Figure EV4. Control experiments for Luc reporter construct and NFATc3 knockdown construct.
(A) Schematic of the Empty-Luc (no promoter) and miR153-500-Luc luciferase reporters, designed to test transcriptional activity of the sequence 500 bp upstream of miR153. (B) Quantification of Luc activities in neurons expressing reporters containing no promoter (Empty) or the sequence upstream of pri-miR153 coding region (miR153 Upstream seq.). Firefly was normalized to Renilla, and the data quantified as relative change in normalized Luc activity with error-corrected control values. N = 4. P = 0.0286. (C) qRT-PCR of total Nfatc3 mRNA levels in Ctrl and NFATc3 knockdown (NFAT KD) neurons. Nfatc3 mRNA levels normalized to Gapdh mRNA expression, and fold change from Ctrl was quantified for each condition. N = 6. P = 0.0002. N = independent neuronal cultures/experiments. All values represent mean ± SEM. *p < 0.05, **p < 0.01, ***p < 0.005, ****p < 0.0001; Mann–Whitney test (B) and one-sample t-test (C).
Figure EV5
Figure EV5. Control experiments for inhibitory synapse live imaging.
(A) Representative dendritic segments of neurons expressing GPHN IB and labeled with an antibody to VGAT, imaged over time in control and iLTP conditions in the presence or absence of translational inhibitor cycloheximide (CHX). Puncta are labeled with filled arrowheads when the fluorescence is unchanged and open arrowheads when fluorescence increases over time. Boxes indicate the fluorescent puncta enlarged in the merged images (dendrite scale bar, 10 μm; synapse scale bar, 2 μm). (B) Quantification of fold change in GPHN puncta fluorescence intensity over time following treatment in neurons from (A)). N = 3 / n = 15 neurons per condition. P-values: 10 min DMSO iLTP vs DMSO Ctrl/CHX Ctrl <0.0001; 20 min DMSO iLTP vs DMSO Ctrl/CHX Ctrl <0.0001, CHX iLTP vs DMSO Ctrl/CHX Ctrl <0.0001; 30 min DMSO iLTP vs DMSO Ctrl/CHX Ctrl <0.0001, CHX iLTP vs DMSO Ctrl/CHX Ctrl <0.0001; 45 min DMSO iLTP vs DMSO Ctrl/CHX Ctrl <0.0001, CHX iLTP vs DMSO Ctrl/CHX Ctrl <0.0001; 60 min DMSO iLTP vs DMSO Ctrl/CHX Ctrl <0.0001, CHX iLTP vs DMSO Ctrl/CHX Ctrl <0.0001; 90 min DMSO iLTP vs DMSO Ctrl/CHX Ctrl/CHX iLTP <0.0001. (C) Paired measurements of GPHN cluster density in dendrites prior to (−5 min) and 90 min following treatment. N = 3 / n = 15 neurons per condition. P-values (t = −5 min vs t = 90 min): GPHN density DMSO Ctrl = 0.9874, GPHN density DMSO iLTP <0.0001, GPHN density CHX Ctrl = 0.9996, GPHN density CHX iLTP >0.9999. (D) Paired measurements of VGAT cluster area (left) and density (right) in dendrites prior to (−5 min) and 90 min following treatment. N = 3/n = 15 neurons per condition. P-values (t = −5 min vs t = 90 min): VGAT area DMSO Ctrl = 0.6649, VGAT area DMSO iLTP <0.0001, VGAT area CHX Ctrl = 0.9999, VGAT area CHX iLTP = 0.9557; VGAT density DMSO Ctrl = 0.9893, VGAT density DMSO iLTP <0.0001, VGAT density CHX Ctrl >0.9999, VGAT density CHX iLTP = 0.9256. (E) Paired measurements of VGAT cluster area (left) and density (right) in miRCon or miR153 OE neurons (as seen in Fig. 5A) prior to (−5 min) and 90 min following treatment. N = 3 / n = 15 neurons per condition. P-values (t = −5 min vs t = 90 min): VGAT area miRCon Ctrl = 0.9966, VGAT area miRCon iLTP = 0.0004, VGAT area miR153 Ctrl = 0.9684, VGAT area miR153 iLTP = 0.9991; VGAT density miRCon Ctrl = 0.9975, VGAT density miRCon iLTP < 0.0001, VGAT density miR153 Ctrl = 0.5521, VGAT density miR153 iLTP > 0.9999. (F) Paired measurements of VGAT cluster area (left) and density (right) in treated neurons (as seen in Fig. 6D) prior to (−5 min) and 90 min following treatment. N = 3/n = 15 neurons per condition. P-values (t = −5 min vs t = 90 min): VGAT area DMSO Ctrl = 0.9176, VGAT area DMSO iLTP = 0.0032, VGAT area CsA Ctrl = 0.9442, VGAT area CsA iLTP = 0.9715; VGAT density DMSO Ctrl = 0.9176, VGAT density DMSO iLTP < 0.0001, VGAT density CsA Ctrl = 0.9840, VGAT density CsA iLTP = 0.9986. N = independent neuronal cultures/experiments. All values represent mean ± SEM. *p < 0.05, **p < 0.01, ***p < 0.005, ****p < 0.0001; mixed-effects model with Geisser-Greenhouse correction (B) and Šidák’s multiple comparisons post-hoc test (BF).

Update of

References

    1. Agarwal S, Tannenberg RK, Dodd PR (2008) Reduced expression of the inhibitory synapse scaffolding protein gephyrin in Alzheimer’s disease. J Alzheimer’s Dis 14(3):313–321 - PubMed
    1. Akhondzadeh S (1999) Hippocampal synaptic plasticity and cognition. J Clin Pharm Ther 24(4):241–248 - PubMed
    1. Barberis A (2020) Postsynaptic plasticity of GABAergic synapses. Neuropharmacology 169:107643 - PubMed
    1. Bar-Ilan L, Gidon A, Segev I (2013) The role of dendritic inhibition in shaping the plasticity of excitatory synapses. Front Neural Circuits 6:118 - PMC - PubMed
    1. Bedet C, Bruusgaard JC, Vergo S, Groth-Pedersen L, Eimer S, Triller A, Vannier C (2006) Regulation of gephyrin assembly and glycine receptor synaptic stability. J Biol Chem 281(40):30046–30056 - PubMed

MeSH terms

LinkOut - more resources