

Deconvolution from bulk gene expression by leveraging sample-wise and gene-wise similarities and single-cell RNA-Seq data
- PMID: 39294558
- PMCID: PMC11409548
- DOI: 10.1186/s12864-024-10728-x
Deconvolution from bulk gene expression by leveraging sample-wise and gene-wise similarities and single-cell RNA-Seq data
Abstract
Background: The widely adopted bulk RNA-seq measures the gene expression average of cells, masking cell type heterogeneity, which confounds downstream analyses. Therefore, identifying the cellular composition and cell type-specific gene expression profiles (GEPs) facilitates the study of the underlying mechanisms of various biological processes. Although single-cell RNA-seq focuses on cell type heterogeneity in gene expression, it requires specialized and expensive resources and currently is not practical for a large number of samples or a routine clinical setting. Recently, computational deconvolution methodologies have been developed, while many of them only estimate cell type composition or cell type-specific GEPs by requiring the other as input. The development of more accurate deconvolution methods to infer cell type abundance and cell type-specific GEPs is still essential.
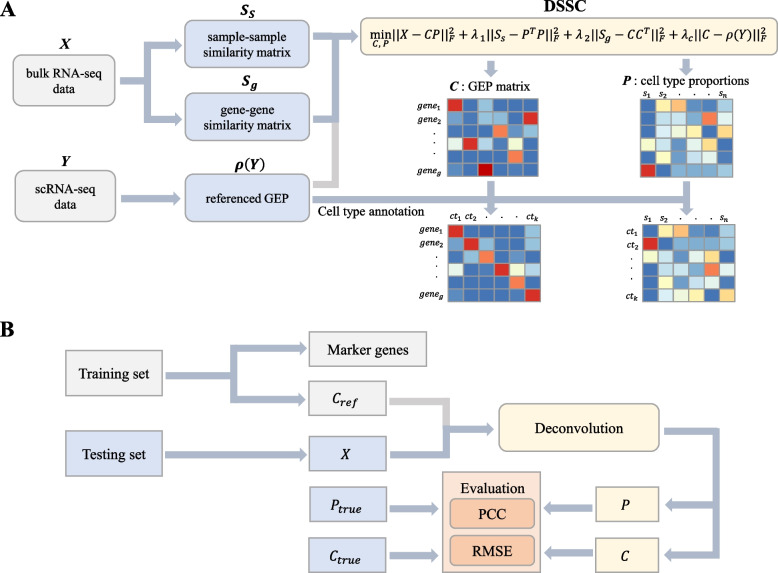
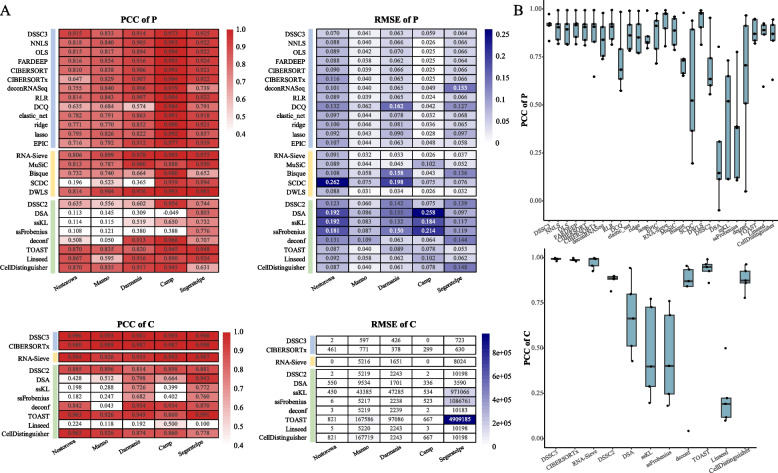
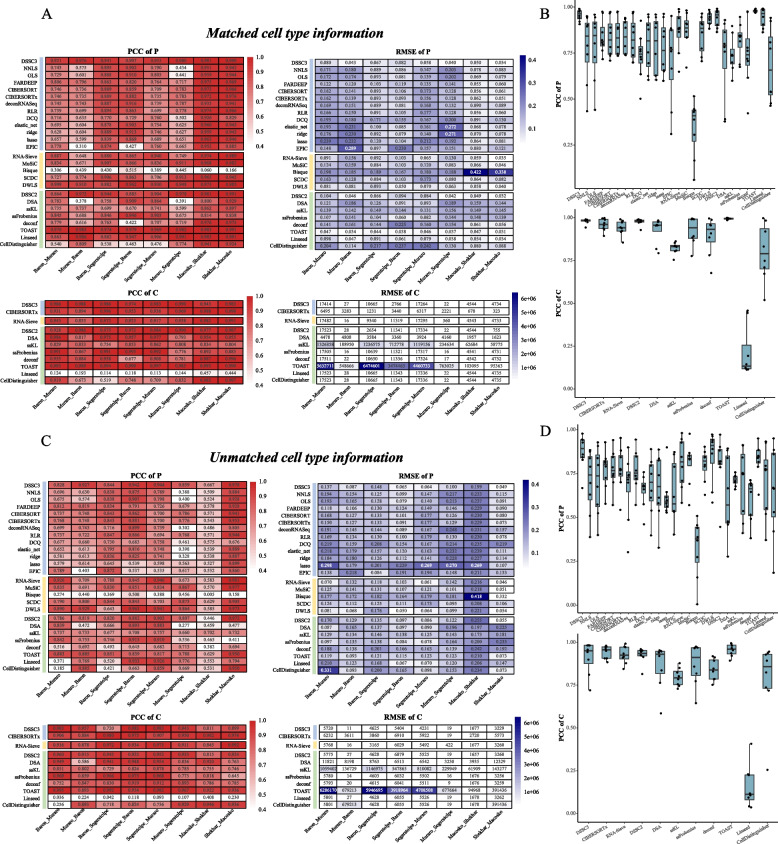
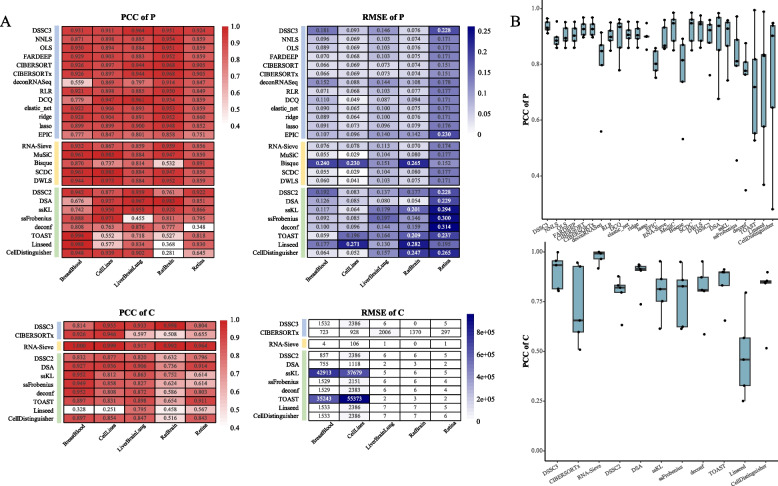
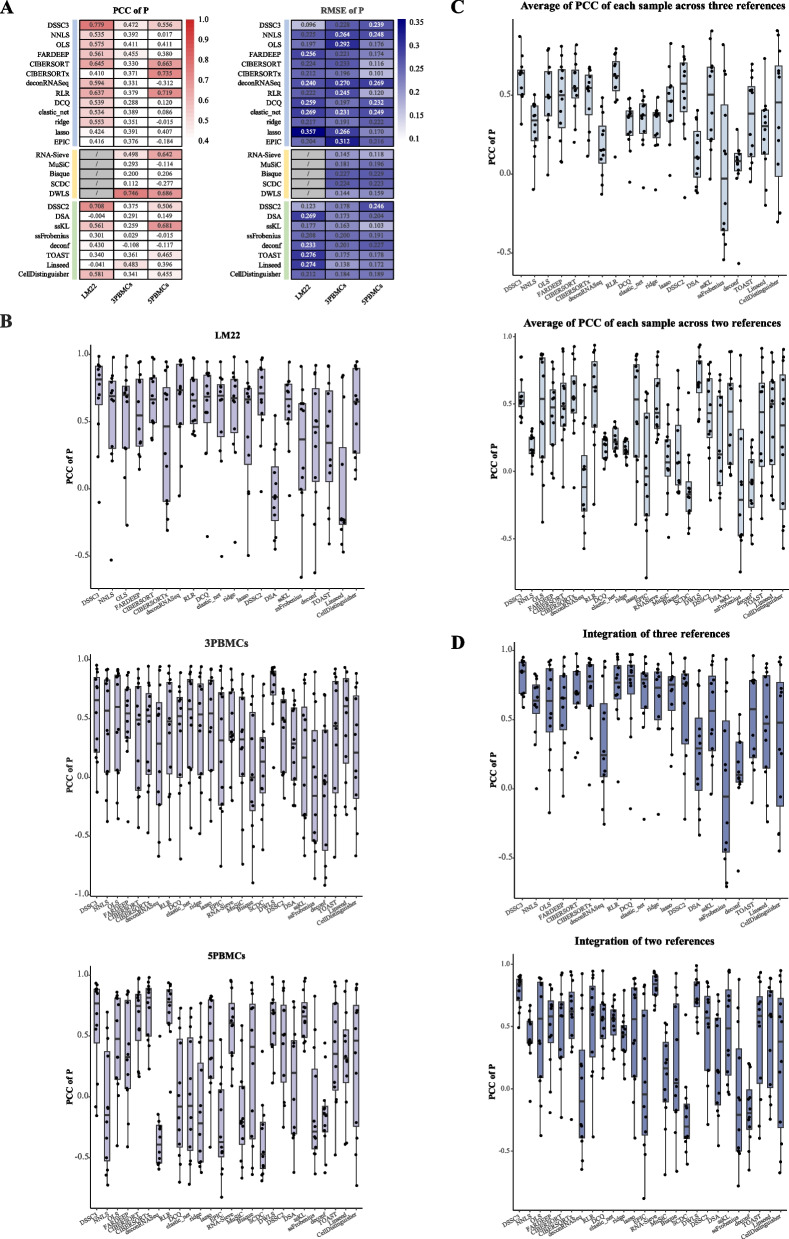
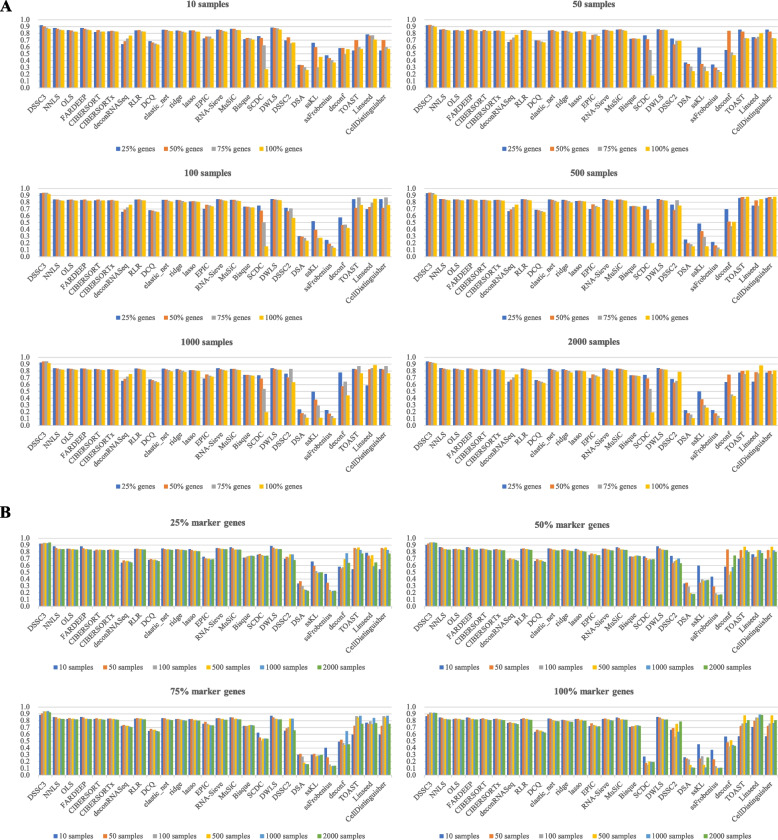
Results: We propose a new deconvolution algorithm, DSSC, which infers cell type-specific gene expression and cell type proportions of heterogeneous samples simultaneously by leveraging gene-gene and sample-sample similarities in bulk expression and single-cell RNA-seq data. Through comparisons with the other existing methods, we demonstrate that DSSC is effective in inferring both cell type proportions and cell type-specific GEPs across simulated pseudo-bulk data (including intra-dataset and inter-dataset simulations) and experimental bulk data (including mixture data and real experimental data). DSSC shows robustness to the change of marker gene number and sample size and also has cost and time efficiencies.
Conclusions: DSSC provides a practical and promising alternative to the experimental techniques to characterize cellular composition and heterogeneity in the gene expression of heterogeneous samples.
Keywords: Cell type abundance; Cell type-specific gene expression profile; Deconvolution; Similarity matrix; Single-cell RNA-seq data.
© 2024. The Author(s).
Conflict of interest statement
The authors have declared no competing interests.
Figures
Similar articles
-
Transcriptome size matters for single-cell RNA-seq normalization and bulk deconvolution.Nat Commun. 2025 Feb 1;16(1):1246. doi: 10.1038/s41467-025-56623-1. Nat Commun. 2025. PMID: 39893178 Free PMC article.
-
DeSide: A unified deep learning approach for cellular deconvolution of tumor microenvironment.Proc Natl Acad Sci U S A. 2024 Nov 12;121(46):e2407096121. doi: 10.1073/pnas.2407096121. Epub 2024 Nov 8. Proc Natl Acad Sci U S A. 2024. PMID: 39514318 Free PMC article.
-
NNICE: a deep quantile neural network algorithm for expression deconvolution.Sci Rep. 2024 Jun 18;14(1):14040. doi: 10.1038/s41598-024-65053-w. Sci Rep. 2024. PMID: 38890415 Free PMC article.
-
Computational deconvolution of transcriptomics data from mixed cell populations.Bioinformatics. 2018 Jun 1;34(11):1969-1979. doi: 10.1093/bioinformatics/bty019. Bioinformatics. 2018. PMID: 29351586 Review.
-
Evaluating cell type deconvolution in FFPE breast tissue: application to benign breast disease.NAR Genom Bioinform. 2024 Aug 6;6(3):lqae098. doi: 10.1093/nargab/lqae098. eCollection 2024 Sep. NAR Genom Bioinform. 2024. PMID: 40162103 Free PMC article. Review.
Cited by
-
Revolutionizing Implantation Studies: Uterine-Specific Models and Advanced Technologies.Biomolecules. 2025 Mar 20;15(3):450. doi: 10.3390/biom15030450. Biomolecules. 2025. PMID: 40149986 Free PMC article. Review.
References
-
- Bennett DA, Schneider JA, Buchman AS, Mendes de Leon C, Bienias JL, Wilson RS. The rush memory and aging roject: study design and baseline characteristics of the study cohort. Neuroepidemiology. 2005;25(4):163–75. - PubMed
-
- Avila Cobos F, Vandesompele J, Mestdagh P, De Preter K. Computational deconvolution of transcriptomics data from mixed cell populations. Bioinformatics. 2018;34(11):1969–79. - PubMed
MeSH terms
Grants and funding
LinkOut - more resources
Full Text Sources
