. 2024 Sep 18;30(1):153.
doi: 10.1186/s10020-024-00877-w.

Low-dose pro-resolving mediators temporally reset the resolution response to microbial inflammation

Affiliations

Low-dose pro-resolving mediators temporally reset the resolution response to microbial inflammation

Charles N Serhan et al. Mol Med. .

Abstract

Background: Specialized pro-resolving mediators (SPMs) promote resolution of inflammation, clear infections and stimulate tissue regeneration. These include resolvins, protectins, and maresins. During self-resolving acute inflammation, SPMs are produced and have key functions activating endogenous resolution response for returning to homeostasis. Herein, we addressed whether infections initiated with ongoing inflammation alter resolution programs, and if low-dose repetitive SPM regimen re-programs the resolution response.

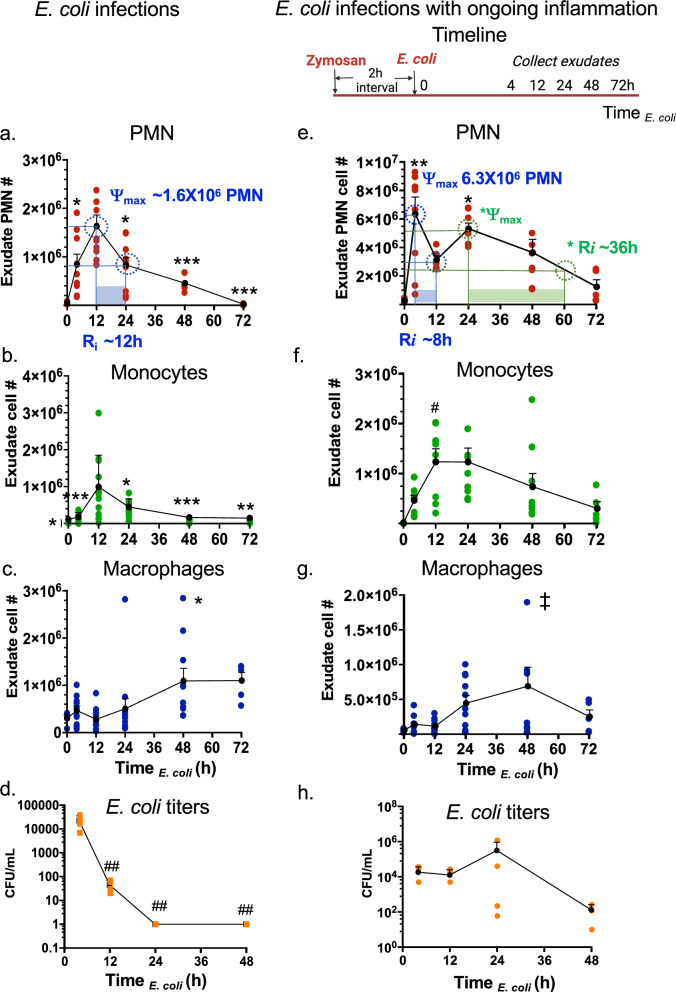
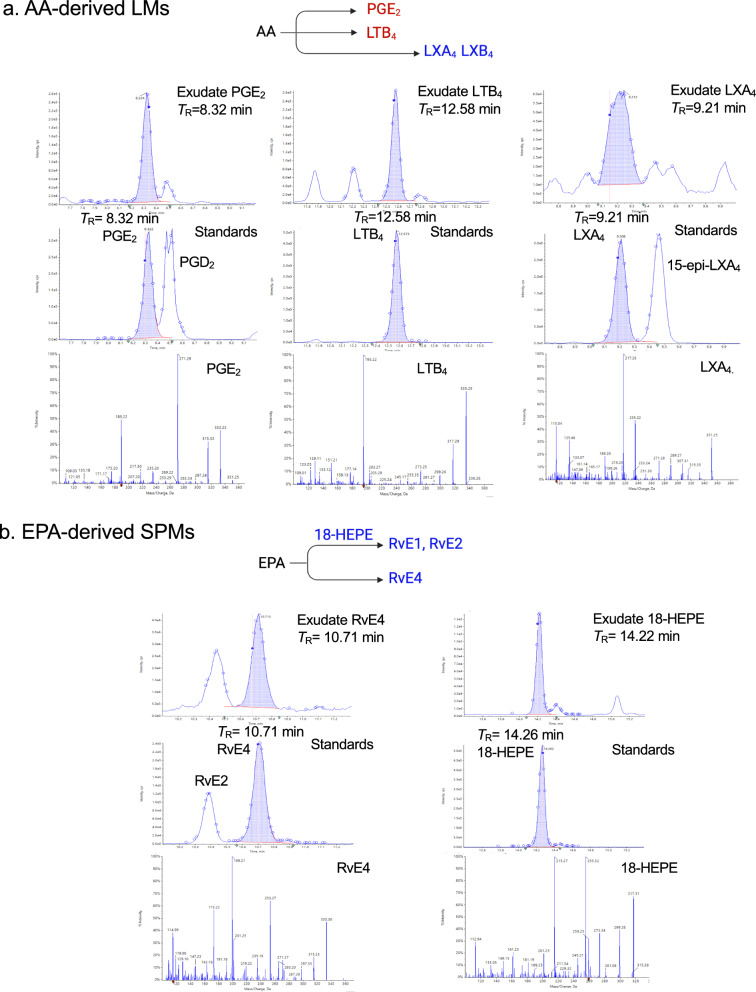
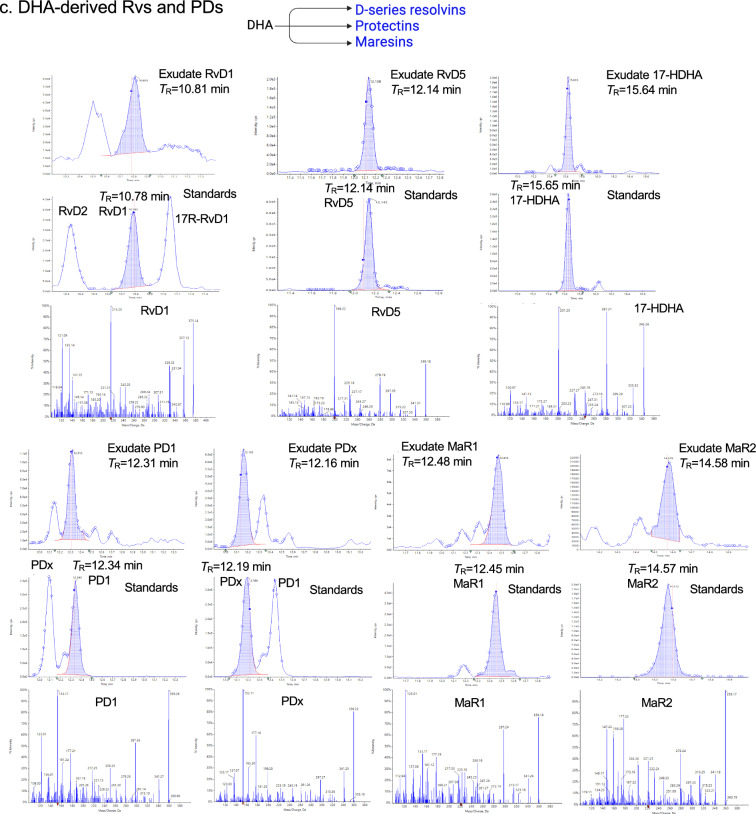
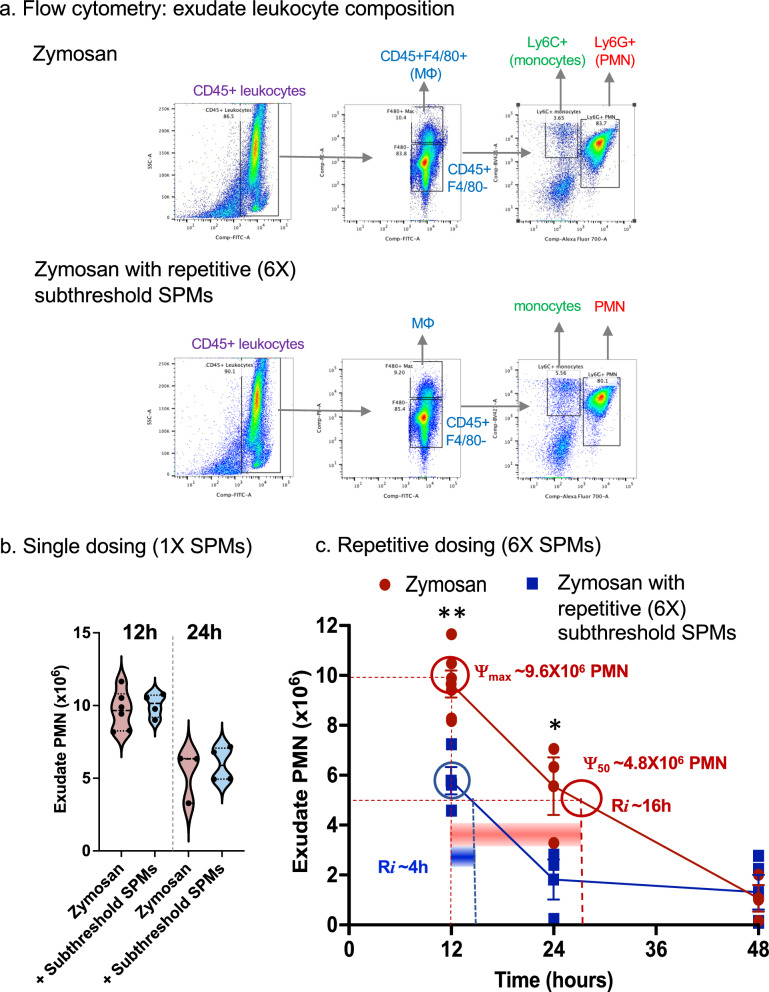
Methods: Inflammation was initiated with zymosan (1 mg/mouse) followed by E. coli (105 CFU/mouse) infections carried out in murine peritonitis, and exudates collected at 4-72 h. Leukocytes were enumerated using light microscopy, percentages of PMN, monocytes and macrophages were determined using flow cytometry, and resolution indices calculated. Lipid mediators and SPM profiles were established using mass spectrometry-based metabololipidomics. Repetitive dosing with a SPM panel consisting of RvD1, RvD2, RvD5, MaR1 and RvE2 (0.1 ng/mouse each, i.p.) was given to mice, followed by zymosan challenge. Leukocyte composition, resolution indices and RNA-sequencing were carried out for the repetitive SPM treatments.

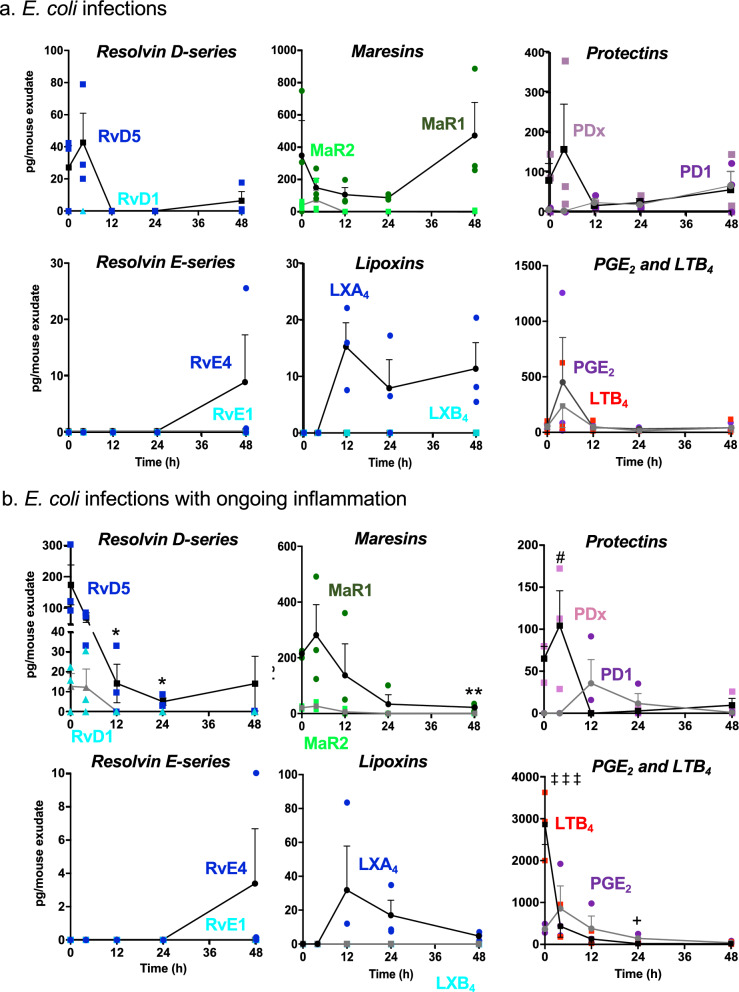
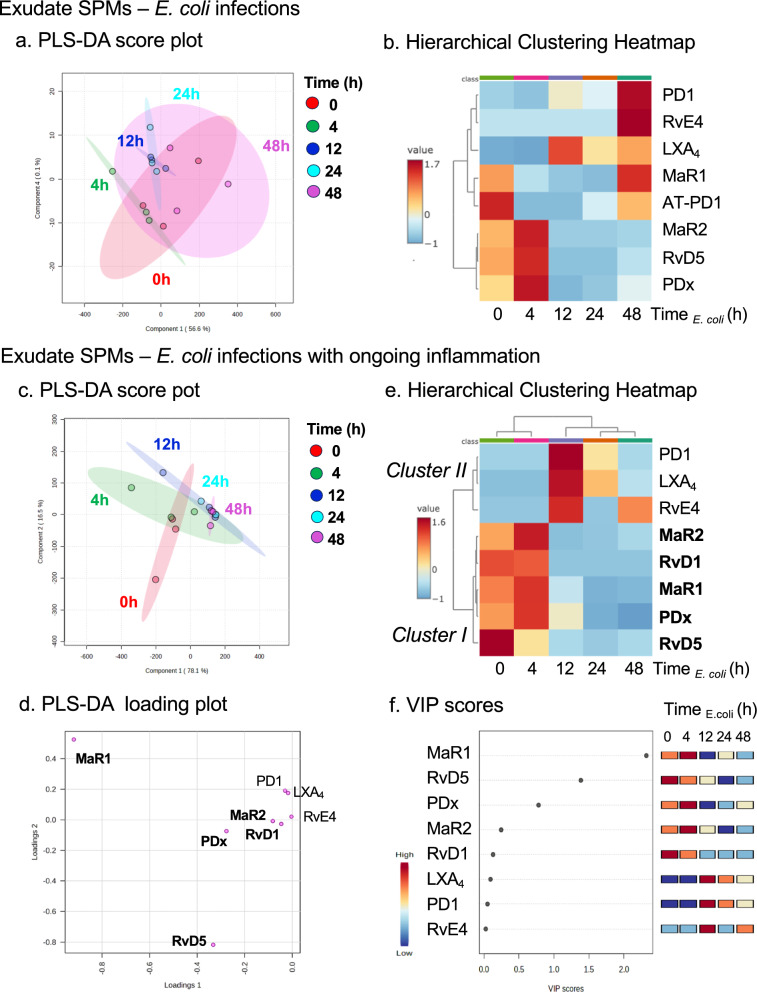
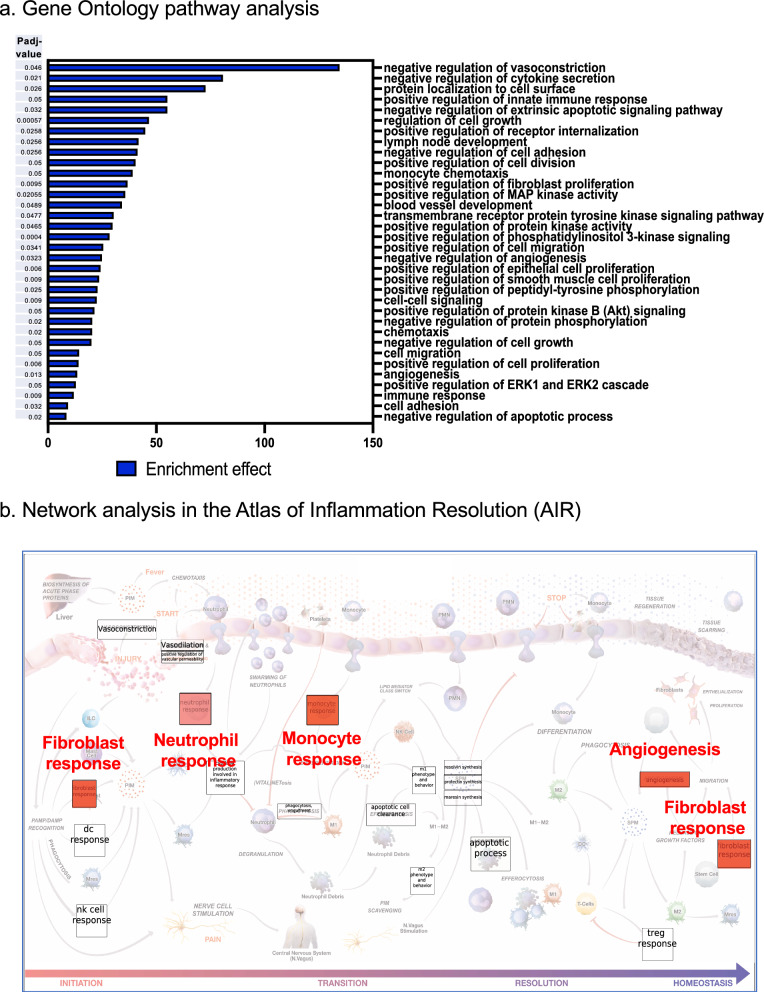
Results: E. coli infections initiated acute inflammation-resolution programs with temporal SPM production in the infectious exudates. Zymosan-induced inflammation prior to E. coli peritonitis shifted exudate resolution indices and delayed E. coli clearance. Lipid mediator metabololipidomics demonstrated that E. coli infection with ongoing zymosan-induced inflammation shifted the time course of exudate SPMs, activating a SPM cluster that included RvD1, RvD5 and MaR1 during the initiation phase of infectious inflammation (0-4 h); RvD5 and MaR1 were present also in the resolution phase (24-48 h). To emulate daily SPM regimens used in humans, a repetitive subthreshold dosing of the SPM panel RvD1, RvD2, RvD5, MaR1 and RvE2 each at 0.1 ng per mouse was administered. This low-dose SPM regimen accelerated exudate PMN clearance following zymosan-induced inflammation, and shortened the resolution interval by > 70%. These low-dose SPMs regulated genes and pathways related to immune response, chemokine clearance and tissue repair, as demonstrated by using RNA-sequencing.

Conclusions: Infections encountered during ongoing inflammation in mice reset the resolution mechanisms of inflammation via SPM clusters. Low-dose SPMs activate innate immune responses and pathways towards the resolution response that can be reprogrammed.

Keywords: LC–MS–MS; Macrophage; Maresins; Neutrophil; Protectins; Resolvins; SPMs.


Conflict of interest statement

The authors declared that there are no competing interests.

Figures

Fig. 1
Fig. 1
Resolution intervals for E. coli infections shift with ongoing zymosan inflammation. (a-d) E. coli infection. Mice (C57B6, 6-wk old male) were given saline (1 ml, i.p.) two hours prior to inoculation of E. coli (105 CFU, i.p.). Peritoneal exudates were collected by lavaging at indicated time points (Time E. coli). Total leukocytes were enumerated, and leukocyte composition determined using flow cytometry (see representative dot plots in Supplementary Fig. 1). a Exudate PMN time course and resolution indices (ψmax and Ri, see Methods). b exudate monocyte, c macrophage and d E. coli titer time course. eh E. coli infection with ongoing inflammation. Timeline: Mice were given zymosan (1 mg/ml, i.p.) two hours prior to inoculation of E. coli (105 CFU, i.p.). Peritoneal exudates were collected by lavaging at indicated time points (Time E. coli). e Exudate PMN time course and resolution indices (ψmax and Ri, see Methods). f exudate monocyte, g macrophage and h E. coli titer time course. ac, eg Three independent experiments were carried out and 3-4 mice were used for each time point in each experiment. Results are cell numbers/mouse exudate; mean ± SEM; each dot denotes the value obtained from individual mice. (d,h) One dataset from two independent experiments are shown, and in each experiment, E. coli titers of 3-4 mice for each time point were determined. Results are E. coli titers/mouse exudate; mean ± SEM; each dot is the value obtained from one mouse. (a-d) *P < 0.05, **P < 0.01, ***P < 0.001 vs 12 h; ##P < 0.01 vs 4 h. eg *P < 0.05, **P < 0.01 vs. 0 and 72 h; #P < 0.05 vs 0 h; P < 0.05 vs 4 h using one-way ANOVA with Tukey's post-test
Fig. 2
Fig. 2
Identification of exudate lipid mediators (LM): SPMs and eicosanoids. Exudate SPMs and eicosanoids were identified using LC–MS-MS-based metabololipidomics (see Methods). Screen captures of MRM chromatograms and MS–MS of identified LMs. For each LM, MRM of exudate LM (top panel) and synthetic standards (middle panel) as well as MS–MS of synthetic standard (bottom panel) are shown. See Fig. S3 for the enlarged MS–MS. The retention time (TR) of individual LM matched that obtained with synthetic standard. In MRM chromatograms, shaded blue areas denote the area under the curve used for quantitation. Dark blue data points indicate where the spectra were collected. a AA-derived LMs. PGE2: TR 8.32 min, MRM of m/z 351 > 189, S/N ratio 643; LTB4: TR 12.58 min, MRM of m/z 335 > 195, S/N ratio 402; LXA4: TR 9.21 min; MRM of m/z 351 > 115; S/N ratio 69. b EPA-derived SPMs. RvE4: TR 10.71 min, MRM of m/z 333 > 115, S/N ratio 159; 18-HEPE: TR 14.22 min, MRM of m/z 317 > 259, S/N ratio 730. c DHA-derived Rvs, PDs, and MaRs. RvD1: TR 10.81 min, MRM of m/z 375 > 215, S/N ratio 39; RvD5: TR 12.14 min, MRM of m/z 359 > 199, S/N ratio 332; 17-HDHA: TR 15.64 min, MRM of m/z 343 > 245, S/N ratio 1,610; PD1: TR 12.31 min, MRM of m/z 359 > 153, S/N ratio 127; PDx: TR 12.16 min, MRM of m/z 359 > 153, S/N ratio 409; MaR1: TR 12.48 min, MRM of m/z 359 > 221, S/N ratio 148; MaR2: TR 14.58 min, MRM of m/z 359 > 221, S/N ratio 269
Fig. 2
Fig. 2
Identification of exudate lipid mediators (LM): SPMs and eicosanoids. Exudate SPMs and eicosanoids were identified using LC–MS-MS-based metabololipidomics (see Methods). Screen captures of MRM chromatograms and MS–MS of identified LMs. For each LM, MRM of exudate LM (top panel) and synthetic standards (middle panel) as well as MS–MS of synthetic standard (bottom panel) are shown. See Fig. S3 for the enlarged MS–MS. The retention time (TR) of individual LM matched that obtained with synthetic standard. In MRM chromatograms, shaded blue areas denote the area under the curve used for quantitation. Dark blue data points indicate where the spectra were collected. a AA-derived LMs. PGE2: TR 8.32 min, MRM of m/z 351 > 189, S/N ratio 643; LTB4: TR 12.58 min, MRM of m/z 335 > 195, S/N ratio 402; LXA4: TR 9.21 min; MRM of m/z 351 > 115; S/N ratio 69. b EPA-derived SPMs. RvE4: TR 10.71 min, MRM of m/z 333 > 115, S/N ratio 159; 18-HEPE: TR 14.22 min, MRM of m/z 317 > 259, S/N ratio 730. c DHA-derived Rvs, PDs, and MaRs. RvD1: TR 10.81 min, MRM of m/z 375 > 215, S/N ratio 39; RvD5: TR 12.14 min, MRM of m/z 359 > 199, S/N ratio 332; 17-HDHA: TR 15.64 min, MRM of m/z 343 > 245, S/N ratio 1,610; PD1: TR 12.31 min, MRM of m/z 359 > 153, S/N ratio 127; PDx: TR 12.16 min, MRM of m/z 359 > 153, S/N ratio 409; MaR1: TR 12.48 min, MRM of m/z 359 > 221, S/N ratio 148; MaR2: TR 14.58 min, MRM of m/z 359 > 221, S/N ratio 269
Fig. 3
Fig. 3
Time course of exudate SPMs and eicosanoids. Exudate SPMs and eicosanoids obtained from mice with a E. coli infections and b E. coli infections with ongoing inflammation were each quantified using LC–MS-MS-based metabololipidomics. See Fig. 2 for screen captures of MRM chromatograms of identified SPMs and eicosanoids. Three independent experiments were carried out. In each experiment, 3–4 mouse exudates collected from the same time point were pooled for lipid mediator extraction and LC–MS-MS. Results are expressed as pg/mouse exudate (2 mL); mean ± SEM, each dot denotes the value obtained from one experiment. *P < 0.05 (RvD5), **P < 0.01 (MaR1) vs. 0 h; #P < 0.05 (PDx) vs. 12, 24 and 48 h; +P < 0.05 (PGE2) vs. 0 h, ‡‡‡P < 0.001 (LTB4) vs. 4, 12, 24 and 48 h using one-way ANOVA with Tukey's post-test
Fig. 4
Fig. 4
Exudate SPM profiles and clusters on sequential activation. PLS-DA and heatmaps of a, b E. coli infections and (c-f) E. coli infections with ongoing inflammation. a, c, d Partial Least Squares Discriminant Analysis (PLS-DA) of identified SPMs. a, c The score plot (each dot represents profiles from each time point in each experiment) shows clustering among groups (i.e., time points 0, 2, 12, 24 and 48 h), where closer clusters present higher similarity in the data matrix; d the loading plot demonstrates correlations in which the measured SPMs contribute to the cluster separation in the score plot. b, e The hierarchical clustering heatmaps were generated using normalized data with autoscale features. Euclidean distance was used for distance measure and Ward's method was applied in hierarchical cluster analysis (see Methods). Averages of n = 3 for each SPM in each time point are shown. f Variable Importance in Projection (VIP) score plot of exudate SPMs, depicting the relative levels of each mediator across the 5 experimental groups (0, 4, 12, 24 and 48 h). RvD5 and MaR1 give highest VIP scores > 1. The colored boxes on the right indicate the relative concentrations (red: high, blue: low) of the corresponding SPMs in each group
Fig. 5
Fig. 5
SPM programming in vivo accelerates resolution of inflammation, shortening resolution intervals. Mice were administered with a panel of SPMs (RvD1, RvD2, RvD5, MaR1 and RvE2, 0.1 ng of each SPM in 1 mL saline for each mouse, i.p.) or vehicle control (0.01% ethanol in 1 mL saline) 5 times on Day 0, 2, 5, 7, and 9. On day 12, the panel of SPMs or vehicle was given together with zymosan (1 mg/mouse, i.p.), and exudates collected at indicated time points (see Timelines in Fig. S7a). Total leukocytes were enumerated, and leukocyte composition determined by flow cytometry. a Exudate leukocyte composition identified using flow cytometry. Representative dot plots of exudate samples collected at 12 h with gating strategy to identify PMN, monocytes and macrophages. (Top) Zymosan (Bottom) Zymosan with repetitive subthreshold SPMs. b Zymosan vs zymosan plus one-time (1X) subthreshold SPMs at 12 and 24 h. c Zymosan (red curve) vs. repetitive (6X) subthreshold SPMs (blue curve); time course 12-48 h and resolution indices (ψmax, ψ50 and Ri, see Methods); mean ± SEM, n = 4–6 (12 h) or 3 (24 or 48 h), *P < 0.05, **P < 0.01 using two-tailed Student’s t-test. Each dot denotes cell number obtained from one mouse
Fig. 6
Fig. 6
SPMs regulate transcriptome and immune pathways towards resolution and homeostasis. a RNA-seq Gene ontology (GO) enrichment analysis of DEGs that are significantly regulated by SPMs, and related to immune functions. X-axis represents enrichment effect (see Methods for the equation) and Y-axis represents different GO terms. The adjusted p-value (Padj-value) are shown on the left for the corresponding GO term when comparing zymosan plus subthreshold SPMs vs. zymosan alone (n = 4), Padj- < 0.05. Also see Supplementary Table S6 for the genes in each GO term. b Inflammation-resolution network analysis using “Atlas of Inflammation Resolution (AIR)” (Serhan et al. ; Hoch et al. 2022) (https://air.bio.informatik.uni-rostock.de). Inflammation-resolution processes and phenotypes were grouped into 4 phases (inflammation initiation, transition, resolution, and homeostasis). Repetitive subthreshold SPMs up-regulated select phenotypes in each phase, highlighted in red. See Fig. S9a for a clear view of all processes and phenotypes, genes in each phenotype in “Atlas of Inflammation Resolution”, and Fig. S9b for central regulatory network (CRN) for some of these pathways

Similar articles

Cited by

References

    1. AlZahrani S, Shinwari Z, Gaafar A, Alaiya A, Al-Kahtani A. Anti-inflammatory effect of specialized proresolving lipid mediators on mesenchymal stem cells: an in vitro study. Cells. 2022;12:122. - PMC - PubMed
    1. Araujo P, Iqbal S, Arnø A, Espe M, Holen E. Validation of a liquid-liquid extraction method to study the temporal production of D-Series resolvins by head kidney cells from atlantic salmon (Salmon salar) exposed to docosahexaenoic acid. Molecules. 2023;28:4728. - PMC - PubMed
    1. Arnardottir H, Orr SK, Dalli J, Serhan CN. Human milk proresolving mediators stimulate resolution of acute inflammation. Mucosal Immunol. 2016;9:757–66. - PMC - PubMed
    1. Barden A, Shinde S, Beilin LJ, Phillips M, Adams L, Bollmann S, et al. Adiposity associates with lower plasma resolvin E1 (Rve1): a population study. Int J Obes (lond). 2024;48:725–32. - PMC - PubMed
    1. Bardin M, Pawelzik SC, Lagrange J, Mahdi A, Arnardottir H, Regnault V, et al. The resolvin D2 - GPR18 axis is expressed in human coronary atherosclerosis and transduces atheroprotection in apolipoprotein E deficient mice. Biochem Pharmacol. 2022;201: 115075. - PubMed