

Existing evidence related to soil retention of phosphorus from on-site wastewater treatment systems in boreal and temperate climate zones: a systematic map
- PMID: 39294785
- PMCID: PMC11378865
- DOI: 10.1186/s13750-023-00300-7
Existing evidence related to soil retention of phosphorus from on-site wastewater treatment systems in boreal and temperate climate zones: a systematic map
Abstract
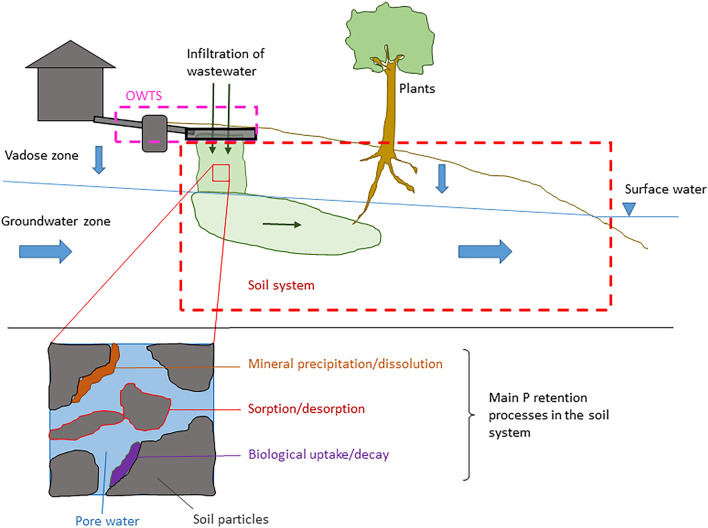
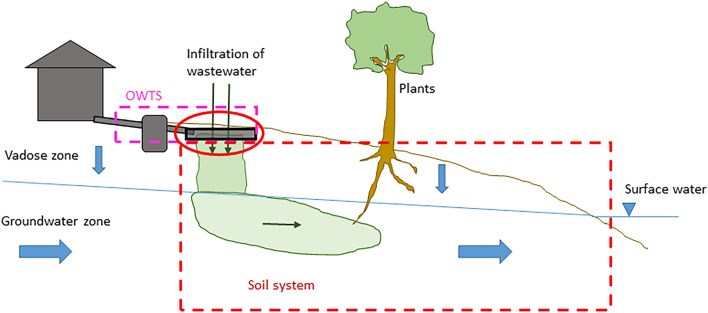
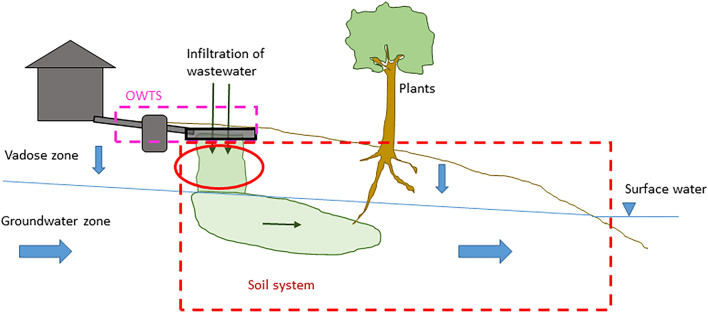
Background: In Sweden there are nearly one million soil-based on-site wastewater treatment systems (OWTSs). OWTSs may contribute to eutrophication of surface waters, due to the discharge of phosphorus (P). Hence, in certain cases, a high P removal rate (up to 90%) of OWTSs is required by Swedish authorities. Since these requirements may have costly consequences to property owners, it is debated whether they are too strict. In this debate, it is often claimed that the soil retention of P occurring in the natural environments may be underestimated by authorities. Soil retention is the inhibition of the transport of P through the ground, due to different chemical, physical and biological processes occurring there. These processes make the P transport slower, which may reduce the unwanted impact on receiving water bodies. However, the efficiency of soil retention of P remains unclear. The objective of this systematic map was to collect, code, organise and elucidate the relevant evidence related to the topic, to be able to guide stakeholders through the evidence base, and to support future research synthesising, commissioning, and funding. The systematic map was carried out in response to needs declared by the Swedish Agency for Marine and Water Management but the conclusions should be valid for a wider range of countries across boreo-temperate regions.
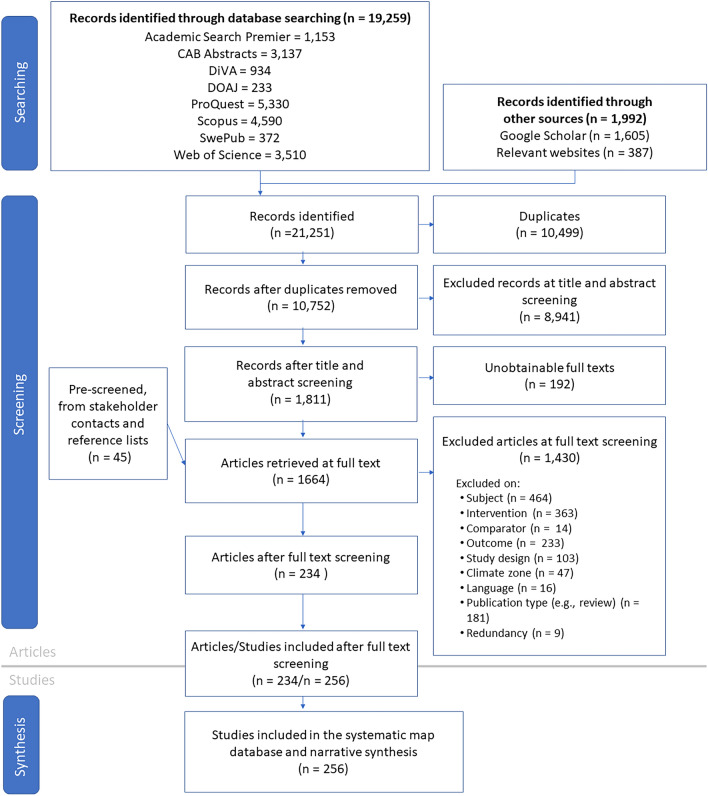
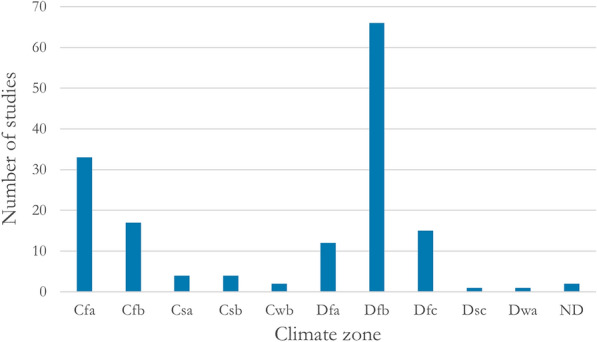
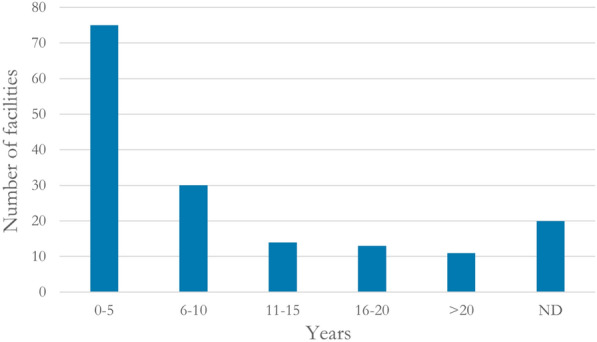
Methods: Searches were made for peer-reviewed and grey literature using bibliographic databases, search engines, specialist websites, and stakeholder contacts. The references were screened for relevance according to a predefined set of eligibility criteria. A detailed database of the relevant studies was compiled. Data and metadata that enable evaluation and discussion of the character and quality of the evidence base were extracted and coded. Special focus was placed on assessing if existing evidence could contribute to policy and practice decision making. Descriptive information about the evidence base was presented in tables and figures. An interactive evidence atlas and a choropleth were created, displaying the locations of all studies.
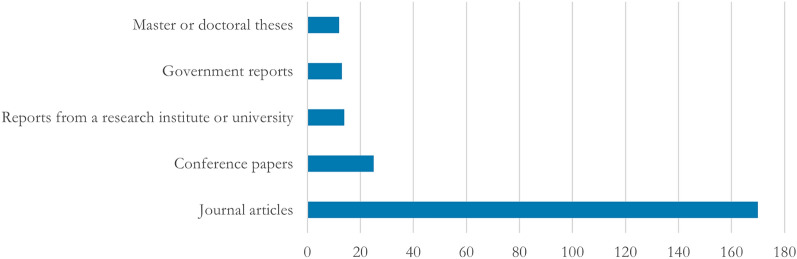
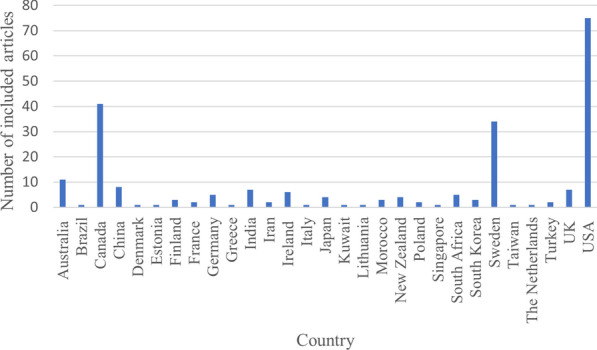
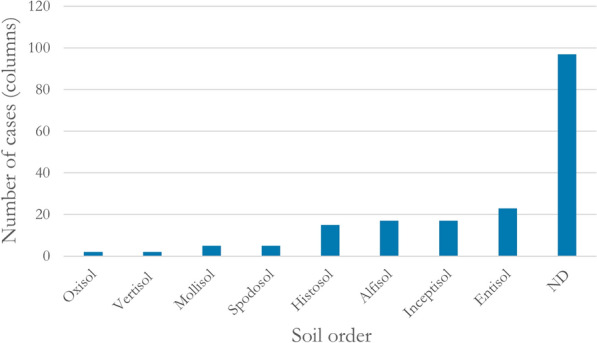
Review findings: 234 articles out of 10,797 screened records fulfilled the eligibility criteria. These articles contain 256 studies, performed in the field or in the laboratory. Six different study types were identified, based on where the measurements were conducted. Most studies, including laboratory studies, lack replicates. Most field studies are observational case studies.
Conclusions: It is not possible to derive valid generic measures of the efficiency of soil retention of P occurring in the natural soil environment from available research. Neither does the evidence base allow for answering the question of the magnitude of the potential impact of OWTSs on the P concentration in recipients on a general basis, or under what conditions OWTSs generally have such an impact. A compilation of groundwater studies may provide examples of how far the P may reach in x years, but the number of groundwater studies is insufficient to draw any general conclusions, given the complexity and variability of the systems. Future research should strive for replicated study designs, more elaborate reporting, and the establishment of a reporting standard.
Keywords: Adsorption; Drainfields; Eutrophication; Infiltration; OWS; OWTS; Phosphorus removal; Precipitation; Septic systems; Septic tanks; Soil treatment; Sweden.
© 2023. The Author(s).
Conflict of interest statement
The authors declare that they have no competing interests.
Figures


References
-
- Drizo A. Phosphorus pollution control—policies and strategies. 1st ed. Hoboken: John Wiley & Sons; 2020.
-
- Canter L, Knox RC. Evaluation of septic tank system effluents on ground water quality. Ada, Oklahoma: US Environmental Protection Agency; 1984. Report EPA-600/2–84–107. Ada: US Environmental Protection Agency; 1984.
-
- Speed CD, Fretwell BA, Davison PS. The role of septic tanks in the dissolved phosphorus budget of the Upper River Nar and possible implications for other catchments. Q J Eng Geol Hydrogeol. 2018;52:23–37. 10.1144/qjegh2018-004.
-
- Swedish Agency for Marine and Water Management (SwAM). Havs- och vattenmyndighetens allmänna råd om små avloppsanläggningar för hushållsspillvatten; 2016. HVMFS 2016:17.
-
- Robertson WD, Garda DL. Pyrite oxidation halts migration of a phosphorus plume. Groundwater. 2020;58:27–34. 10.1111/gwat.12877. - PubMed
LinkOut - more resources
Full Text Sources