Quantitative evidence synthesis: a practical guide on meta-analysis, meta-regression, and publication bias tests for environmental sciences
- PMID: 39294795
- PMCID: PMC11378872
- DOI: 10.1186/s13750-023-00301-6
Quantitative evidence synthesis: a practical guide on meta-analysis, meta-regression, and publication bias tests for environmental sciences
Abstract
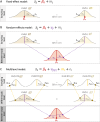
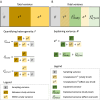
Meta-analysis is a quantitative way of synthesizing results from multiple studies to obtain reliable evidence of an intervention or phenomenon. Indeed, an increasing number of meta-analyses are conducted in environmental sciences, and resulting meta-analytic evidence is often used in environmental policies and decision-making. We conducted a survey of recent meta-analyses in environmental sciences and found poor standards of current meta-analytic practice and reporting. For example, only ~ 40% of the 73 reviewed meta-analyses reported heterogeneity (variation among effect sizes beyond sampling error), and publication bias was assessed in fewer than half. Furthermore, although almost all the meta-analyses had multiple effect sizes originating from the same studies, non-independence among effect sizes was considered in only half of the meta-analyses. To improve the implementation of meta-analysis in environmental sciences, we here outline practical guidance for conducting a meta-analysis in environmental sciences. We describe the key concepts of effect size and meta-analysis and detail procedures for fitting multilevel meta-analysis and meta-regression models and performing associated publication bias tests. We demonstrate a clear need for environmental scientists to embrace multilevel meta-analytic models, which explicitly model dependence among effect sizes, rather than the commonly used random-effects models. Further, we discuss how reporting and visual presentations of meta-analytic results can be much improved by following reporting guidelines such as PRISMA-EcoEvo (Preferred Reporting Items for Systematic Reviews and Meta-Analyses for Ecology and Evolutionary Biology). This paper, along with the accompanying online tutorial, serves as a practical guide on conducting a complete set of meta-analytic procedures (i.e., meta-analysis, heterogeneity quantification, meta-regression, publication bias tests and sensitivity analysis) and also as a gateway to more advanced, yet appropriate, methods.
Keywords: Hierarchical models; Meta-analysis of variance; Missing data; Multivariate meta-analysis; Network meta-analysis; Robust variance estimation; Spatial dependency; Variance–covariance matrix.
© 2023. The Author(s).
Conflict of interest statement
The authors report no competing interests.
Figures


Similar articles
-
Preferred reporting items for systematic reviews and meta-analyses in ecology and evolutionary biology: a PRISMA extension.Biol Rev Camb Philos Soc. 2021 Oct;96(5):1695-1722. doi: 10.1111/brv.12721. Epub 2021 May 7. Biol Rev Camb Philos Soc. 2021. PMID: 33960637 Free PMC article.
-
Public sector reforms and their impact on the level of corruption: A systematic review.Campbell Syst Rev. 2021 May 24;17(2):e1173. doi: 10.1002/cl2.1173. eCollection 2021 Jun. Campbell Syst Rev. 2021. PMID: 37131927 Free PMC article. Review.
-
Publication bias impacts on effect size, statistical power, and magnitude (Type M) and sign (Type S) errors in ecology and evolutionary biology.BMC Biol. 2023 Apr 3;21(1):71. doi: 10.1186/s12915-022-01485-y. BMC Biol. 2023. PMID: 37013585 Free PMC article.
-
The future of Cochrane Neonatal.Early Hum Dev. 2020 Nov;150:105191. doi: 10.1016/j.earlhumdev.2020.105191. Epub 2020 Sep 12. Early Hum Dev. 2020. PMID: 33036834
-
Effectiveness of school-based programs to reduce bullying perpetration and victimization: An updated systematic review and meta-analysis.Campbell Syst Rev. 2021 Apr 5;17(2):e1143. doi: 10.1002/cl2.1143. eCollection 2021 Jun. Campbell Syst Rev. 2021. PMID: 37131921 Free PMC article. Review.
Cited by
-
Global meta-analysis shows reduced quality of food crops under inadequate animal pollination.Nat Commun. 2023 Jul 25;14(1):4463. doi: 10.1038/s41467-023-40231-y. Nat Commun. 2023. PMID: 37491349 Free PMC article.
-
Understanding trends in Zostera research, stressors, and response variables: a global systematic review of the seagrass genus.PeerJ. 2025 Apr 17;13:e19209. doi: 10.7717/peerj.19209. eCollection 2025. PeerJ. 2025. PMID: 40256742 Free PMC article.
-
Effects of converting cropland to grassland on greenhouse gas emissions from peat and organic-rich soils in temperate and boreal climates: a systematic review.Environ Evid. 2025 Jan 19;14(1):1. doi: 10.1186/s13750-024-00354-1. Environ Evid. 2025. PMID: 39828798 Free PMC article.
-
A systematic review and meta-analysis of unimodal and multimodal predation risk assessment in birds.Nat Commun. 2024 May 18;15(1):4240. doi: 10.1038/s41467-024-48702-6. Nat Commun. 2024. PMID: 38762491 Free PMC article.
-
Association of Vegetarian and Vegan Diets with Cardiovascular Health: An Umbrella Review of Meta-Analysis of Observational Studies and Randomized Trials.Nutrients. 2023 Sep 22;15(19):4103. doi: 10.3390/nu15194103. Nutrients. 2023. PMID: 37836394 Free PMC article.
References
-
- Higgins JP, Thomas JE, Chandler JE, Cumpston ME, Li TE, Page MJ, Welch VA. Cochrane handbook for systematic reviews of interventions. 2nd ed. Chichester: Wikey; 2019.
-
- Cooper HM, Hedges LV, Valentine JC. The handbook of research synthesis and meta-analysis. 3rd ed. New York: Russell Sage Foundation; 2019.
-
- Schmid CH, Stijnen TE, White IE. Handbook of meta-analysis. 1st ed. Boca Ranton: CRC; 2021.
-
- Vetter D, Rucker G, Storch I. Meta-analysis: a need for well-defined usage in ecology and conservation biology. Ecosphere. 2013;4(6):1.10.1890/ES13-00062.1 - DOI
-
- Koricheva J, Gurevitch J, Mengersen K, editors. Handbook of meta-analysis in ecology and evolution. Princeton: Princeton Univesity Press; 2017.
Grants and funding
LinkOut - more resources
Full Text Sources
