. 2024 Sep 4:15:1447980.
doi: 10.3389/fimmu.2024.1447980. eCollection 2024.

Torque teno viruses exhaust and imprint the human immune system via the HLA-E/NKG2A axis

Affiliations

Torque teno viruses exhaust and imprint the human immune system via the HLA-E/NKG2A axis

Hannes Vietzen et al. Front Immunol. .

Abstract

The ubiquitous Torque teno virus (TTV) establishes a chronically persistent infection in the human host. TTV has not been associated with any apparent disease, but, as part of the human virome, it may confer a regulatory imprint on the human immune system with as yet unclear consequences. However, so far, only few studies have characterized the TTV-specific immune responses or the overall immunological imprints by TTV. Here, we reveal that TTV infection leads to a highly exhausted TTV-specific CD8+ T-cell response, hallmarked by decreased IFN-γ production and the expression of the inhibitory NKG2A-receptor. On a functional level, we identified a panel of highly polymorphic TTV-encoded peptides that lead to an expansion of regulatory NKG2A+ natural killer, NKG2A+CD4+, and NKG2A+CD8+ T cells via the stabilization of the non-classical HLA-E molecule. Our results thus demonstrate that TTV leads to a distinct imprint on the human immune system that may further regulate overall human immune responses in infectious, autoimmune, and malignant diseases.

Keywords: HLA-E; NKG2A; TTV; Torque teno virus; immune evasion; immune regulation.


Conflict of interest statement

The authors declare that the research was conducted in the absence of any commercial or financial relationships that could be construed as a potential conflict of interest.

Figures

Figure 1
Figure 1
Torque teno viruses elicit TTV-specific CD8+ T-cell responses: (A) the cord diagram shows the top 0.02% peptides of ORF1–4 predicted to bind to the 27 HLA alleles of the reference set. (B) Individual CD8+ T-cell responses are shown for one blood donor (BB001) to TTV ORF1–4 or HCMV peptide pools measured in ex vivo IFNγ ELISPOT assays with non-pre-expanded CD8+ T cells. (C–E) Individual CD8+ T-cell responses of one blood donor (BB001) to (C) TTV ORF1–4 or HCMV peptide pools, (D) TTV sub-pools (SP1–8) and (E) single TTV peptides measured with TTV or HCMV peptide pools pre-expanded CD8+ T cells and IFNγ ELISPOTs, respectively. (F) Heat map of CD8+ T-cell responses to HCMV or TTV ORF1 pools, sub-pools, and single peptides in four healthy blood donors (BD001–BD004) measured with pre-expanded CD8+ T cells and IFNγ ELISPOT. White: No TTV-specific CD8+ T-cell response detected. (G) Frequencies of TTV-specific CD8+ T cells in 240 healthy blood donors (BD005–249) were assessed by a tetramer pool that consisted of HLA-A*02:01, HLA-A*03:01, HLA-A*11:01, and HLA-A*24:02 tetramers, loaded with a peptide pool that consists of the TTV-derived LEYHGGLYS, IEGLPLWAA, KHTYRPYLF, CDLPLLTIF, and TLFHQKEVL peptides. Data are shown as the percentage of TTV-specific CD8+ T cells of total CD8+ T cells. The dashed line represents the maximum response of the non-peptide control. Each dot represents one individual blood donor. (H, I) Fine specificity of the TTV-specific CD8+ T cell response: (H) TTV-specific CD8+ T cells or non-TTV-specific CD8+ T cells from 240 healthy blood donors (BD005–249) were first stained with TTV peptide-loaded APC-conjugated HLA tetramers and then sorted and re-stained with a PE-tetramer pool that consists of HLA-A*02:01, HLA-A*03:01, HLA-A*11:01, and HLA-A*24:02 tetramers, loaded with either a peptide pool that consists of the TTV-derived LEYHGGLYS, IEGLPLWAA, KHTYRPYLF, CDLPLLTIF, and TLFHQKEVL peptides or a random nine amino acid peptide library. Data are shown as the percentage of tetramer-positive cells. (I) Total CD8+ T cells from 240 healthy blood donors (BD005–249) were pooled and stimulated with individual HLA-A*02:01, HLA-A*03:01, HLA-A*11:01, and HLA-A*24:02 tetramers, loaded with individual TTV-derived LEYHGGLYS, IEGLPLWAA, KHTYRPYLF, CDLPLLTIF, and TLFHQKEVL peptides. Heat map shows the p-value in comparison to the non-peptide control of 10 independent experiments, as assessed with the Kruskal–Wallis Test. Differences were assessed with the Kruskal–Wallis test in comparison to the (B–D, G, I) non-peptide control (Neg.Control) or (H) the random peptide control. HCMV, human cytomegalovirus; ORF, open-reading frame; PBMC, peripheral blood mononuclear cell; SP, sub-pool; TTV, Torque teno virus; ns, not significant.
Figure 2
Figure 2
The HLA-E-TTV-NKG2A axis exhaust TTV-specific immune responses: (A) box-plot shows the percentage of activated (IFNγ+Tetramer-APC+) cells to virus-specific (Tetramer-APC+) CD8+ T cells in N=120 healthy TTV-DNA-positive and HCMV-seropositive healthy blood donors (BD005-BD124) and 120 healthy TTV-DNA-positive and HCMV-seronegative healthy blood donors (BD125–BD249) in response to an HCMV- or TTV-derived peptide pool, respectively. TTV-specific CD8+ T-cell responses were assessed in N=120 healthy TTV-DNA-positive and HCMV-seropositive healthy blood donors (BD005–BD124) and 120 healthy TTV-DNA-positive and HCMV-seronegative healthy blood donors (BD125–BD249), while the HCMV-specific CD8+ T-cell responses were assessed in N=120 healthy TTV-DNA-positive and HCMV-seropositive healthy blood donors (BD005–BD124). The TTV peptide pool consists of the TTV-derived LEYHGGLYS, IEGLPLWAA, KHTYRPYLF, CDLPLLTIF, and TLFHQKEVL peptides. Each dot represents one individual blood donor. Groups were compared using the Mann–Whitney test. (B) CD8+ T-cell phenotype of total, HCMV-specific or TTV-specific CD8+ T cells, respectively. The phenotype of total and TTV-specific CD8+ T cells was assessed in N=120 healthy TTV-DNA-positive and HCMV-seropositive healthy blood donors (BD005–BD124) and 120 healthy TTV-DNA-positive and HCMV-seronegative healthy blood donors (BD125–BD249). The phenotype of HCMV-specific CD8+ T cells was assessed in N=120 healthy TTV-DNA-positive and HCMV-seropositive healthy blood donors (BD005–BD124). Each fraction represents the mean frequency of the LAG3 PD1+/− TGIT+/− TIM3 NKG2A, LAG3+ PD1+ TGIT+ TIM3 NKG2A and LAG3+ PD1+ TGIT+ TIM3+ NKG2A+ CD8+ T-cell subsets (± SD). Groups were compared using the two-way ANOVA. (C) HLA-E stabilization assay: RMA/S-HLA-E cells were incubated together with 300 µM of the HCMV-encoded VMAPRTLIL or the TTV-encoded TTDKFTLRI, SRPGRKHVV, MKYAFKWVW, LNDTPFYPW, SVNGSSQFF, or KIPLKAAQL peptides. The geometric mean of the HLE-E MFI was then assessed by flow cytometry. Box plot represents the mean (± SD) of five independent replicates. (D–F) NKG2A+ inhibition and proliferation assay: (D, E) K562-HLA-E*0103/0103 or (F) RMA/S-HLA-E cells were first incubated together with 300 µM of the HCMV-encoded VMAPRTLIL or the TTV-encoded TTDKFTLRI, SRPGRKHVV, MKYAFKWVW, LNDTPFYPW, SVNGSSQFF, or KIPLKAAQL peptides and then incubated together with pre-activated and enriched CD8+ T cells. The percentage of (D) CD107a+, (E) IFNγ+, or (F) proliferating (CFSElow) NKG2A+CD8+ T cells was assessed by flow cytometry. Plots represent the mean (± SD) of 240 independent biological replicates, reflecting N=120 healthy TTV-DNA-positive and HCMV-seropositive healthy blood donors (BD005–BD124) and 120 healthy TTV-DNA-positive and HCMV-seronegative healthy blood donors (BD125–BD249). Each dot represents one individual blood donor. Each peptide was compared to K562-HLA-E*0103/0103 cells without peptides using the Kruskal–Wallis test. HCMV, human cytomegalovirus; IFNγ, interferon γ; MFI, mean fluorescence intensity; TTV, Torque teno virus.
Figure 3
Figure 3
Distinct TTV-peptide variants elicit potent NKG2A+-mediated effector functions: NKG2A+ inhibition and proliferation assay: K562-HLA-E*0103/0103 or RMA/S-HLA-E cells were first incubated together with 300 µM of indicated TTV-encoded peptide variants ( Supplementary Table S2 ) and then incubated together with pre-activated and enriched CD8+ T cells, CD56+ NK cells, or CD4+ T cells. The percentage of cytotoxic CD107a+NKG2A+CD8+ T cells or CD107a+NKG2A+CD56+ NK cells, and IFNγ+NKG2A+CD8+ T cells, IFNγ+NKG2A+CD4+ T cells, or IFNγ+NKG2A+CD56+ NK cells, and proliferating (CFSElow) NKG2A+CD8+ T cells, NKG2A+CD4+ T cells, or NKG2A+CD56+ NK cells was assessed by flow cytometry. Heat map shows the p-value in comparison to the non-peptide control of 240 independent biological replicates, reflecting N=120 healthy TTV-DNA-positive and HCMV-seropositive healthy blood donors (BD005–BD124) and 120 healthy TTV-DNA-positive and HCMV-seronegative healthy blood donors (BD125–BD249). Peptides were numbered after NKG2A+ inhibition and proliferation assays according to the statistical difference in comparison to the non-peptide control. IFNγ, interferon γ.
Figure 4
Figure 4
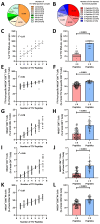
TTV-peptide variants imprint the human immune system: (A) number of TTV-DNA positive samples in healthy blood donors. Seven follow-up plasma samples from N=240 healthy TTV-DNA-positive healthy blood donors (BD005–BD249) were collected in 6-month (± 3.5 week) intervals. Fractions represent the relative frequency of TTV-DNA-positive samples. (B) Number of functional TTV peptides. TTV sequences of N=240 healthy TTV-DNA-positive healthy blood donors (BD005–BD249) were analyzed by next-generation sequencing and blasted against known TTV peptide variants ( Supplementary Table S2 ). Fractions represent the relative frequency of the number of functional TTV-derived peptides ( Figure 3 ). (C–L) The number of functional TTV-derived peptides in N=240 healthy blood donors was compared to (C, D) the frequency of TTV-DNA positive samples, (E, F) TTV-pool (LEYHGGLYS, IEGLPLWAA, KHTYRPYLF, CDLPLLTIF, and TLFHQKEVL)-specific NKG2A+CD8+ T cells, (G, H) total NKG2A+CD8+ T cells, (I, J) total NKG2A+CD4+ T cells, (K, L) total NKG2A+CD56+ NK cells. Associations were assessed by (C, E, G, I, K) linear regression. (D, F, H, J, L) Box plots: each dot represents one individual blood donor. Box plots represent the mean (± SD) of 240 independent biological replicates. Groups were compared using the Mann–Whitney test. TTV, Torque teno virus.

References

    1. Virgin HW, Wherry EJ, Ahmed R. Redefining chronic viral infection. Cell. (2009) 138:30–50. doi: 10.1016/j.cell.2009.06.036 - DOI - PubMed
    1. Varsani A, Opriessnig T, Celer V, Maggi F, Okamoto H, Blomström AL, et al. . Taxonomic update for mammalian anelloviruses (family Anelloviridae). Arch Virol. (2021) 166:2943–53. doi: 10.1007/s00705-021-05192-x - DOI - PubMed
    1. Walker PJ, Siddell SG, Lefkowitz EJ, Mushegian AR, Adriaenssens EM, Alfenas-Zerbini P, et al. . Recent changes to virus taxonomy ratified by the International Committee on Taxonomy of Viruses (2022). Arch Virol. (2022) 167:2429–40. doi: 10.1007/s00705-022-05516-5 - DOI - PMC - PubMed
    1. Kaczorowska J, van der Hoek L. Human anelloviruses: diverse, omnipresent and commensal members of the virome. FEMS Microbiol Rev. (2020) 44:305–13. doi: 10.1093/femsre/fuaa007 - DOI - PMC - PubMed
    1. Focosi D, Spezia PG, Macera L, Salvadori S, Navarro D, Lanza M, et al. . Assessment of prevalence and load of torquetenovirus viraemia in a large cohort of healthy blood donors. Clin Microbiol Infect. (2020) 26:1406–10. doi: 10.1016/j.cmi.2020.01.011 - DOI - PubMed

MeSH terms

Substances

LinkOut - more resources