

A clinical prognostic model related to T cells based on machine learning for predicting the prognosis and immune response of ovarian cancer
- PMID: 39296051
- PMCID: PMC11409031
- DOI: 10.1016/j.heliyon.2024.e36898
A clinical prognostic model related to T cells based on machine learning for predicting the prognosis and immune response of ovarian cancer
Abstract
Background: Ovarian cancer (OV) is regarded as one of the most lethal malignancies affecting the female reproductive system, with individuals diagnosed with OV often facing a dismal prognosis due to resistance to chemotherapy and the presence of an immunosuppressive environment. T cells serve as a crucial mediator for immune surveillance and cancer elimination. This study aims to analyze the mechanism of T cell-associated markers in OV and create a prognostic model for clinical use in enhancing outcomes for OV patients.
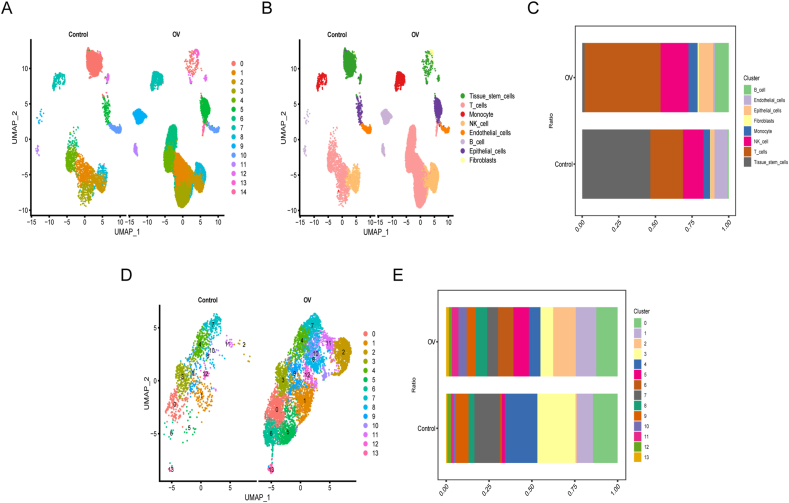
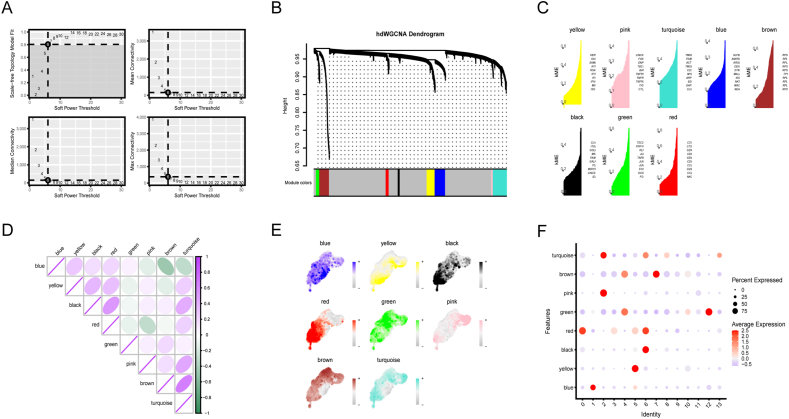
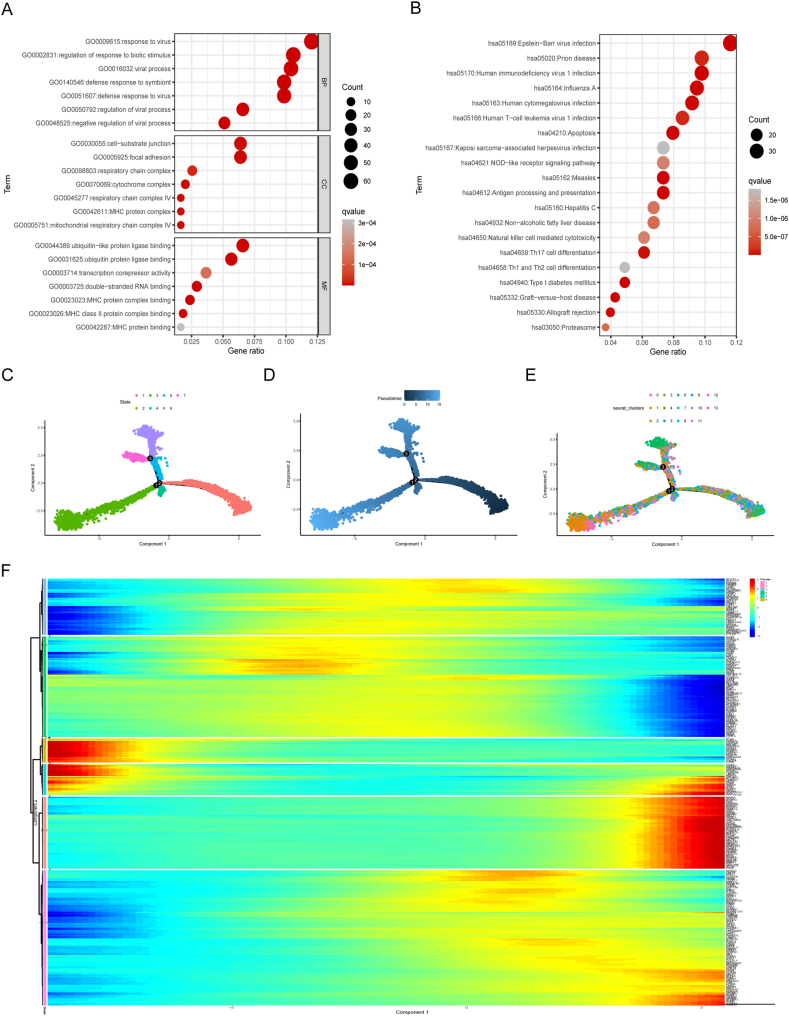
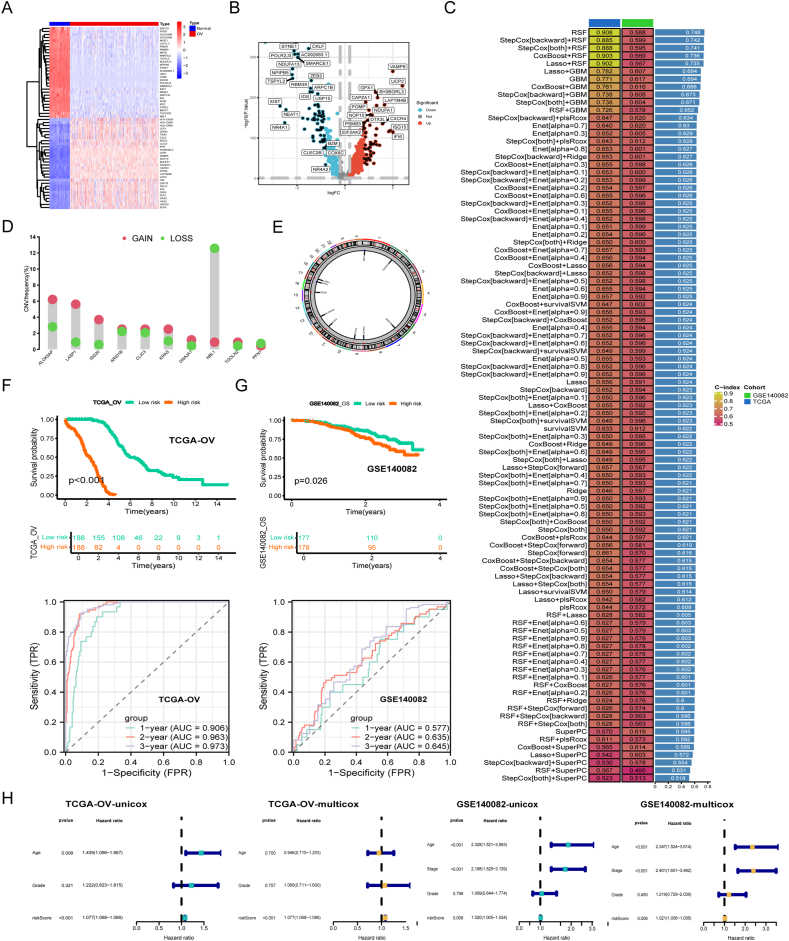
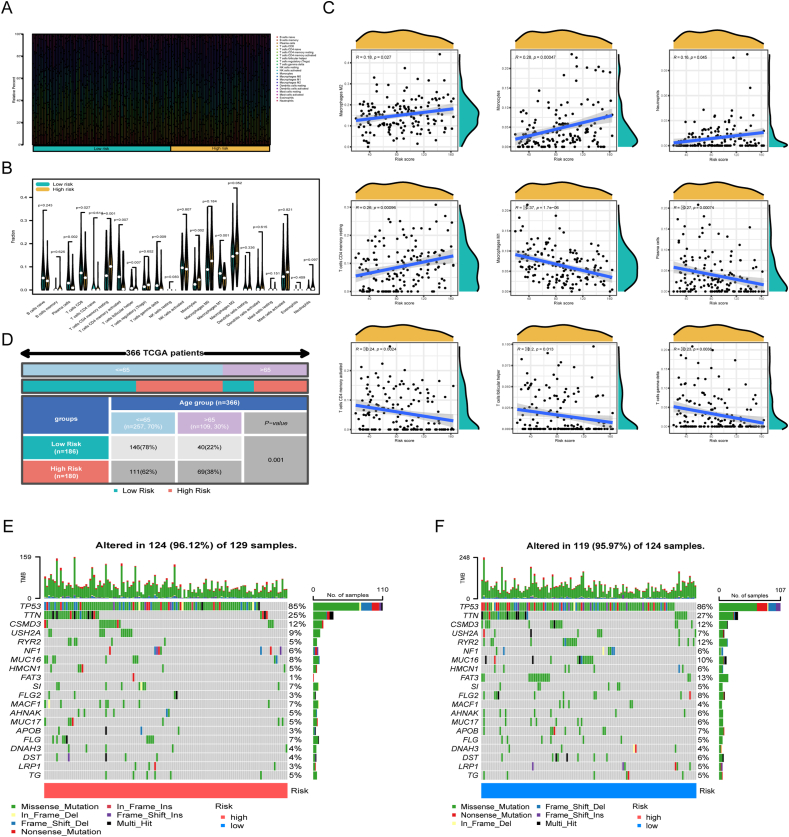
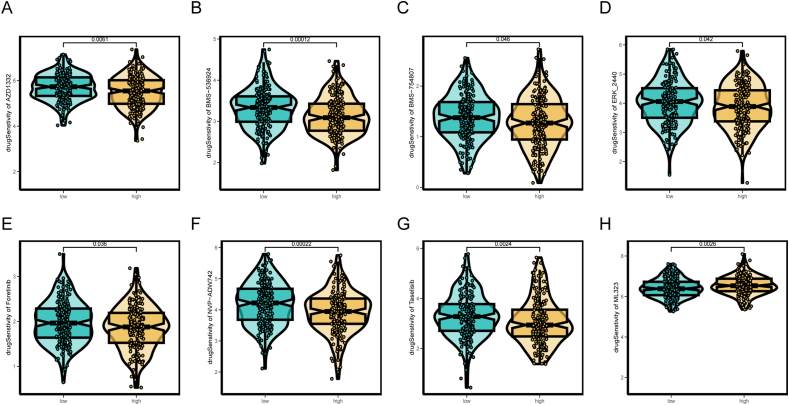
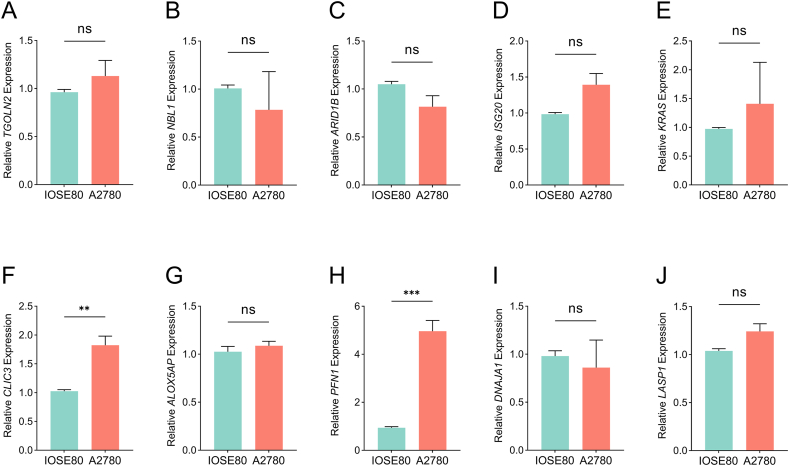
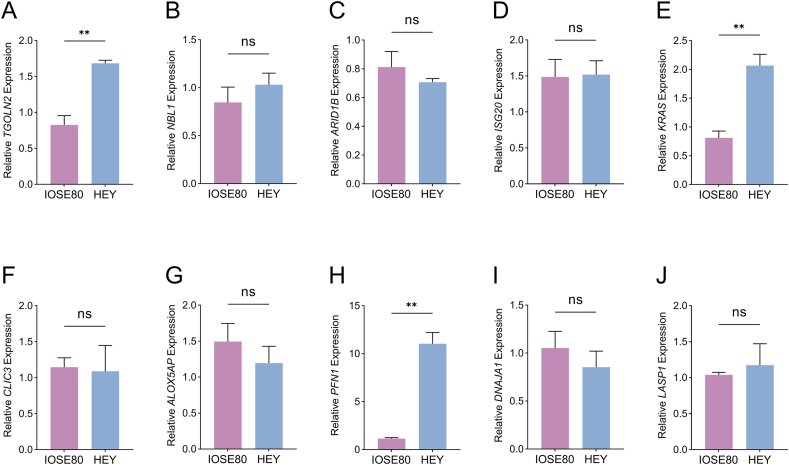
Methods: Based on the single-cell dataset GSE184880, this study used single-cell data analysis to identify characteristic T cell subsets. Analysis of high dimensional weighted gene co-expression network analysis (hdWGCNA) is utilized to identify crucial gene modules along with their corresponding hub genes. A grand total of 113 predictive models were formed utilizing ten distinct machine learning algorithms along with the combination of the cancer genome atlas (TCGA)-OV dataset and the GSE140082 dataset. The most dependable clinical prognostic model was created utilizing the leave one out cross validation (LOOCV) framework. The validation process for the models was achieved by conducting survival curve analysis and receiver operating characteristic (ROC) analysis. The relationship between risk scores and immune cells was explored through the utilization of the Cibersort algorithm. Additionally, an analysis of drug sensitivity was carried out to anticipate chemotherapy responses across various risk groups. The genes implicated in the model were authenticated utilizing qRT-PCR, cell viability experiments, and EdU assay.
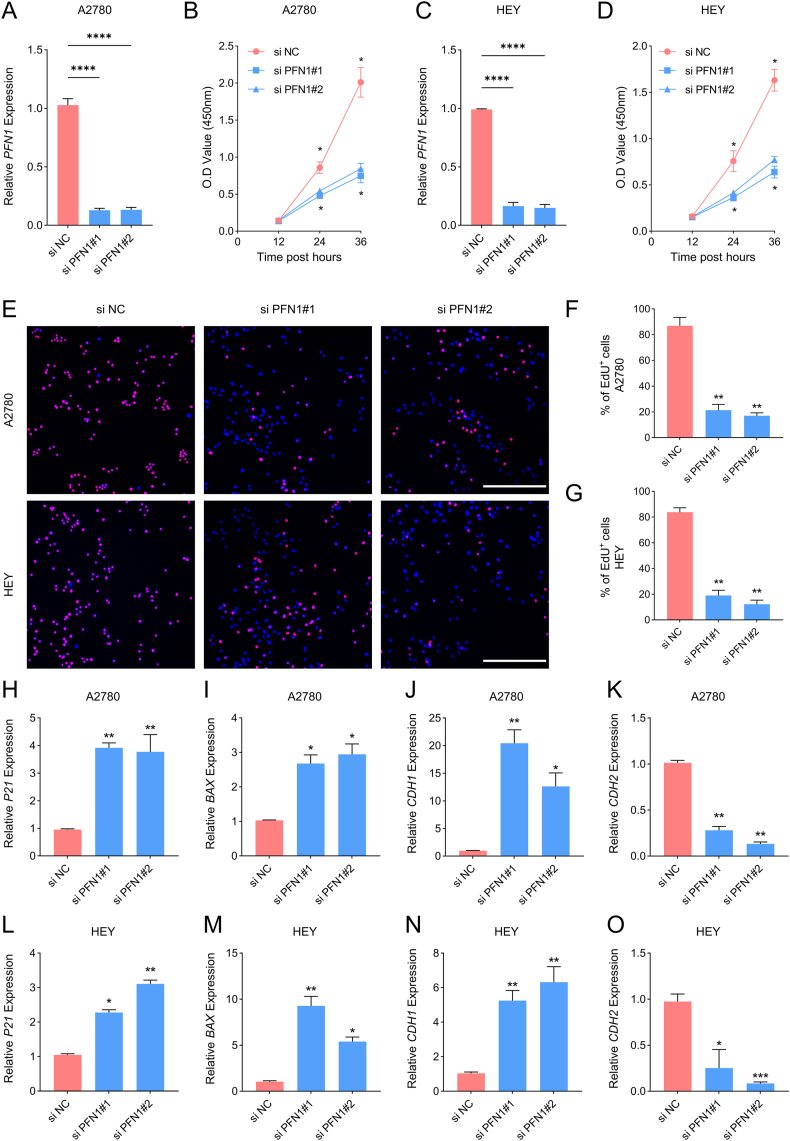
Results: This study developed a clinical prognostic model that includes ten risk genes. The results obtained from the training set of the study indicate that patients classified in the low-risk group experience a significant survival advantage compared to those in the high-risk group. The ROC analysis demonstrates that the model holds significant clinical utility. These results were verified using an independent dataset, strengthening the model's precision and dependability. The risk assessment provided by the model also serves as an independent prognostic factor for OV patients. The study also unveiled a noteworthy relationship between the risk scores calculated by the model and various immune cells, suggesting that the model may potentially serve as a valuable tool in forecasting responses to both immune therapy and chemotherapy in ovarian cancer patients. Notably, experimental evidence suggests that PFN1, one of the genes included in the model, is upregulated in human OV cell lines and has the capacity to promote cancer progression in in vitro models.
Conclusion: We have created an accurate and dependable clinical prognostic model for OV capable of predicting clinical outcomes and categorizing patients. This model effectively forecasts responses to both immune therapy and chemotherapy. By regulating the immune microenvironment and targeting the key gene PFN1, it may improve the prognosis for high-risk patients.
Keywords: Clinical prognostic model; Machine learning; Ovarian cancer; PFN1; Single-cell analysis.
© 2024 The Authors. Published by Elsevier Ltd.
Conflict of interest statement
The authors declare that they have no known competing financial interests or personal relationships that could have appeared to influence the work reported in this paper.
Figures
Similar articles
-
A clinical prognostic model of oxidative stress-related genes linked to tumor immune cell infiltration and the prognosis of ovarian cancer patients.Heliyon. 2024 Mar 21;10(7):e28442. doi: 10.1016/j.heliyon.2024.e28442. eCollection 2024 Apr 15. Heliyon. 2024. PMID: 38560253 Free PMC article.
-
A prognosis-predictive nomogram of ovarian cancer with two immune-related genes: CDC20B and PNPLA5.Oncol Lett. 2020 Nov;20(5):204. doi: 10.3892/ol.2020.12067. Epub 2020 Sep 8. Oncol Lett. 2020. PMID: 32963610 Free PMC article.
-
Construction of Ovarian Cancer Prognostic Model Based on the Investigation of Ferroptosis-Related lncRNA.Biomolecules. 2023 Feb 6;13(2):306. doi: 10.3390/biom13020306. Biomolecules. 2023. PMID: 36830675 Free PMC article.
-
A novel extrachromosomal circular DNA related genes signature for overall survival prediction in patients with ovarian cancer.BMC Med Genomics. 2023 Jun 19;16(1):140. doi: 10.1186/s12920-023-01576-x. BMC Med Genomics. 2023. PMID: 37337170 Free PMC article.
-
Therapeutic Benefits and Prognostic Value of a Model Based on 7 Immune-associated Genes in Bladder Cancer.Altern Ther Health Med. 2024 Apr;30(4):130-138. Altern Ther Health Med. 2024. PMID: 38518167
Cited by
-
Multi-Omics analysis and in vitro validation reveal diagnostic and therapeutic roles of novel hub genes in ovarian cancer.Hereditas. 2025 Aug 18;162(1):166. doi: 10.1186/s41065-025-00535-z. Hereditas. 2025. PMID: 40826138 Free PMC article.
-
Mechanistic Insights Into the Tumor-Driving and Diagnostic Roles of KCTD Family Genes in Ovarian Cancer: An Integrated In Silico and In Vitro Analysis.Cancer Med. 2025 Aug;14(16):e71147. doi: 10.1002/cam4.71147. Cancer Med. 2025. PMID: 40832836 Free PMC article.
-
Understanding Cancer Risk Among Bangladeshi Women: An Explainable Machine Learning Approach to Socio-Reproductive Factors Using Tertiary Hospital Data.Healthcare (Basel). 2025 Jun 15;13(12):1432. doi: 10.3390/healthcare13121432. Healthcare (Basel). 2025. PMID: 40565458 Free PMC article.
-
Comparing the Effectiveness of Artificial Intelligence Models in Predicting Ovarian Cancer Survival: A Systematic Review.Cancer Rep (Hoboken). 2025 Mar;8(3):e70138. doi: 10.1002/cnr2.70138. Cancer Rep (Hoboken). 2025. PMID: 40103563 Free PMC article.
References
-
- Konstantinopoulos P.A., Matulonis U.A. Clinical and translational advances in ovarian cancer therapy. Nature cancer. 2023;4(9):1239–1257. - PubMed
-
- Ebell M.H., Culp M.B., Radke T.J. A systematic review of symptoms for the diagnosis of ovarian cancer. Am. J. Prev. Med. 2016;50(3):384–394. - PubMed
-
- Bray F., Ferlay J., Soerjomataram I., Siegel R.L., Torre L.A., Jemal A. Global cancer statistics 2018: GLOBOCAN estimates of incidence and mortality worldwide for 36 cancers in 185 countries. CA A Cancer J. Clin. 2018;68(6):394–424. - PubMed
LinkOut - more resources
Full Text Sources
Miscellaneous
