. 2024 Aug 19;7(9):2621-2636.
doi: 10.1021/acsptsci.3c00356. eCollection 2024 Sep 13.

Withaferin A Ameliorated the Bone Marrow Fat Content in Obese Male Mice by Favoring Osteogenesis in Bone Marrow Mesenchymal Stem Cells and Preserving the Bone Mineral Density

Affiliations

Withaferin A Ameliorated the Bone Marrow Fat Content in Obese Male Mice by Favoring Osteogenesis in Bone Marrow Mesenchymal Stem Cells and Preserving the Bone Mineral Density

Ashish Kumar Tripathi et al. ACS Pharmacol Transl Sci. .

Abstract

Obesity and osteoporosis are two prevalent conditions that are becoming increasingly common worldwide, primarily due to aging populations, imbalanced energy intake, and sedentary lifestyles. Obesity, characterized by excessive fat accumulation, and osteoporosis, marked by reduced bone density and increased fracture risk, are often interconnected. High-fat diets (HFDs) can exacerbate both conditions by promoting bone marrow adiposity and bone loss. The effect of WFA on the osteogenesis and adipogenesis was studied on the C3H10T1/2 cell line and bone marrow mesenchymal stem cells (BM-MSCs) isolated from mice. We used oil red O and alkaline phosphatase (ALP) staining to observe adipogenesis and osteogenesis, respectively, in MSCs. Real-time PCR and Western blot analyses were used to study the molecular effects of WFA on MSCs. We employed micro-CT to analyze the bone microarchitecture, bone mineral density (BMD), and abdominal fat mass in male mice. We have used osmium tetroxide (OsO4) staining to study the bone marrow fat. WFA induced the C3H10T1/2 cell line and BM-MSCs toward osteogenic lineage as evidenced by the higher ALP activity. WFA also downregulated the lipid droplet formation and adipocyte specific genes in MSCs. In the in vivo study, WFA also suppressed the bone catabolic effects of the HFD and maintained the bone microarchitecture and BMD in WFA-treated animals. The bone marrow adipose tissue was reduced in the tibia of WFA-treated groups in comparison with only HFD-fed animals. Withaferin A was able to improve the bone microarchitecture and BMD by committing BM-MSCs toward osteogenic differentiation and reducing marrow adiposity. The findings of this study could provide valuable insights into the therapeutic potential of Withaferin A for combating bone marrow obesity and osteoporosis, particularly in the context of diet-induced metabolic disturbances.


Conflict of interest statement

The authors declare no competing financial interest.

Figures
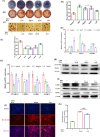
Figure 1
Figure 1
WFA inhibits adipogenesis and induced osteogenesis in vitro. (A) ALP staining of C3H10T1/2 cells after 21 days of treatment. WFA increased ALP activity from 1 pM to 1 μM concentration. (B) Photographs and (D) quantification of mineralization. WFA also increased mineralization from 1 pM to 10 nM concentration. (C,E) WFA inhibited lipid droplet formation in C3H10T1/2 cells after 7 days at 1 pM to 10 nM concentrations of WFA. (F) WFA increased Osx, RUNX2, and Wnt10b gene expression. (G)WFA also inhibited PPARγ, CEBPα, CEBPδ, and FABP4 gene expression. Protein expression of (H) β-catenin and RUNX2 increased by WFA at a 1 pM concentration. Protein expression of (I) CEBPα, FABP4, and PPARγ downregulated by WFA at a 1 pM concentration. (J) WFA enhanced the expression of β-catenin as reflected by an increased intensity of Alexa Fluor 594. (K) Quantification β-catenin in each group. For statistical significance, one-way ANOVA was used followed by Newman–Keuls multiple comparison tests, *p < 0.05, **p < 0.01, and ***p < 0.001 versus control. Error bars represent means ± SEM.
Figure 2
Figure 2
Mean value concentration–time profile of WFA in rat plasma at 5 and 10 mg/kg single oral doses. The error bars indicate the corresponding standard deviation n = 3.
Figure 3
Figure 3
WFA increased osteogenesis and inhibited adipogenesis ex vivo. (A) ALP staining of BM-MSCs after 21 days of osteogenic treatment. WFA increased ALP activity at both doses, which were suppressed in HFD animals. (B,D) WFA also increased mineralization at both doses of 5 and 10 mg kg–1. (C,E) WFA reduced lipid droplet formation as shown in the oil red O staining of WFA-treated groups in comparison to HFD animals. WFA downregulated (F) PPARγ and (G) WFA increased expression of OSX mRNA at 5 mg kg–1. For statistical significance, one-way ANOVA was used followed by Newman–Keuls multiple comparison tests, #p < 0.05, ##p < 0.01, and ###p < 0.001 versus control and *p < 0.05, **p < 0.01, and ***p < 0.001 versus HFD.
Figure 4
Figure 4
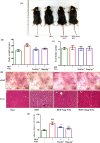
WFA improved obesity-associated parameters. (A) Representative macroscopic pictures of animals from different groups. (B) HFD increased the body weight at the end of the experiment. WFA reduced the body weight in treated groups (C) Food intake profile of the studied group (gram/mice/day). (D) Hematoxylin and eosin staining of the epididymal fat and liver. HFD increased the fat tissue size and ballooning of hepatocytes. WFA improved the fat and liver tissue morphology (E) Estimation of the adipocyte diameter in each group For statistical significance, one-way ANOVA was used followed by Newman–Keuls multiple comparison tests, #p < 0.05, ##p < 0.01, and ###p < 0.001 versus control and *p < 0.05, **p < 0.01, and ***p < 0.001 versus HFD.
Figure 5
Figure 5
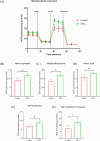
WFA increased the mitochondrial respiration. (A) Line graph indicating the oxygen consumption rate (OCR) at different time points with specific inhibitors. (B) Basal respiration. (C) Maximal respiration. (D) Proton leak. (E) ATP production. (F) Spare respiratory capacity. For statistical significance, one-way ANOVA was used followed by Newman–Keuls multiple comparison tests, #p < 0.05, ##p < 0.01, and ###p < 0.001 versus control and *p < 0.05, **p < 0.01, ***p < 0.001 versus HFD.
Figure 6
Figure 6
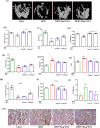
WFA reduced abdominal obesity in mice. (A) The upper panel shows micro-CT 2D images of the abdominal area of mice in the coronal plane. Yellow arrows point to the visceral fat, and green arrows point to the subcutaneous fat. The middle panel shows micro-CT 2D images of the abdominal area of mice in the transaxial plane. The lower panel shows a 3D reconstruction image of fat (pink) and bone (blue) in the abdominal area of mice. (B) Total fat volume and (C) adipose tissue volume/tissue volume (AV/TV) quantified. WFA reduced the abdominal fat in treated groups. For statistical significance, one-way ANOVA was used followed by Newman–Keuls multiple comparison tests, #p < 0.05, ##p < 0.01, and ###p < 0.001 versus control and *p < 0.05, **p < 0.01, and ***p < 0.001 versus HFD.
Figure 7
Figure 7
WFA reduced bone marrow adiposity. (A) OsO4-stained bone marrow fat was scanned with micro-CT. The yellow portion represents bone marrow fat. (C) Quantification of bone marrow fat with micro-CT. WFA reduced bone marrow adiposity in treated groups. (B) Adipocytes (black arrows) were increased in HFD animals. Treatment with WFA reduced the adipocytes in the bone marrow. (D) The diameter of adipocytes in the bone marrow was measured in H&E-stained sections. For statistical significance, one-way ANOVA was used followed by Newman–Keuls multiple comparison tests, #p < 0.05, ##p < 0.01, and ###p < 0.001 versus control and *p < 0.05, **p < 0.01, and ***p < 0.001 versus HFD.
Figure 8
Figure 8
WFA improved the bone microarchitecture. (A) 3D model of the distal femur trabecular region. WFA improved the bone microarchitecture in treated groups. (B) BMD, (C) BV/TV, (D) Tb.Th, and (E) Tb.N were reduced in HFD animals. Treatment with WFA increased these bone parameters. (F) Trabecular separation (Tb.Sp) and (G) SMI were increased in the HFD group, and administration of WFA reduced them. (H) OCN was estimated by an ELISA kit. WFA restored the OCN level at a 5 mg kg–1 dose. (I) CTX-I was higher in HFD animals, and administration of WFA improved it at both doses. (J) Quantitative assessment of the number of osteoclasts by bone surfaces (Oc.N/BS) as quantified by Image Pro software. (K) TRAP staining (red color) indicated by yellow arrows was high in HFD animals and decreased by WFA dosing. For statistical significance, one-way ANOVA was used followed by Newman–Keuls multiple comparison tests, #p < 0.05, ##p < 0.01, and ###p < 0.001 versus control and *p < 0.05, **p < 0.01, and ***p < 0.001 versus HFD. High-fat diet suppressed Wnt/β-catenin signaling.
Figure 9
Figure 9
WFA enhanced Wnt/β-catenin signaling. (A) WFA treatment decreased the SOST level in bone at both doses. (B) WFA also increased the Wnt10b expression level in treated animals. (C) HFD inhibited Wnt/β-catenin signaling. There is a lower expression of β-catenin as seen by a lower amount of red signal in the immunofluorescence image of the HFD group. WFA treatment rescued β-catenin expression at both doses. (D) Quantification of β-catenin expression in each group. For statistical significance, one-way ANOVA was used followed by Newman–Keuls multiple comparison tests, #p < 0.05, ##p < 0.01, and ###p < 0.001 versus control and *p < 0.05, **p < 0.01, and ***p < 0.001 versus HFD.

References

    1. González-Muniesa P.; Mártinez-González M.-A.; Hu F. B.; Després J.-P.; Matsuzawa Y.; Loos R. J. F.; Moreno L. A.; Bray G. A.; Martinez J. A. Obesity (Primer). Nat. Rev. Dis. Primers 2017, 3, 17034. 10.1038/nrdp.2017.34. - DOI - PubMed
    1. Gyllenhammer L. E.; Alderete T. L.; Toledo-Corral C. M.; Weigensberg M.; Goran M. I. Saturation of Subcutaneous Adipose Tissue Expansion and Accumulation of Ectopic Fat Associated with Metabolic Dysfunction during Late and Post-Pubertal Growth. Int. J. Obes (Lond) 2016, 40 (4), 601–606. 10.1038/ijo.2015.207. - DOI - PMC - PubMed
    1. Gonnelli S.; Caffarelli C.; Nuti R. Obesity and Fracture Risk. Clin. Cases Miner Bone Metab. 2014, 11 (1), 9–14. 10.11138/ccmbm/2014.11.1.009. - DOI - PMC - PubMed
    1. Kranioti E. F.; Bonicelli A.; García-Donas J. G. Bone-Mineral Density: Clinical Significance, Methods of Quantification and Forensic Applications. Res. Rep. Forensic Med. Sci. 2019, 9, 9–21. 10.2147/RRFMS.S164933. - DOI
    1. Griffith J. F.; Yeung D. K. W.; Antonio G. E.; Lee F. K. H.; Hong A. W. L.; Wong S. Y. S.; Lau E. M. C.; Leung P. C. Vertebral Bone Mineral Density, Marrow Perfusion, and Fat Content in Healthy Men and Men with Osteoporosis: Dynamic Contrast-Enhanced MR Imaging and MR Spectroscopy. Radiology 2005, 236 (3), 945–951. 10.1148/radiol.2363041425. - DOI - PubMed

LinkOut - more resources