

Lung water density is increased in patients at risk of heart failure and is largely independent of conventional cardiovascular magnetic resonance measures
- PMID: 39296919
- PMCID: PMC11408878
- DOI: 10.1093/ehjimp/qyae089
Lung water density is increased in patients at risk of heart failure and is largely independent of conventional cardiovascular magnetic resonance measures
Abstract
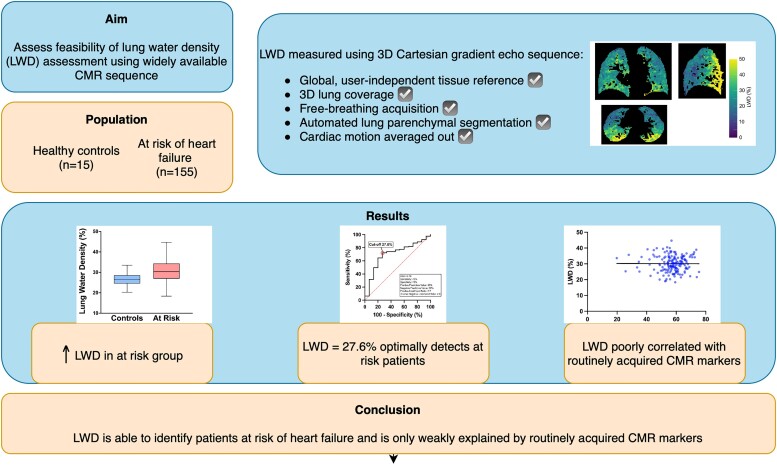
Aims: Non-invasive methods to quantify pulmonary congestion are lacking in clinical practice. Cardiovascular magnetic resonance (CMR) lung water density (LWD) mapping is accurate and reproducible and has prognostic value. However, it is not known whether LWD is associated with routinely acquired CMR parameters.
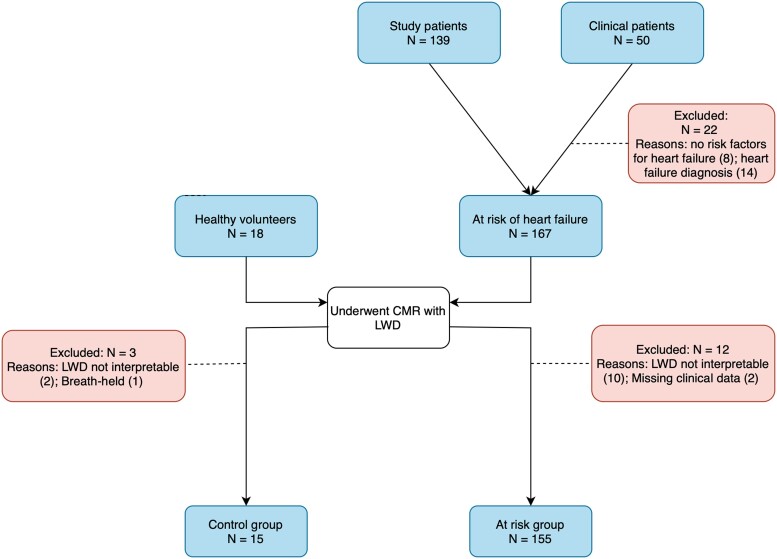
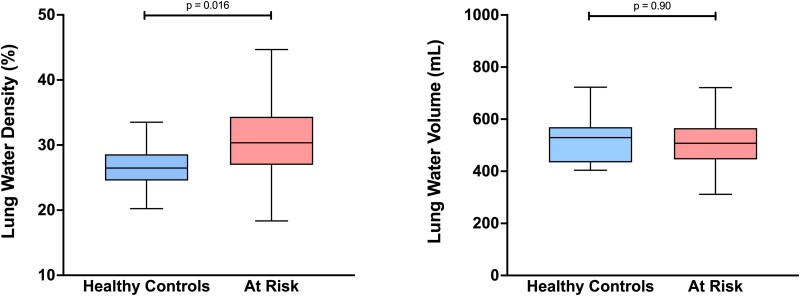
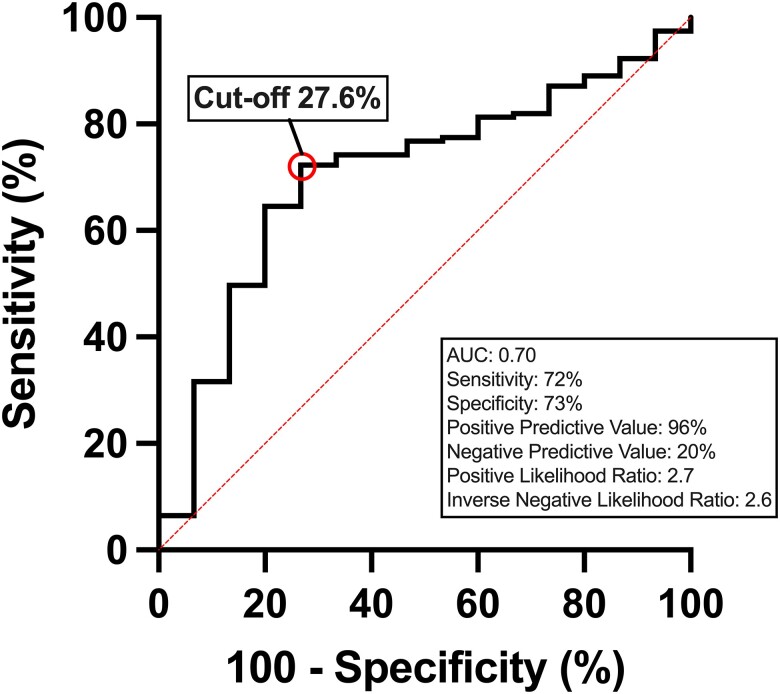
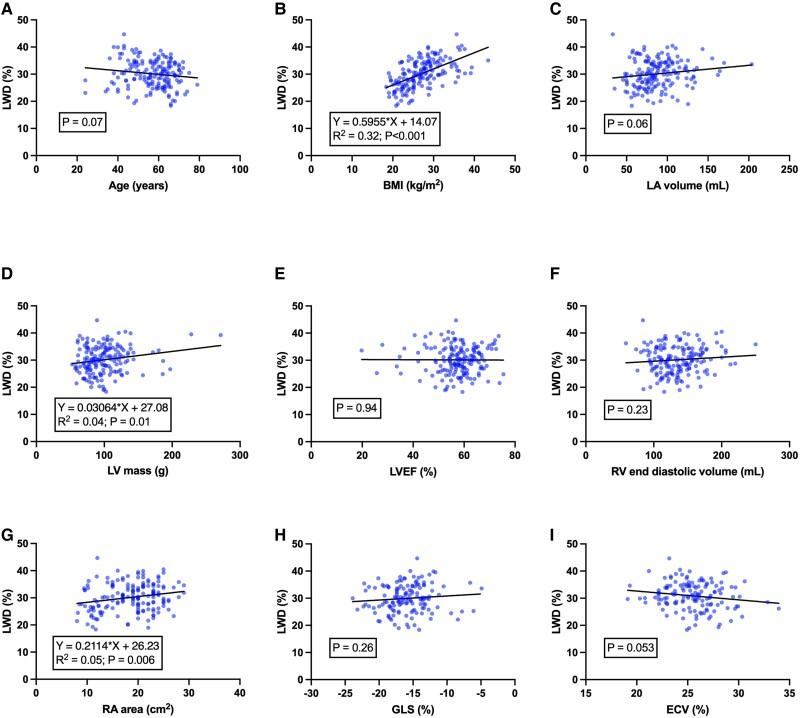
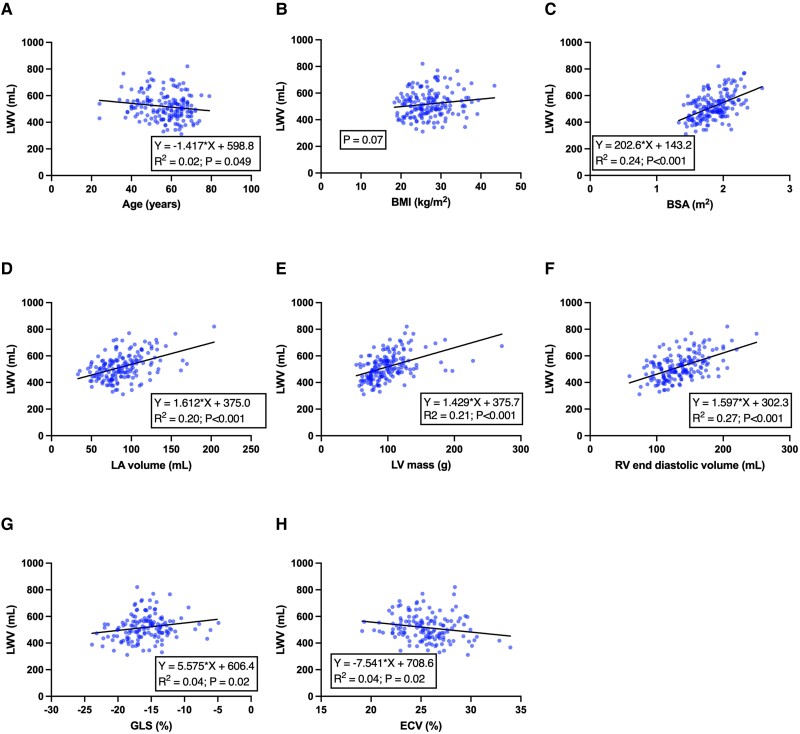
Methods and results: This was an observational cohort including healthy controls and patients at risk of heart failure. LWD was measured using CMR with a free-breathing short echo time 3D Cartesian gradient-echo sequence with a respiratory navigator at 1.5 T. Associations were assessed between LWD, lung water volume and cardiac volumes, left ventricular (LV) mass and function, myocardial native T1, and extracellular volume fraction. In patients at risk for heart failure (n = 155), LWD was greater than in healthy controls (n = 15) (30.4 ± 5.0 vs. 27.2 ± 4.3%, P = 0.02). Using receiver operating characteristic analysis, the optimal cut-off for LWD was 27.6% to detect at-risk patients (sensitivity 72%, specificity 73%, positive likelihood ratio 2.7, and inverse negative likelihood ratio 2.6). LWD was univariably associated with body mass index (BMI), hypertension, right atrial area, and LV mass. In multivariable linear regression, only BMI remained associated with LWD (R 2 = 0.32, P < 0.001).
Conclusion: LWD is increased in patients at risk for heart failure compared with controls and is only weakly explained by conventional CMR measures. LWD provides diagnostic information that is largely independent of conventional CMR measures.
© The Author(s) 2024. Published by Oxford University Press on behalf of the European Society of Cardiology.
Conflict of interest statement
Conflict of interest: M.U. is a principal investigator for an institutional research and development agreement regarding CMR imaging between Karolinska University Hospital and Siemens. All other authors have reported that they have no relationships relevant to the contents of this paper to disclose.
Figures
References
-
- Lindow T, Quadrelli S, Ugander M. Noninvasive imaging methods for quantification of pulmonary edema and congestion: a systematic review. JACC Cardiovasc Imaging 2023;16:1469–84. - PubMed
-
- Meadus WQ, Stobbe RW, Grenier JG, Beaulieu C, Thompson RB. Quantification of lung water density with UTE Yarnball MRI. Magn Reson Med 2021;86:1330–44. - PubMed
-
- Roguin A, Behar D, Ben Ami H, Reisner SA, Edelstein S, Linn S, et al. Long-term prognosis of acute pulmonary oedema—an ominous outcome. Eur J Heart Fail 2000;2:137–44. - PubMed
-
- Cutillo AG. The clinical assessment of lung water. Chest 1987;92:319–25. - PubMed
LinkOut - more resources
Full Text Sources