. 2024 Jul 31;9(8):1005-1022.
doi: 10.1016/j.jacbts.2024.04.007. eCollection 2024 Aug.

A New Ex Vivo Model to Study Cardiac Fibrosis in Whole Mouse Hearts

Affiliations

A New Ex Vivo Model to Study Cardiac Fibrosis in Whole Mouse Hearts

Boudewijn P T Kruithof et al. JACC Basic Transl Sci. .

Abstract

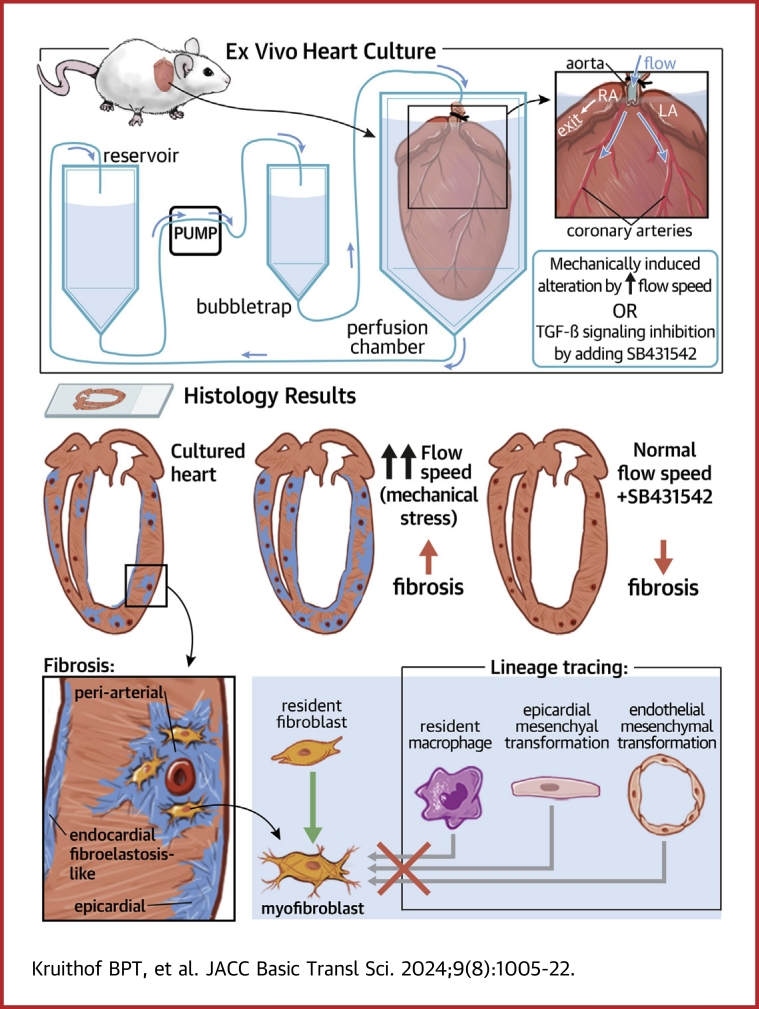
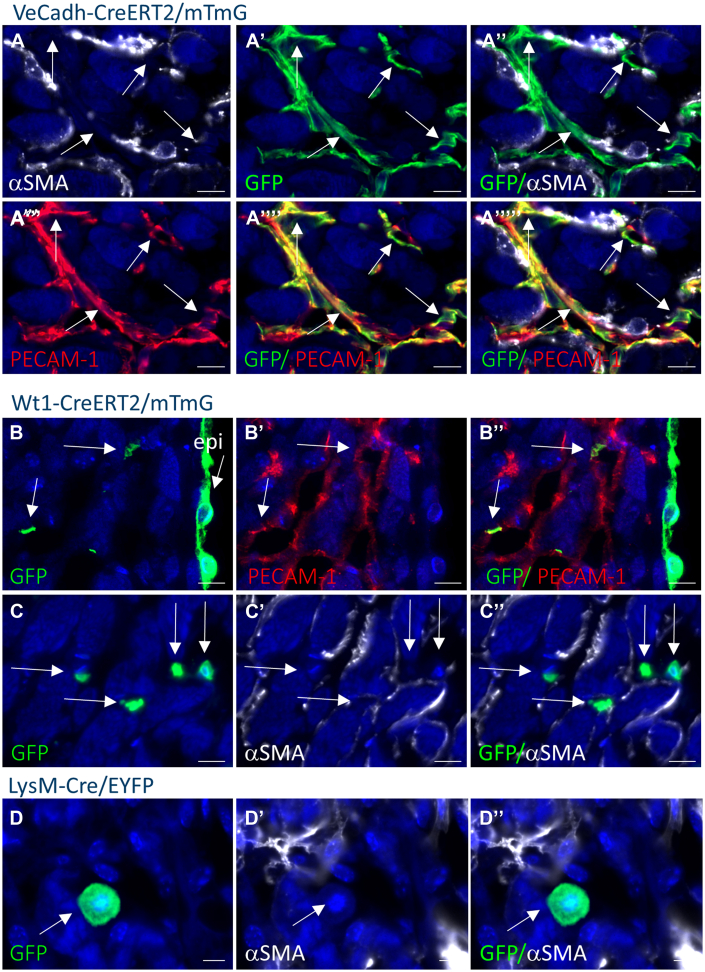
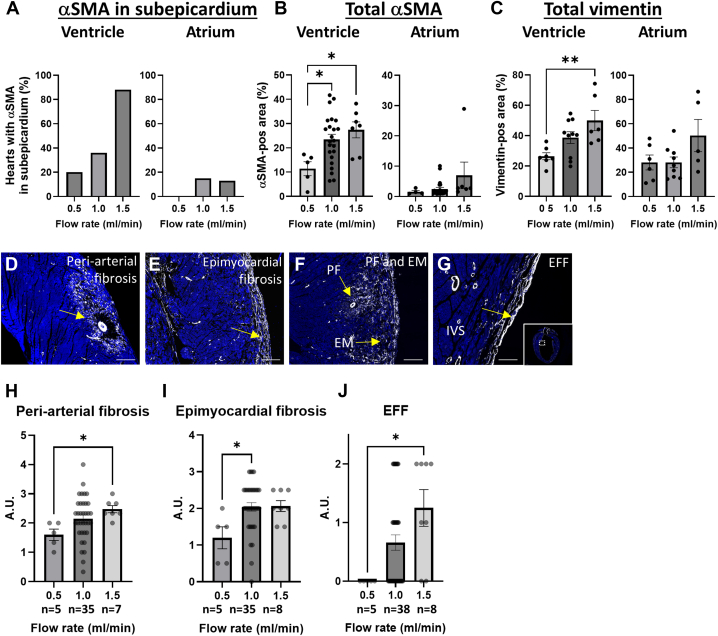
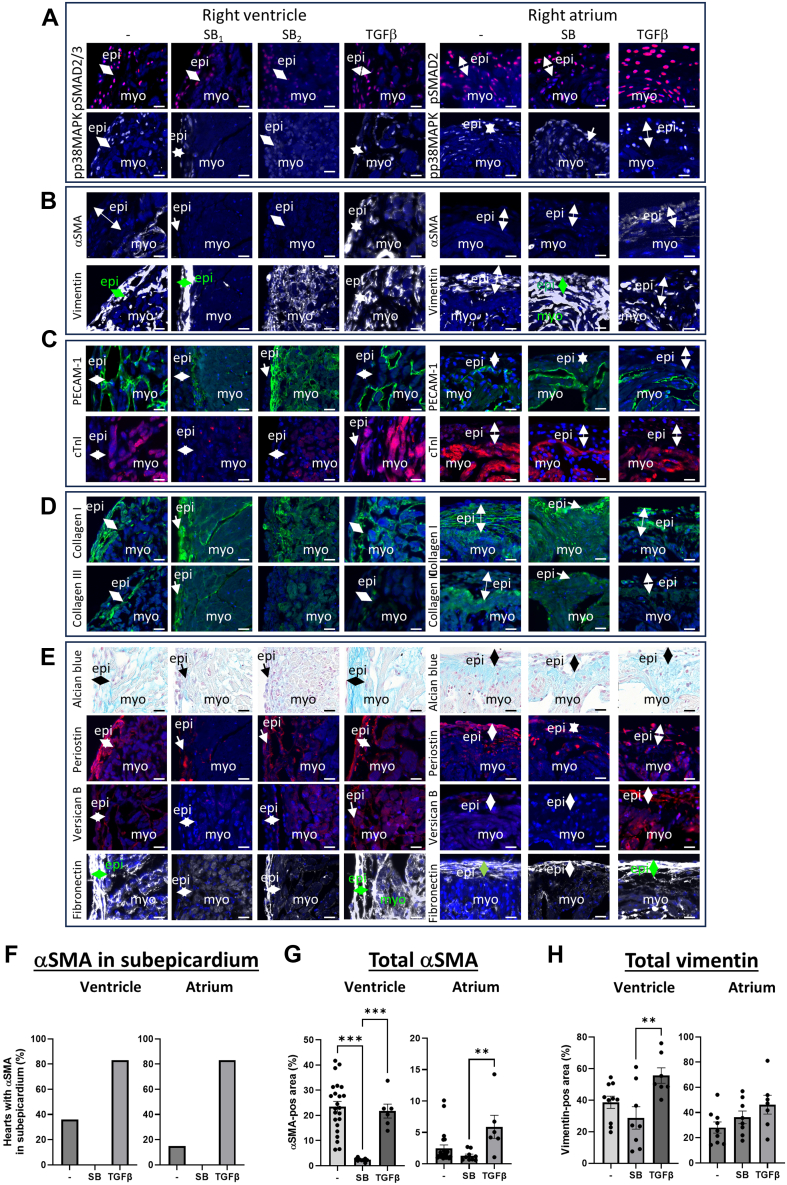
Fibrosis is a characteristic of many cardiac diseases for which no effective treatment exists. We have developed an ex vivo flow system, which allows induction of cardiac fibrosis in intact adult mouse hearts. Lineage-tracing studies indicated that the collagen-producing myofibroblasts originated from the resident fibroblasts. The extent of fibrosis was flow rate dependent, and pharmacological inhibition of the transforming growth factor beta signaling pathway prevented fibrosis. Therefore, in this powerful system, the cellular and molecular mechanisms underlying cardiac fibrosis can be studied. In addition, new targets can be tested on organ level for their ability to inhibit fibrosis.

Keywords: MTCS; TGFbeta; flow model; mechanical environment; preclinical translational.


Conflict of interest statement

This project has received funding form the Ministry of Economic Affairs under TKI-Allowance under the TKI-programme Life Sciences & Health and the Dutch Heart Foundation / Hartstichting. The authors have reported that they have no relationships relevant to the contents of this paper to disclose.

Figures

None
Graphical abstract
Figure 1
Figure 1
Cell Dynamics in Ex Vivo Cultured Hearts Representative pictures of noncultured mouse hearts and hearts cultured for 1 or 2 weeks stained for α-smooth muscle actin (SMA) (A), vimentin (B), PECAM-1 (C), and cardiac troponin-I (D). Boxed areas in A are shown at higher magnification in a’, a’’ ,b’, b’’, c’, c’’. (E) Graphs depicting the percentage of hearts with α-SMA-expression in the subepicardium of the ventricle and atrium after culture for 0, 7, or 14 days. (F and G) Graphs depicting the relative α-SMA-positive area (F) and the relative vimentin-positive area (G) in the ventricular or atrial myocardium of hearts cultured for 0, 7, or 14 days. (H) Graphs depicting the relative contribution of the cardiomyocytes (blue), endothelial cells (EC) (orange), and (myo)fibroblast (gray) in the ventricular or atrial myocardium of hearts cultured for 0 (n = 6), 1 (n = 2), 2 (n = 2), 3 (n = 3), 4 (n = 2), 5 (n = 3), and 7 days (n = 11). (I) Graphs depicting the proliferating cell nuclear antigen (PCNA)- and terminal deoxynucleotidyl transferase dUTP nick end labelling (TUNEL)-positive (myo)fibroblasts and EC in the ventricle and atrium of hearts cultured for 7 days. (J to M) Representative pictures of hearts cultured for 7 days stained for PCNA and PECAM-1 (J), PCNA and α-SMA (K), or PCNA (L,M). 4',6-diamidino-2-phenylindole (DAPI) is used as counterstain in all pictures. Data are presented as means ± SEM. To evaluate significant differences 1-way analysis of variance followed by Tukey’s multiple comparisons test was performed for graphs (F [ventricle] and G). 1-way analysis of variance followed by Šidák’s multiple comparisons test was performed for graphs (F [atrium] and I). ∗P < 0.05, ∗∗P < 0.01, ∗∗∗P < 0.001. Scale bar A: 1,000 μm; a’ to c’, a’’ to c’’, and B to D: 50 μm; and J to M: 20 μm. Epi = epicardium; LA = left atrium; LV = left ventricle; myo = myocardium; RA = right atrium; RV = right ventricle.
Figure 2
Figure 2
Collagen Fiber Dynamics in Ex Vivo Cultured Hearts Representative polarized light microscopy pictures of collagen fibers in the noncultured mouse hearts (A to D) and hearts cultured for 1 week (E and F) or 2 weeks (I to L). Boxed areas in A to L are shown at higher magnification in A’ to L’, A”, B”, E”, F”, I”, J”, A’”, E”’, and I’”. DAPI is used as counterstain. Green: thin collagen fibers; orange thick collagen fibers. (M) Representative pictures of noncultured mouse hearts and hearts cultured for 1 or 2 weeks stained for MMP-2. Scale bar A to L: 100 μm; M: 20 μm. C. artery = coronary artery; other abbreviations as in Figure 1.
Figure 3
Figure 3
Extracellular Matrix Dynamics in Ex Vivo Cultured Hearts Representative pictures of the right ventricle, right atrium, and coronary arteries in noncultured mouse hearts and hearts cultured for 1 or 2 weeks stained for collagen I, collagen III (A), alcian blue, periostin, versican B, and fibronectin (B). DAPI is used as counterstain in all fluorescent pictures. Scalebar: 20 μm. Abbreviations as in Figure 1.
Figure 4
Figure 4
Collagen-Expressing Cells in the Myocardium and Subepicardium of Ex Vivo Cultured Hearts (A) Costaining of collagen I, α-SMA, and PECAM-1 in the ventricular myocardium of a mouse heart cultured ex vivo for 1 week. α-SMA-expressing cells (white arrows) display cytoplasmic collagen expression. Endothelial cells (green arrows) and cardiomyocytes (cm) do not show cytoplasmic collagen expression. (B) Costaining of collagen I and α-SMA in subepicardial region of a mouse heart cultured ex vivo for 1 week displaying collagen I-positive/α-SMA-negative cells in the epicardial layer. DAPI is used as counterstain in all pictures. Scale bar: 20 μm. Abbreviations as in Figure 1.
Figure 5
Figure 5
Origin of Myofibroblasts in the Myocardium of Ex Vivo Cultured Hearts Representative pictures of α-SMA and green fluorescent protein (GFP) costaining with or without PECAM-1 costaining. GFP represents the expression of the reporter in the VeCadh-CreERT2/mTmG (A), Wilms’ tumor-1 (Wt1)-CreERT2/mTmG (B and C), and LysM-Cre/enhanced yellow fluorescent protein (EYFP) (D) mice. All GFP-positive cells in the VeCadh-CreERT2/mTmG mouse hearts are positive for PECAM-1 and not for α-SMA (arrows in A). GFP-positive cells in the myocardial layer of Wt1-CreERT2/mTmG mouse hearts are not α-SMA-positive, but mostly PECAM-1 positive (arrows in B and C). GFP staining in LysM-Cre/EYFP mouse hearts does not overlap with α-SMA staining (arrows in D). DAPI is used as counterstain in all pictures. Scale bar: 10 μm. Abbreviations as in Figure 1.
Figure 6
Figure 6
Mechanical Regulation of Fibrosis in Ex Vivo Cultured Hearts (A) Graphs depicting the percentage of hearts with α-SMA expression in the subepicardium of the ventricle and atrium after culture for 7 days with a flow rate of 0.5, 1.0, and 1.5 mL/min. (B and C) Graphs depicting the relative α-SMA-positive area (B) and the relative vimentin-positive area (C) in the ventricular or atrial myocardium of hearts cultured for 7 days with a flow rate of 0.5, 1.0, and 1.5 mL/min. Representative pictures of α-SMA staining on hearts cultured for 7 days indicating the locations of the periarterial fibrosis (PF) (D and F), the epimyocardial fibrosis (EM) (E and F), and endocardial fibroelastosis-like fibrosis (EFF) (G). (H to J) Graphs depicting the quantification of the PF (H), EM (I), and EFF (J) in hearts cultured ex vivo at different flow rates. DAPI is used as counterstain in all pictures. Data are presented as mean ± SEM. To evaluate significant differences, 1-way analysis of variance followed by Tukey’s multiple comparisons test was performed for graphs (B [ventricle] and C). Kruskal-Wallis test followed by Dunn’s multiple comparisons test was performed for graphs (B [atrium] and H to J). ∗P < 0.05, ∗∗P < 0.01. Scale bar D to F: 200 μm; G: 100 μm. Abbreviations as in Figure 1.
Figure 7
Figure 7
Molecular Regulation of Fibrosis in Ex Vivo Cultured Hearts Representative pictures of the right ventricle and the right atrium of hearts cultured for 7 days under standard conditions (−), in the presence of SB431542 (SB, SB1, SB2) or transforming growth factor-beta (TGF-β) for (A) phospho-SMAD2/3 (pSMAD2/3) and phospho-p38 mitogen-activated protein kinase (pp38MAPK), (B) α-SMA and vimentin, (C) PECAM-1 and cTnI, (D) collagen I and collagen III, and (E) Alcian blue, periostin, versican B, and fibronectin. (F) Graphs depicting the percentage of hearts with α-SMA expression in the subepicardium of the ventricle and atrium after culture for 7 days under standard conditions (−), in the presence of SB431542 (SB) or TGF-β. (G and H) Graphs depicting the relative α-SMA-positive area (G) and the relative vimentin-positive area (H) in the ventricular or atrial myocardium of hearts cultured for 7 days under standard conditions (−), in the presence of SB431542 (SB) or TGF-β. DAPI was used as counterstain in all fluorescent pictures. Data are presented as means ± SEM. To evaluate significant differences, 1-way analysis of variance followed by Tukey’s multiple comparisons test was performed for graphs (G and H). Kruskal-Wallis test followed by Dunn’s multiple comparisons test was performed for graph (G [atrium]). ∗P < 0.05, ∗∗P < 0.01, ∗∗∗P < 0.001. Scale bar: 20 μm. Abbreviations as in Figure 1.

Similar articles

Cited by

References

    1. Diez J., de Boer R.A. Management of cardiac fibrosis is the largest unmet medical need in heart failure. Cardiovasc Res. 2022;118:e20–e22. - PubMed
    1. Frangogiannis N.G. Cardiac fibrosis: Cell biological mechanisms, molecular pathways and therapeutic opportunities. Mol Aspects Med. 2019;65:70–99. - PubMed
    1. Frangogiannis N.G. Transforming growth factor-beta in myocardial disease. Nat Rev Cardiol. 2022;19:435–455. - PubMed
    1. Goumans M.J., Ten Dijke P. TGF-β signaling in control of cardiovascular function. Cold Spring Harb Perspect Biol. 2018;10(2):a022210. - PMC - PubMed
    1. Bujak M., Frangogiannis N.G. The role of TGF-beta signaling in myocardial infarction and cardiac remodeling. Cardiovasc Res. 2007;74:184–195. - PMC - PubMed

LinkOut - more resources