. 2024 May 29;9(8):982-1001.
doi: 10.1016/j.jacbts.2024.03.007. eCollection 2024 Aug.

Carvedilol Activates a Myofilament Signaling Circuitry to Restore Cardiac Contractility in Heart Failure

Affiliations

Carvedilol Activates a Myofilament Signaling Circuitry to Restore Cardiac Contractility in Heart Failure

Ying Wang et al. JACC Basic Transl Sci. .

Abstract

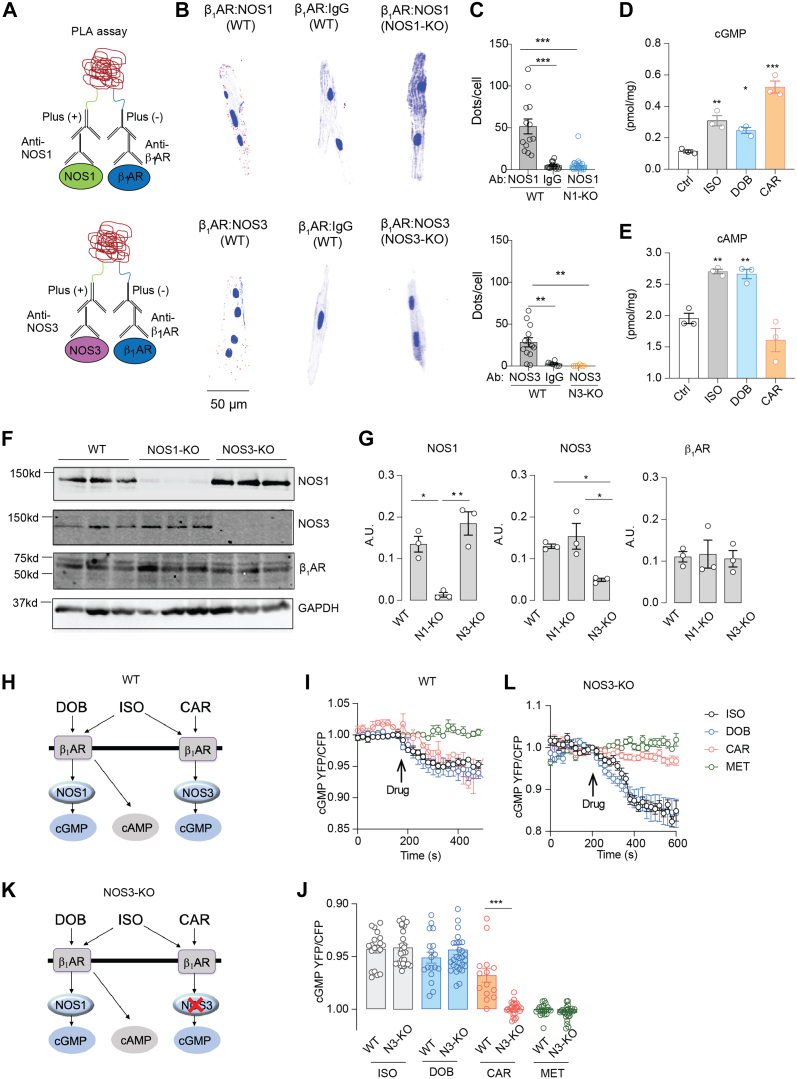
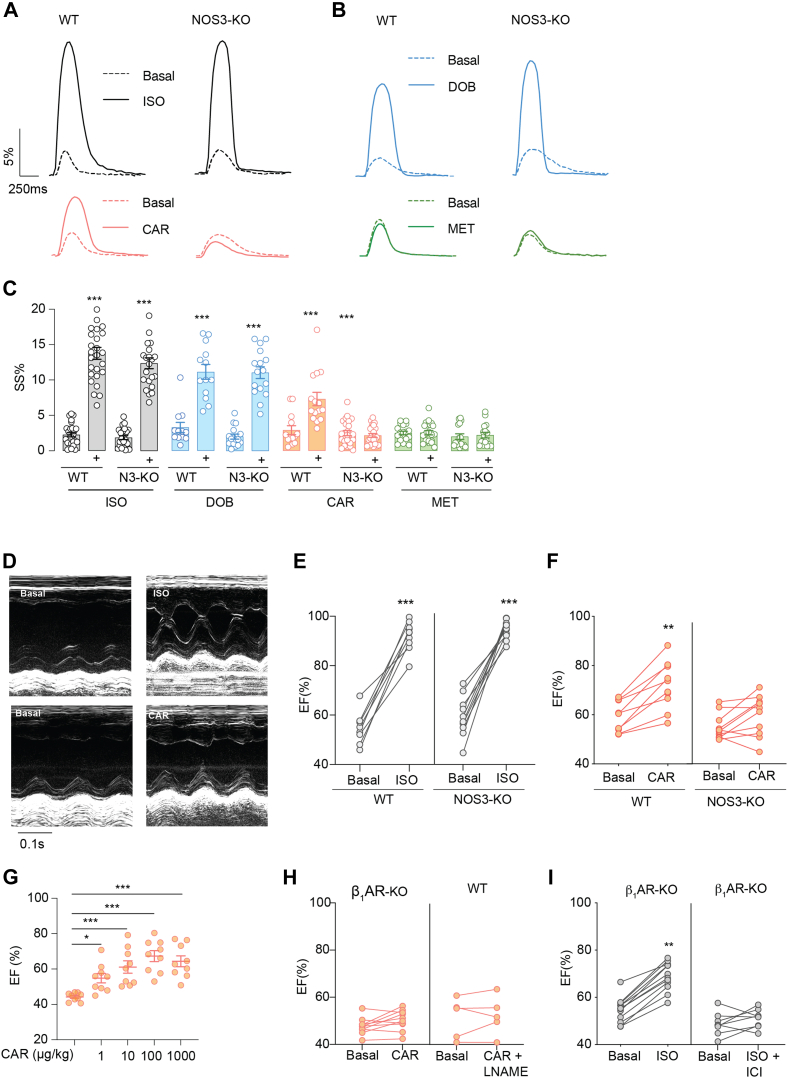
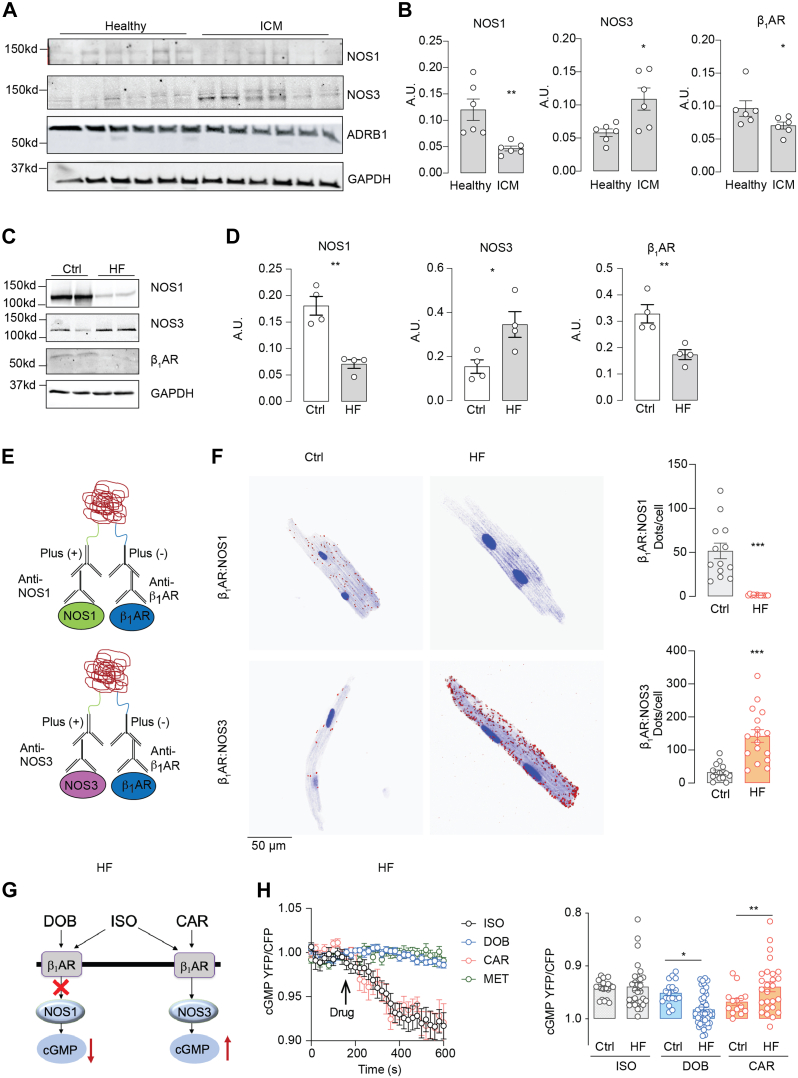
Phosphorylation of myofilament proteins critically regulates beat-to-beat cardiac contraction and is typically altered in heart failure (HF). β-Adrenergic activation induces phosphorylation in numerous substrates at the myofilament. Nevertheless, how cardiac β-adrenoceptors (βARs) signal to the myofilament in healthy and diseased hearts remains poorly understood. The aim of this study was to uncover the spatiotemporal regulation of local βAR signaling at the myofilament and thus identify a potential therapeutic target for HF. Phosphoproteomic analysis of substrate phosphorylation induced by different βAR ligands in mouse hearts was performed. Genetically encoded biosensors were used to characterize cyclic adenosine and guanosine monophosphate signaling and the impacts on excitation-contraction coupling induced by β1AR ligands at both the cardiomyocyte and whole-heart levels. Myofilament signaling circuitry was identified, including protein kinase G1 (PKG1)-dependent phosphorylation of myosin light chain kinase, myosin phosphatase target subunit 1, and myosin light chain at the myofilaments. The increased phosphorylation of myosin light chain enhances cardiac contractility, with a minimal increase in calcium (Ca2+) cycling. This myofilament signaling paradigm is promoted by carvedilol-induced β1AR-nitric oxide synthetase 3 (NOS3)-dependent cyclic guanosine monophosphate signaling, drawing a parallel to the β1AR-cyclic adenosine monophosphate-protein kinase A pathway. In patients with HF and a mouse HF model of myocardial infarction, increasing expression and association of NOS3 with β1AR were observed. Stimulating β1AR-NOS3-PKG1 signaling increased cardiac contraction in the mouse HF model. This research has characterized myofilament β1AR-PKG1-dependent signaling circuitry to increase phosphorylation of myosin light chain and enhance cardiac contractility, with a minimal increase in Ca2+ cycling. The present findings raise the possibility of targeting this myofilament signaling circuitry for treatment of patients with HF.

Keywords: contractility; heart failure; myofilament; myosin light chain; nitric oxide synthetase; protein kinase G; β1-adrenoceptor.


Conflict of interest statement

This work was supported by National Institutes of Health grants R01-HL147263 and HL162825, VA Merit grants IK6BX005753 and BX005100 (to Dr Xiang). Drs Wang and Zhu are recipients of American Heart Association postdoctoral fellowship. Dr Xiang is an established American Heart Association investigator. The authors have reported that they have no relationships relevant to the contents of this paper to disclose.

Figures

None
Graphical abstract
Figure 1
Figure 1
Phosphoproteomics Identifies Myofilament-Specific Phosphorylation of Downstream Substrates in Mouse Hearts Wild-type mouse hearts were Langendorf perfused with vehicle control (Ctrl), isoproterenol (ISO) (0.1 μmol/L), dobutamine (DOB) (1 μmol/L), or carvedilol (CAR) (1 μmol/L) for 10 minutes (n = 5 in each group). Heart lysates were subjected to phosphoproteomic analysis. (A) Pie distribution of phosphoproteins induced by ISO, DOB, and CAR in mouse hearts. (B to D) Cellular organelle enrichment annotation of phosphoproteins induced by ISO, DOB, and CAR in mouse hearts. (E) Volcano plots of phosphoproteins induced by ISO, DOB, and CAR in mouse hearts. (F) Heatmap showing a selective set of phosphoproteins induced by ISO, DOB, and CAR in mouse hearts. (G) Western blots showing the phosphorylation of nitric oxide synthetase 3 (NOS3) at serine 1177 (serine 1178 in the volcano plot), Akt1 at serine 473, Akt2 at serine 474, myosin phosphatase target subunit 1 (MYPT1) at serine 507, threonine 696, and threonine 853, and myosin regulatory light chain (MLC) at serine 19 induced by ISO, DOB, and CAR in mouse hearts. Akt = protein kinase B; GO = Gene Ontology.
Figure 2
Figure 2
Biased Activation of β1AR-NOS1 and β1AR-NOS3 Complexes Transduces cGMP Signal in AVMs (A) Schematic depicting the in situ proximity ligation assay (PLA) of β1-adrenoceptor (β1AR) and nitric oxide synthetase (NOS) isoforms. (B, C) Adult ventricular myocyte (AVMs) were double-labeled with antibodies (Abs) against β1AR/NOS1, β1AR/NOS3, or β1AR/immunoglobulin G (IgG), respectively. The cells were then processed with secondary Ab labeling and polymerase reaction to reveal fluorescence signals according to the manufacturer’s instructions. Data show representative fluorescence images and quantification of positive PLA puncta signals in WT, NOS1–knockout (KO), and NOS3-KO AVMs. The AVMs were from 6 WT, 6 NOS1-KO, and 6 NOS3-KO mice. PLA signals (red) were quantified using Image J. (D,E) Isolated WT AVMs were stimulated with saline (Ctrl) or ISO (0.1 μmol/L), DOB (1 μmol/L), or CAR (1 μmol/L) for 10 minutes. The cyclic adenosine monophosphate (cAMP) and cyclic guanosine monophosphate (cGMP) levels in AVMs were determined using enzyme-linked immunosorbent assays. Data represent AVMs isolated from 3 WT mice. (F, G) Western blots show the expression of β1AR and NOS3 in WT, NOS1-KO, and NOS3-KO mouse hearts. (H,K) Schematic of ligand-specific β1AR-induced cGMP signal in WT and NOS3-KO AVMs. Fluorescent resonance energy transfer (FRET)–based biosensors Gi500 (cGMP) were expressed in AVMs. Cells were stimulated with ISO (0.1 μmol/L), DOB (1 μmol/L), CAR (1 μmol/L), and metoprolol (MET; 1 μmol/L). (I, L) Time courses and quantification of cGMP responses in WT and NOS3-KO AVMs after drug treatments, as indicated by arrows. (J) The maximal increases in cGMP FRET biosensor are presented as mean ± SEM of AVMs isolated from 6 WT and 10 NOS3-KO mice. Data are presented as mean ± SEM. P values were calculated using 1-way analysis of variance followed by Tukey’s test. ∗∗P < 0.01. CFP = cyan fluorescent protein; GAPDH = glyceraldehyde 3-phosphate dehydrogenase; YFP = yellow fluorescent protein; other abbreviations as in Figure 1.
Figure 3
Figure 3
NOS3 Is Essential for Myofilament-Specific β1AR Signaling to Promote Cardiac Contractility (A to C) AVMs from WT and NOS3-KO mice are loaded with fluo-4 Ca2+ dye and paced at 1 Hz. Sarcomere shortening and calcium cycling were recorded at baseline and after stimulation with ISO (black; 0.1 μmol/L), DOB (blue; 1 μmol/L), CAR (orange; 1 μmol/L), or MET (green; 1 μmol/L). Representative curves show dynamics of sarcomere shortening, which was quantified as percentage of sarcomere length shortening (SS%) in WT and NOS3-KO AVMs before (dashed line) and after ligand stimulation. AVMs were isolated from 6 WT and 7 NOS3-KO mice. (D to G) WT, β1AR-KO, and NOS3-KO mice were subjected to echocardiographic measurements before and after stimulation with ISO (100 μg/kg) or CAR (1-1,000 μg/kg) via intraperitoneal injection as indicated (n = 9-12). Data show representative echocardiographic images of the left ventricle before and after drug treatment. (H,I) WT and β1AR-KO mice were subjected to echocardiographic measurements. Mice were treated with ISO (100 μg/kg) or CAR (100 μg/kg) in the presence of the β2AR antagonist NOS inhibitor Nω-nitro-L-arginine methyl ester hydrochloride (LNAME) (100 μg/kg) or ICI-118,551 (ICI; 100 μg/kg) via intraperitoneal injection. Cardiac ejection fraction (EF) was quantified as mean ± SEM (n = 5-9). For B, C, and G, P values were calculated using 1-way analysis of variance followed by Tukey’s test (∗∗P < 0.01 and ∗∗∗P < 0.001). For E, F, H, and I, P values were calculated using paired Student’s t-tests (∗∗P < 0.01 and ∗∗∗P < 0.001). Abbreviations as in Figures 1 and 2.
Figure 4
Figure 4
PKG1 Is Necessary for Myofilament-Specific β1AR Signaling to Promote Protein Phosphorylation and Cardiac Contractility (A, B) WT mice hearts were perfused with saline (Ctrl), ISO (0.1 μmol/L), DOB (1 μmol/L), or CAR (1 μmol/L) for 10 minutes, and the phosphorylation of vasodilator-stimulated phosphoprotein (VASP) at serine 157 and serine 239 was probed and quantified (n = 5). (C, D) PKG1-flox/flox (PKG1-FF), cardiac deletion of PKG1 (PKG1-CKO), CRE, WT, and whole-body deletion of PKG2 (PKG2-KO) mice were subjected to echocardiographic measurements before and after stimulation with CAR (intraperitoneal injection, 100 μg/kg). Cardiac EF was quantified in PKG1-flox, PKG1-CKO, and CRE mice (n = 8) (C) and in PKG2-KO and WT mice (n = 8) (D). (E, F) PKG1-FF and PKG1-CKO hearts were subjected to Langendorf perfusion with saline and CAR (1 μmol/L) for 10 minutes. Heart tissues were lysed to probe the phosphorylation of phospholamban (PLB), MYPT1, and MLC (n = 3). Data are presented as mean ± SEM. ∗∗P < 0.01, ∗∗∗P < 0.01, and ∗∗∗P < 0.001 compared with basal condition or between indicated groups. P values were calculated using 1-way analysis of variance with Tukey’s post hoc or paired Student’s t-tests. Abbreviations as in Figure 1, Figure 2, Figure 3.
Figure 5
Figure 5
A PKG1-MLCK Pathway Is Necessary for Myofilament-Specific β1AR Signaling to Promote Excitation-Contraction Coupling in AVMs Isolated AVMs from PKG1-FF or PKG1-CKO mice were loaded with Ca2+ dye fluo-4 and paced at 1 Hz. Sarcomere shortening and Ca2+ cycling were recorded at baseline and after stimulation with ISO (0.1 μmol/L), DOB (1 μmol/L), or CAR (1 μmol/L). (A,B) Representative curves show dynamics of sarcomere shortening, which were quantified as SS% in AVMs. (C-E) Representative curves show dynamics of Ca2+ cycling, which were quantified as intracellular Ca2+ amplitude and tau in AVMs. Data are presented as mean ± SEM of AVMs from 3 PKG1-FF and 3 PKG1-CKO mice. ∗∗P < 0.01, ∗∗∗P < 0.01, and ∗∗∗∗P < 0.0001 compared with basal condition or between indicated groups. P values were calculated using 1-way analysis of variance with Tukey’s post hoc test or paired Student’s t-test. (F,G) Sarcomere shortening and Ca2+ cycling were recorded at baseline and after stimulation with CAR (1 μmol/L) in the presence and absence of the MYLK inhibitor ML-7 (1 μmol/L). Representative curves show dynamics of sarcomere shortening and Ca2+ cycling, which were quantified as SS%, CaT, and tau, respectively. Data are presented as mean ± SEM of AVMs from 5 mice. P values were obtained using paired Student’s t-test. ∗P < 0.05 compared with basal. Abbreviations as in Figure 1, Figure 2, Figure 3, Figure 4.
Figure 6
Figure 6
Cardiac β1AR Switches Coupling From NOS1 to NOS3 in Failing Hearts (A, B) Human ventricle samples from 6 healthy donor human hearts and 6 ischemic cardiomyopathy (ICM) patient hearts were lysed to examine the expression of NOS1, NOS3, and β1AR with western blot. (C, D) Mice underwent chronic infusion of saline or ISO (60 mg/kg/day) for 2 weeks. The expression of NOS1, NOS3, and β1AR in mouse hearts was examined and quantified (n = 4). The protein expression levels in western blots were quantified. (E) Schematics depicting the PLAs to probe β1AR-NOS1 and β1AR-NOS3 complex in failing myocytes from mice after long-term infusion of ISO. (F) AVMs were isolated from the mice after long-term infusion with saline and ISO and processed for PLA staining with antibodies against β1AR/NOS1 or β1AR/NOS3. The PLA signals in healthy control (Ctrl, n = 3) and heart failure (HF, n = 4) mouse AVMs were imaged and quantified. (G) A schematic diagram shows the alteration of β1AR-NOS1 and β1AR-NOS3 cascades and cGMP signaling in HF. (H) AVMs were isolated from the mice after chronic infusion with ISO. AVMs expressing Gi500 FRET biosensor were stimulated with ISO, DOB, CAR, or MET as indicated. Representative time course and quantification of cyclic GMP FRET response to ISO (0.1 μmol/L), DOB (1 μmol/L), CAR (1 μmol/L), or MET (1 μmol/L) in Ctrl and HF AVMs. Data represent AVMs isolated from 5 Ctrl and 6 HF mice. Data are presented as mean ± SEM. P values were calculated using Student’s t-test (B, D, and F), 1-way analysis of variance with Tukey’s post hoc, or paired Student’s t-test (H). ∗P < 0.05, ∗∗P < 0.01, and ∗∗∗P < 0.001 compared with healthy control condition. Abbreviations as in Figure 1, Figure 2, Figure 3, Figure 4.
Figure 7
Figure 7
Stimulation of Myofilament-Specific β1AR-NOS3 Signaling Enhances Cardiac Contractility in Failing Hearts AVMs were isolated from HF mice induced by long-term infusion of ISO. HF AVMs were loaded with fluo-4 (2 μmol/L) and paced at 1 Hz. (A, B) Sarcomere shortening and (C to E) Ca2+ cycling were recorded at baseline and after stimulation with ISO (0.1 μmol/L), DOB (1 μmol/L), CAR (1 μmol/L), or MET (1 μmol/L). Representative curves show the kinetics of sarcomere shortening and Ca2+ cycling, which were quantified as SS%, CaT amplitude, and tau in response to βAR stimulation. Data represent AVMs isolated from 7 HF mice. (F to H) WT mice were subjected to myocardial infarction surgery to induce the acute HF model. At 7 days after myocardial infarction, mice were subjected to echocardiographic measurements at baseline or after treatment with DOB or CAR (0.1-1,000 μg/kg, intraperitoneal injection, n = 10). Data show representative echocardiographic images of the left ventricle before and after drug treatment. DOB and CAR induced dose-dependent increases in cardiac EF (half maximal effective concentrations of 31.36 mg/kg for DOB and 0.61 mg/kg for CAR) (G). The maximal cardiac EF is quantified in (H). Data are presented as mean ± SEM. P values were calculated using paired t-tests between 2 groups (H, left) or 1-way analysis of variance with Tukey’s post hoc or paired Student’s t-test (B, D, E, and H, right). ∗∗P < 0.01 and ∗∗∗P < 0.001 between indicated groups. Abbreviations as in Figure 1, Figure 2, Figure 3, Figure 4.

References

    1. Braunwald E. The war against heart failure: the Lancet lecture. Lancet. 2015;385:812–824. - PubMed
    1. Lorenzen-Schmidt I., Clarke S.B., Pyle W.G. The neglected messengers: Control of cardiac myofilaments by protein phosphatases. J Mol Cell Cardiol. 2016;101:81–89. - PubMed
    1. Sheikh F., Ouyang K., Campbell S.G., et al. Mouse and computational models link Mlc2v dephosphorylation to altered myosin kinetics in early cardiac disease. J Clin Invest. 2012;122:1209–1221. - PMC - PubMed
    1. Warren S.A., Briggs L.E., Zeng H., et al. Myosin light chain phosphorylation is critical for adaptation to cardiac stress. Circulation. 2012;126:2575–2588. - PMC - PubMed
    1. Yuan C.C., Muthu P., Kazmierczak K., et al. Constitutive phosphorylation of cardiac myosin regulatory light chain prevents development of hypertrophic cardiomyopathy in mice. Proc Natl Acad Sci U S A. 2015;112:E4138–E4146. - PMC - PubMed