. 2024 Dec;44(12):2509-2526.
doi: 10.1161/ATVBAHA.124.320933. Epub 2024 Sep 19.

Endothelial TGF-β Signaling Regulates Endothelial-Mesenchymal Transition During Arteriovenous Fistula Remodeling in Mice With Chronic Kidney Disease

Affiliations

Endothelial TGF-β Signaling Regulates Endothelial-Mesenchymal Transition During Arteriovenous Fistula Remodeling in Mice With Chronic Kidney Disease

Weichang Zhang et al. Arterioscler Thromb Vasc Biol. 2024 Dec.

Abstract

Background: Arteriovenous fistulae (AVF) are the preferred vascular access for hemodialysis in patients with end-stage kidney disease. Chronic kidney disease (CKD) is associated with endothelial injury, impaired AVF maturation, and reduced patency, as well as utilization. Because CKD is characterized by multiple pathophysiological processes that induce endothelial-to-mesenchymal transition (EndMT), we hypothesized that CKD promotes EndMT during venous remodeling and that disruption of endothelial TGF (transforming growth factor)-β signaling inhibits EndMT to prevent AVF failure even in the end-stage kidney disease environment.

Methods: The mouse 5/6 nephrectomy and aortocaval fistula models were used. CKD was created via 5/6 nephrectomy, with controls of no (0/6) or partial (3/6) nephrectomy in C57BL/6J mice. AVF were created in mice with knockdown of TGF-βR1/R2 (TGF-β receptors type 1/2) in either smooth muscle cells or endothelial cells. AVF diameters and patency were measured and confirmed by serial ultrasound examination. AVF, both murine and human, were examined using Western blot, histology, and immunofluorescence. Human and mouse endothelial cells were used for in vitro experiments.

Results: CKD accelerates TGF-β activation and promotes EndMT that is associated with increased AVF wall thickness and reduced patency in mice. Inhibition of TGF-β signaling in both endothelial cells and smooth muscle cells decreased smooth muscle cell proliferation in the AVF wall, attenuated EndMT, and was associated with reduced wall thickness, increased outward remodeling, and improved AVF patency. Human AVF also showed increased TGF-β signaling and EndMT.

Conclusions: CKD promotes EndMT and reduces AVF patency. Inhibition of TGF-β signaling, especially disruption of endothelial cell-specific TGF-β signaling, attenuates EndMT and improves AVF patency in mouse AVF. Inhibition of EndMT may be a therapeutic approach of translational significance to improve AVF patency in human patients with CKD.

Keywords: TGF-β; arteriovenous fistula; cell differentiation; endothelial cells; endothelial-mesenchymal transition; kidney failure, chronic; myocytes, smooth muscle.


Conflict of interest statement

None.

Figures

Figure 1.
Figure 1.
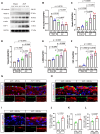
Chronic kidney disease inhibits arteriovenous fistula (AVF) outward remodeling and increases AVF wall thickness. A, Line graph showing relative inferior vena cava (IVC) diameter over time; values are normalized to the preoperative measurement. P<0.0001 (2-way ANOVA); post hoc values shown in graph; n=5 to 21. B, Bar graph showing AVF wall thickness (day 21). P<0.0001 (1-way ANOVA); n=6. C, Bar graph showing the percentage of α-SMA (α-smooth muscle actin)/PCNA (proliferating cell nuclear antigen) dual positive cells (day 21). P<0.0001 (1-way ANOVA); n=6. D, Representative photomicrographs of van Gieson staining showing AVF wall thickness (day 21) of the infrarenal IVC of mice with either sham or AVF, and either sham nephrectomy (0/6 Nx), single nephrectomy (3/6 Nx), or subtotal nephrectomy (5/6 Nx). E, Representative photomicrographs of immunofluorescence (IF) showing PCNA (red), α-SMA (green), and DAPI (4′,6-diamidino-2-phenylindole; blue) in the AVF wall (day 21). F, Representative photomicrographs of IF showing fibronectin (red), CD31 (green), and DAPI (blue) in the AVF wall (day 21). G, Representative photomicrographs of IF showing collagen-1 (red), α-SMA (green), and DAPI (blue) in the AVF wall (day 21). H, Representative photomicrographs of IF showing collagen-3 (red), α-SMA (green), and DAPI (blue) in the AVF wall (day 21). I, Bar graph showing the density of fibronectin in the AVF wall (day 21). P<0.0001 (1-way ANOVA); n=6. J, Bar graph showing the density of collagen-1 in the AVF wall (day 21). P<0.0001 (1-way ANOVA); n=6. K, Bar graph showing the density of collagen-3 in the AVF wall (day 21). P<0.0001 (1-way ANOVA); n=6. A.U. indicates arbitrary unit.
Figure 2.
Figure 2.
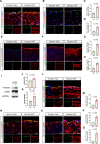
Increased endothelial-to-mesenchymal transition (EndMT) in mouse arteriovenous fistula (AVF). A, Representative photomicrographs showing Western blot analysis of the endothelial marker VE-cadherin and mesenchymal markers (Notch-3 [neurogenic locus notch homolog protein 3], vimentin, α-actin, and FSP-1 [fibroblast-specific protein 1]) in the infrarenal inferior vena cava (IVC) of mice harvested at day 21 after sham operation or AVF creation. B, Bar graph showing the expression level of VE-cadherin in the IVC (sham) or AVF wall (day 21). P=0.0008 (1-way ANOVA); n=3. C, Bar graph showing the expression level of Notch-3 in the IVC (sham) or AVF wall (day 21). P=0.0005 (1-way ANOVA); n=3. D, Bar graph showing the expression level of vimentin in the IVC (sham) or AVF wall (day 21). P=0.0014 (1-way ANOVA); n=3. E, Bar graph showing the expression level of α-actin in the IVC (sham) or AVF wall (day 21). P<0.0001 (1-way ANOVA); n=3. F, Bar graph showing the expression level of FSP-1 in the IVC (sham) or AVF wall (day 21). P<0.0001 (1-way ANOVA); n=3. G, Representative photomicrographs showing immunofluorescence (IF) of vimentin (red), CD31 (green), and DAPI (4′,6-diamidino-2-phenylindole; blue) in the mouse AVF wall without (0/6 Nx) or with (5/6 Nx) nephrectomy, day 21. H, Representative photomicrographs showing IF of Notch-3 (red), CD31 (green), and DAPI (blue) in the mouse AVF wall without (0/6 Nx) or with (5/6 Nx) nephrectomy, day 21. I, Representative photomicrographs showing IF of FSP-1 (red), CD31 (green), and DAPI (blue) in the mouse AVF wall without (0/6 Nx) or with (5/6 Nx) nephrectomy, day 21. J, Bar graph showing the percentage of vimentin and CD31 dual positive cells in the AVF wall. P=0.0004 (unpaired t test); n=6. K, Bar graph showing the percentage of Notch-3 and CD31 dual positive cells in the AVF wall. P=0.001 (unpaired t test); n=6. L, Bar graph showing the percentage of FSP-1 and CD31 dual positive cells in the AVF wall. P=0.0189 (unpaired t test); n=6. A.U. indicates arbitrary unit.
Figure 3.
Figure 3.
Increased TGF-β (transforming growth factor-β) signaling and endothelial-to-mesenchymal transition (EndMT) in human arteriovenous fistula (AVF). A, Representative photomicrographs and immunofluorescence (IF) staining of TGF-β1 (red) merged with CD31 (green) and DAPI (4′,6-diamidino-2-phenylindole; blue) in human control vein and AVF. B, Representative photomicrographs and IF staining of p-smad2 (red) merged with CD31 (green) and DAPI (blue) in human control vein and AVF. C, Bar graph showing the density of TGF-β1 in the human control vein and AVF wall. P=0.0004 (unpaired t test); n=6. D, Bar graph showing the percentage of p-smad2 and CD31 dual positive cells in the human control vein and AVF wall. P<0.0001 (unpaired t test); n=6. E, Representative photomicrographs and of the IF staining of fibronectin (red) merged with CD31 (green) and DAPI (blue) in human control vein and AVF. F, Representative photomicrographs and IF staining of collagen-1 (red) merged with CD31 (green) and DAPI (blue) in the human control vein and AVF. G, Bar graph showing the density of fibronectin in human control vein and AVF wall. P<0.0001 (unpaired t test); n=6. H, Bar graph showing the density of collagen-1 in the human control vein and AVF wall. P=0.0001 (unpaired t test); n=6. I, Representative photomicrographs showing Western blot (WB) of mesenchymal markers (vimentin, α-actin) in the human control vein and AVF. J, Bar graph showing the expression level of α-actin in the human control vein and AVF wall. P=0.00477 (unpaired t test); n=4. K, Bar graph showing the expression level of vimentin in the human control vein and AVF wall. P=0.017 (unpaired t test); n=5. L, Representative photomicrographs showing IF of Notch-3 (neurogenic locus notch homolog protein 3; red), CD31 (green), and DAPI (blue) in the human control vein and AVF wall. M, Bar graph showing the percentage of Notch-3 and CD31 dual positive cells in the human control vein and AVF wall. P<0.0001 (unpaired t test); n=6. N, Representative photomicrographs showing IF of vimentin (red), CD31 (green), and DAPI (blue) in the human control vein and AVF wall. O, Representative photomicrographs showing IF of FSP-1 (fibroblast-specific protein 1; red), CD31 (green), and DAPI (blue) in the human control vein and AVF wall. P, Bar graph showing the percentage of vimentin and CD31 dual positive cells in the human control vein and AVF wall. P<0.0001 (unpaired t test); n=6. Q, Bar graph showing the percentage of FSP-1 and CD31 dual positive cells in the human control vein and AVF wall. P<0.0001 (unpaired t test); n=6. A.U. indicates arbitrary unit.
Figure 4.
Figure 4.
Increased TGF-β (transforming growth factor-β) signaling in mouse arteriovenous fistula (AVF) in the end-stage kidney disease (ESKD) environment. A, Representative WB and qualification of TGF-β1 and p-smad2 expression level in mouse AVF with or without ESKD; bar graph showing the expression level of TGF-β1 in the AVF wall; P=0.0385 (unpaired t test); n=3; bar graph showing the expression level of p-smad2 in the AVF wall; P=0.0077 (unpaired t test); n=3. B, Representative photomicrographs showing immunofluorescence (IF) of TGF-β1 in the endothelial cell (EC) layer and smooth muscle cell (SMC) layer in mouse AVF with or without ESKD at day 7; bar graph showing the density of TGF-β1 in EC in the AVF wall (day 7); P=0.0213 (unpaired t test); n=6; bar graph showing the density of TGF-β1 in SMC in the AVF wall (day 7); P=0.0141 (unpaired t test); n=6. C, Representative photomicrographs showing IF of TAK-1 (transforming growth factor-β–activated kinase 1) in the EC layer and SMC layer in mouse AVF with or without ESKD at day 7; bar graph showing the density of TAK-1 in EC in the AVF wall (day 7); P=0.0426 (unpaired t test)); n=6; bar graph showing the density of TAK-1 in SMC in the AVF wall (day 7); P=0.0251 (unpaired t test); n=6. D, Representative photomicrographs showing IF of p-smad2 in the EC layer and SMC layer in mouse AVF with or without ESKD at day 7; bar graph showing the percentage of p-smad2 and CD31 dual positive cells in the AVF wall; P=0.0001 (unpaired t test); n=6; bar graph showing the percentage of p-smad2 and α-SMA (α-smooth muscle actin) dual positive cells in the AVF wall; P=0.0012 (unpaired t test); n=6. E, Representative photomicrographs showing IF of p-smad3 in the EC layer and SMC layer in mouse AVF with or without ESKD at day 7; bar graph showing the percentage of p-smad3 and CD31 dual positive cells in the AVF wall; P=0.0028 (unpaired t test); n=6; bar graph showing the percentage of p-smad3 and α-SMA dual positive cells in the AVF wall; P=0.0029 (unpaired t test); n=6. A.U. indicates arbitrary unit; and DAPI, 4′,6-diamidino-2-phenylindole.
Figure 5.
Figure 5.
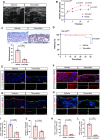
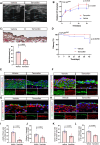
Inhibition of TGF-β (transforming growth factor-β) signaling in the endothelial cells promotes arteriovenous fistula (AVF) maturation in TGF-βRiEC mice with chronic kidney disease (CKD). A, Representative ultrasound of AVF (day 21) of Cdh5-CreERT2; Tgfbr1fl/fl; Tgfbr2fl/fl; mT/mG (TGF-βRiEC) mice treated with vehicle (control) or tamoxifen, as well as 5/6 nephrectomy (Nx; day 21) and AVF creation (day 0). B, Kaplan-Meier analysis showing the outward remodeling of the AVF (days 0–21) in TGF-βRiEC mice. Values are normalized by preoperative measurement; AVF: P<0.0001 (2-way ANOVA), post hoc values shown in graph; n=21 for control, n=9 for tamoxifen. C, Representative photomicrographs of Elastin van Gieson (EVG) staining showing wall thickness of the AVF in TGF-βRiEC mice treated with vehicle or tamoxifen; bar graph shows AVF wall thickness, day 21; P<0.0001 (unpaired t test); n=6. D, Line graph showing AVF patency up to day 42; *P=0.0354 (log-rank); n=25 for control, n=19 for tamoxifen. E, Representative photomicrographs showing immunofluorescence (IF) of VCAM-1 (vascular cell adhesion molecule 1; red) merged with CD31 (green) and DAPI (4′,6-diamidino-2-phenylindole; blue) in the AVF wall (day 21). F, Representative photomicrographs showing IF of ICAM-1 (intercellular adhesion molecule 1; red) merged with CD31 (green) and DAPI (blue) in the AVF wall (day 21). G, Representative photomicrographs showing IF of PCNA (proliferating cell nuclear antigen; red) merged with CD31 (green) and DAPI (blue) in the AVF wall (day 21). H, Representative photomicrographs showing IF of collagen-1 (red) merged with CD31 (green) and DAPI (blue) in the AVF wall (day 21). I, Bar graph showing the percentage of PCNA and CD31 dual positive cells in the AVF wall (day 21); P=0.0001 (unpaired t test); n=6. J, Bar graph showing the density of collagen-1 in the AVF wall (day 21); P=0.0002 (unpaired t test); n=6. K, Bar graph showing the percentage of VCAM-1 and CD31 dual positive cells in the AVF wall (day 21); P<0.0001 (unpaired t test); n=6. L, Bar graph showing the percentage of ICAM-1 and CD31 dual positive cells in the AVF wall (day 21); P<0.0001 (unpaired t test); n=6. A.U. indicates arbitrary unit.
Figure 6.
Figure 6.
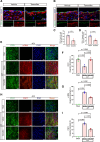
Inhibition of TGF-β (transforming growth factor-β) signaling in the endothelial cells inhibits endothelial-to-mesenchymal transition (EndMT) in TGF-βRiEC mice with chronic kidney disease (CKD). A, Representative photomicrographs showing immunofluorescence (IF) of Notch-3 (neurogenic locus notch homolog protein 3; red) merged with CD31 (green) and DAPI (4′,6-diamidino-2-phenylindole; blue) in the arteriovenous fistula (AVF) wall (day 21). B, Representative photomicrographs showing IF of vimentin (red) merged with CD31 (green) and DAPI (blue) in the AVF wall (day 21). C, Bar graph showing the percentage of Notch-3 and CD31 dual positive cells in the AVF wall (day 21); P<0.0001 (unpaired t test); n=6. D, Bar graph showing the percentage of vimentin and CD31 dual positive cells in the AVF wall (day 21); P<0.0001 (unpaired t test); n=6. E, Representative photomicrographs showing en face whole-mount immunofluorescence of inferior vena cava (IVC) with CD31 and α-SMA (α-smooth muscle actin) at day 7. F, Bar graph showing the density of CD31 on the inner surface of the IVC or AVF wall (day 7); P=0.0033 (1-way ANOVA); n=3; post hoc values shown in the graph. G, Bar graph showing the density of α-SMA on the inner surface of the IVC or AVF wall (day 7); P<0.0001 (1-way ANOVA); n=3; post hoc values shown in the graph. H, Representative photomicrographs showing en face whole-mount immunofluorescence of IVC with CD31 and FSP-1 (fibroblast-specific protein 1) at day 7. I, Bar graph showing the density of FSP-1 on the inner surface of the IVC or AVF wall (day 7); P<0.0001 (1-way ANOVA); n=3; post hoc values shown in the graph. A.U. indicates arbitrary unit.
Figure 7.
Figure 7.
Inhibition of TGF-β (transforming growth factor-β) signaling in smooth muscle cells promotes arteriovenous fistula (AVF) maturation in TGF-βRiSMC mice with chronic kidney disease (CKD). A, Representative ultrasound of AVF (day 21) of MYH11-CreERT2; Tgfbr1fl/fl; Tgfbr2fl/fl; mT/mG (TGF-βRiSMC) mice treated with vehicle (control) or tamoxifen, as well as 5/6 nephrectomy (Nx; day 21) and AVF creation (day 0). B, Line graph showing the outward remodeling of AVF (days 0–21). Values are normalized by preoperative measurement; AVF: P=0.0258 (2-way ANOVA); post hoc values shown in the graph; n=21 for control, n=10 for tamoxifen. C, Representative photomicrographs of Elastin van Gieson (EVG) staining showing wall thickness of the AVF in TGF-βRiSMC mice; bar graph showing AVF wall thickness, day 21; P<0.0001 (unpaired t test); n=6. D, Kaplan-Meier analysis showing AVF patency up to day 42; *P=0.0679 (log-rank); n=26 for control, n=23 for tamoxifen. E, Representative photomicrographs showing immunofluorescence (IF) of PCNA (proliferating cell nuclear antigen; red) merged with α-SMA (α-smooth muscle actin; green) and DAPI (4′,6-diamidino-2-phenylindole; blue) in AVF at day 21. F, Representative photomicrographs showing IF of collagen-1 (red) merged with α-SMA (green) and DAPI (blue) in AVF at day 21. G, Representative photomicrographs showing immunofluorescence (IF) of Notch-3 (neurogenic locus notch homolog protein 3; red) merged with CD31 (green) and DAPI (blue) in the AVF wall (day 21). H, Representative photomicrographs showing IF of vimentin (red) merged with CD31 (green) and DAPI (blue) in the AVF wall (day 21). I, Bar graph showing the percentage of PCNA–α-SMA dual positive cells; P<0.0001 (unpaired t test); n=6. J, Bar graph showing the density of collagen-1 in the AVF wall (day 21); P=0.0241 (unpaired t test); n=6. K, Bar graph showing the percentage of Notch-3 and CD31 dual positive cells in the AVF wall (day 21); P=0.0005 (unpaired t test); n=6. L, Bar graph showing the percentage of vimentin and CD31 dual positive cells in the AVF wall (day 21); P=0.0007 (unpaired t test); n=6. A.U. indicates arbitrary unit.
Figure 8.
Figure 8.
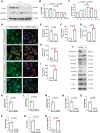
Inhibition of TGF-β (transforming growth factor-β) signaling attenuates endothelial-to-mesenchymal transition (EndMT) in endothelial cells (EC) in vitro. A, Representative photomicrographs showing the Western blot of endothelial marker CD31 and mesenchymal marker vimentin in the human umbilical vein EC (HUVECs) with TGF-β1 (0–40 ng/mL; 48 h). B, Quantification of CD31 normalized to GAPDH; P<0.0001 (1-way ANOVA); post hoc values shown in the graph; n=3. C, Quantification of vimentin normalized to GAPDH; P<0.0001 (1-way ANOVA); post hoc values shown in the graph; n=3. D, Representative photomicrographs showing immunofluorescence (IF) of the endothelial marker CD31 and mesenchymal markers (Notch-3 [neurogenic locus notch homolog protein 3], vimentin, α-actin, and FSP-1 [fibroblast-specific protein 1]) in HUVECs treated with TGF-β1 (10 ng/mL; 48 h). E, Bar graph showing the density of CD31; P=0.0051 (unpaired t test); n=3. F, Bar graph showing the density of Notch-3; P=0.0004 (unpaired t test); n=3. G, Bar graph showing the density of vimentin; P=0.0036 (unpaired t test); n=3. H, Bar graph showing the density of α-SMA (α-smooth muscle actin); P=0.0002 (unpaired t test); n=3. I, Bar graph showing the density of FSP-1; P=0.0005 (unpaired t test); n=3. J, Representative photomicrographs showing Western blot of the endothelial marker VE-cadherin, mesenchymal markers (Notch-3, vimentin, α-actin, and FSP-1), and other proteins in primary EC derived from TGF-βRiEC mice with chronic kidney disease (CKD) and treated with vehicle or tamoxifen. K, Bar graph showing the relative expression of TGFβR2 (TGFβ receptor type 2); P=0.0013 (unpaired t test); n=3. L, Bar graph showing the relative expression of TGFβR1 (TGFβ receptor type 1); P=0.0013 (unpaired t test); n=3. M, Bar graph showing the relative expression of P-smad2; P=0.0013 (unpaired t test); n=3. N, Bar graph showing the relative expression of Notch-3; P=0.0033 (unpaired t test); n=3. O, Bar graph showing the relative expression of fibronectin; P=0.0008 (unpaired t test); n=3. P, Bar graph showing the relative expression of vimentin; P=0.0017 (unpaired t test); n=3. Q, Bar graph showing the relative expression of FSP-1; P=0.0014 (unpaired t test); n=3. R, Bar graph showing the relative expression of VE-cadherin; P=0.001 (unpaired t test); n=3. A.U. indicates arbitrary unit; and DAPI, 4′,6-diamidino-2-phenylindole.

Comment in

References

    1. Jha V, Garcia-Garcia G, Iseki K, Li Z, Naicker S, Plattner B, Saran R, Wang AY, Yang CW. Chronic kidney disease: global dimension and perspectives. Lancet. 2013;382:260–272. doi: 10.1016/S0140-6736(13)60687-X - PubMed
    1. Naghavi M, Wang HD, Lozano R, Davis A, Liang XF, Zhou MG, Vollset SE, Ozgoren AA, Abdalla S, Abd-Allah F, et al. . Global, regional, and national age-sex specific all-cause and cause-specific mortality for 240 causes of death, 1990-2013: a systematic analysis for the Global Burden of Disease Study 2013. Lancet. 2015;385:117–171. doi: 10.1016/s0140-6736(14)61682-2 - PMC - PubMed
    1. Almasri J, Alsawas M, Mainou M, Mustafa RA, Wang Z, Woo K, Cull DL, Murad MH. Outcomes of vascular access for hemodialysis: a systematic review and meta-analysis. J Vasc Surg. 2016;64:236–243. doi: 10.1016/j.jvs.2016.01.053 - PubMed
    1. Murad MH, Elamin MB, Sidawy AN, Malaga G, Rizvi AZ, Flynn DN, Casey ET, McCausland FR, McGrath MM, Vo DH, et al. . Autogenous versus prosthetic vascular access for hemodialysis: a systematic review and meta-analysis. J Vasc Surg. 2008;48:34S–47S. doi: 10.1016/j.jvs.2008.08.044 - PubMed
    1. Langer S, Kokozidou M, Heiss C, Kranz J, Kessler T, Paulus N, Kruger T, Jacobs MJ, Lente C, Koeppel TA. Chronic kidney disease aggravates arteriovenous fistula damage in rats. Kidney Int. 2010;78:1312–1321. doi: 10.1038/ki.2010.353 - PubMed

MeSH terms

Substances