. 2025 Mar;12(11):e2405004.
doi: 10.1002/advs.202405004. Epub 2024 Sep 19.

3D Printed Mesh Geometry Modulates Immune Response and Interface Biology in Mouse and Sheep Model: Implications for Pelvic Floor Surgery

Affiliations

3D Printed Mesh Geometry Modulates Immune Response and Interface Biology in Mouse and Sheep Model: Implications for Pelvic Floor Surgery

Kallyanashis Paul et al. Adv Sci (Weinh). 2025 Mar.

Abstract

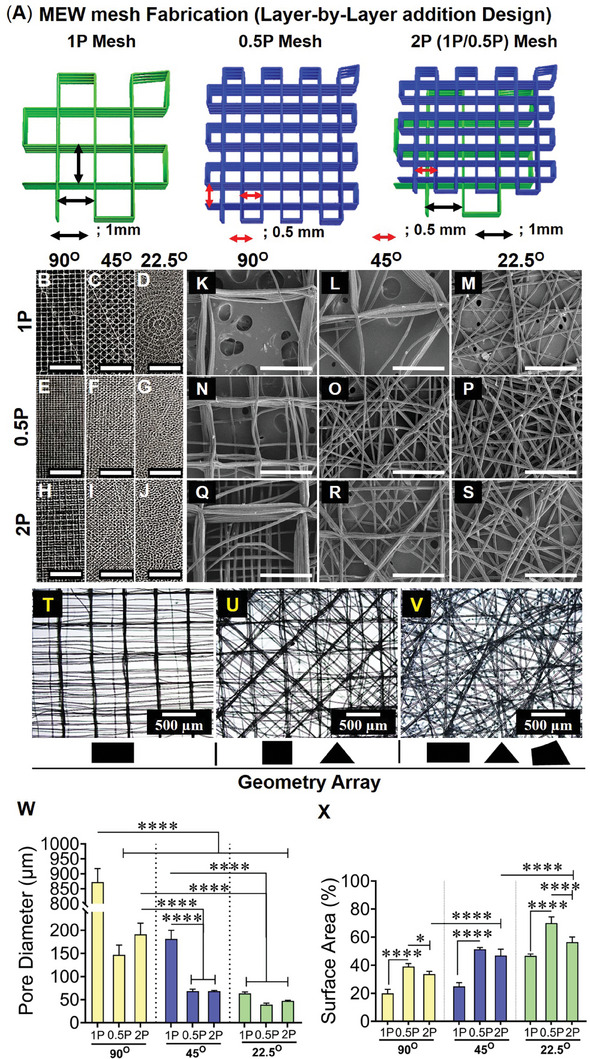
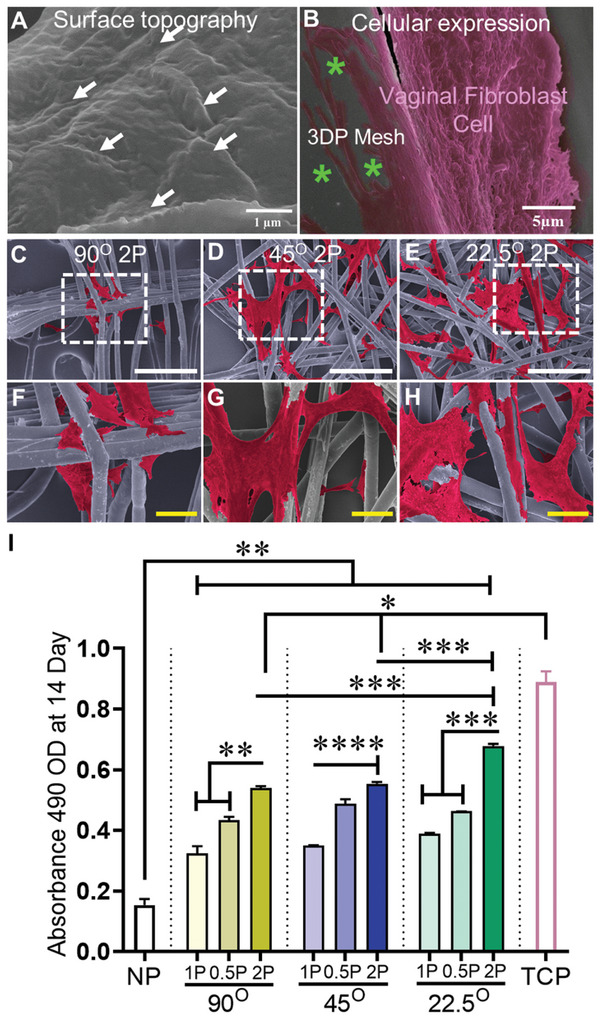
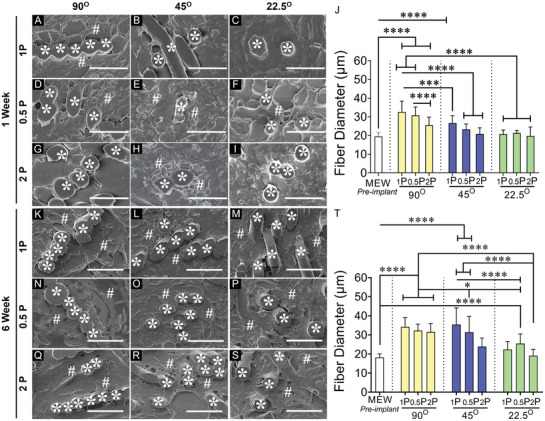
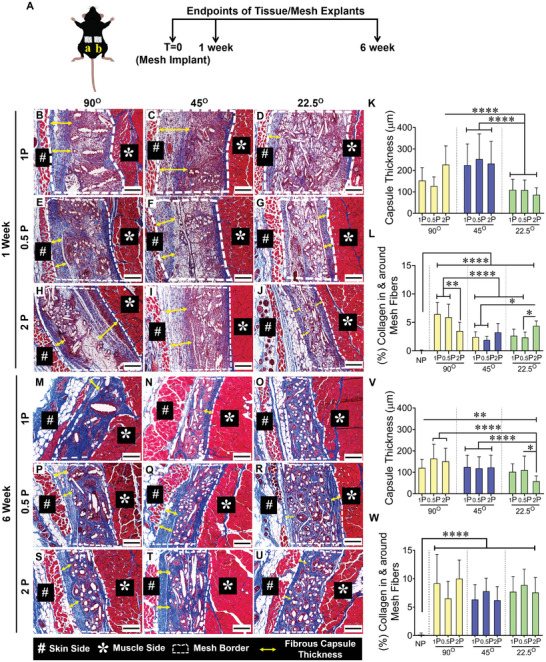
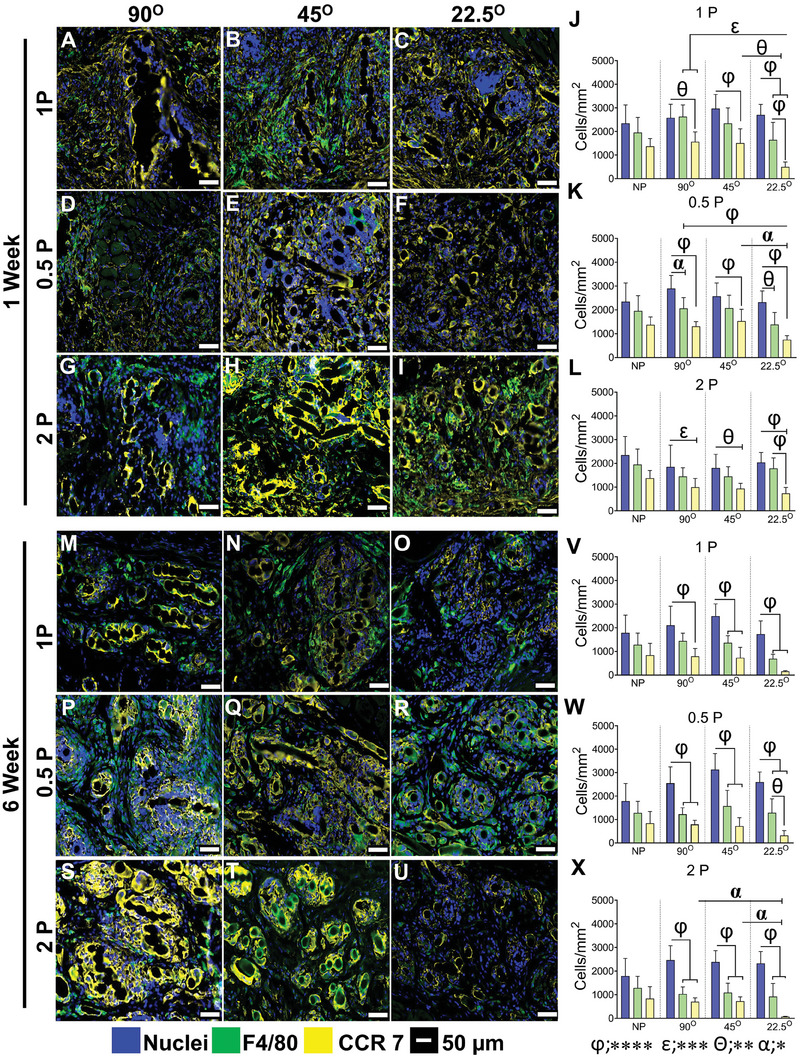
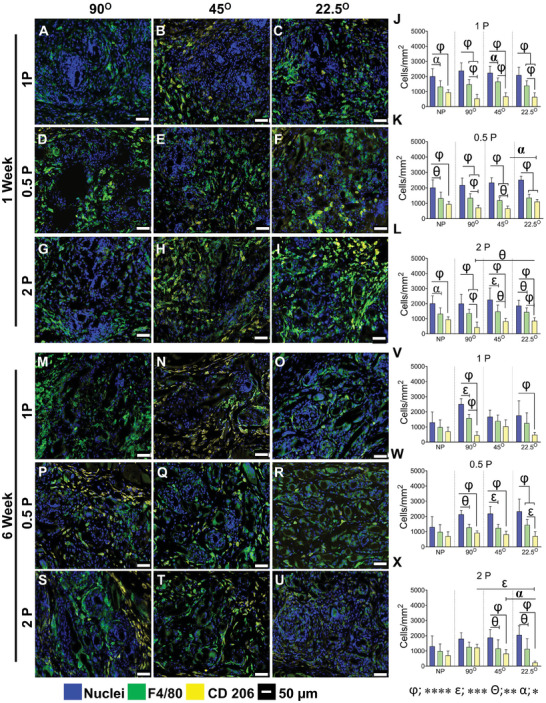
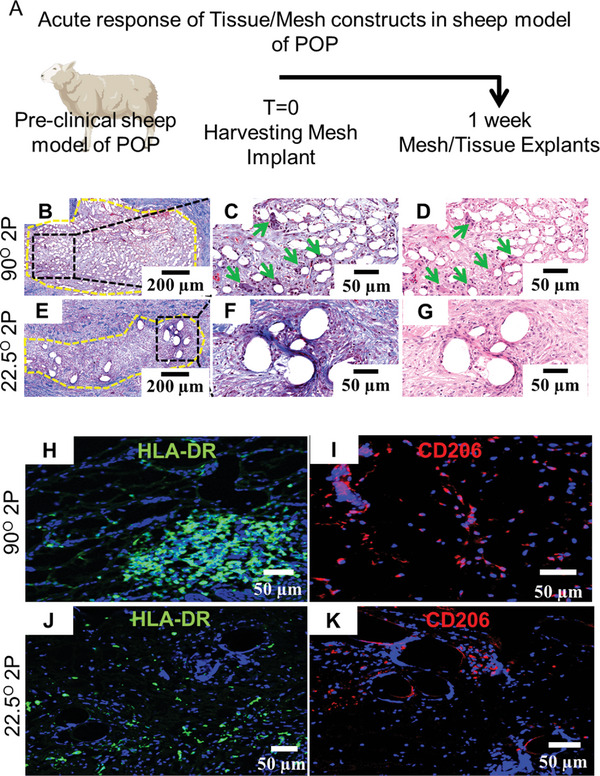
Pelvic organ prolapse (POP) is a highly prevalent yet neglected health burden for women. Strengthening the pelvic floor with bioactive tissue-engineered meshes is an emerging concept. This study investigates tissue regenerative design parameters, including degradability, porosity, and angulation, to develop alternative degradable melt electrowritten (MEW) constructs for surgical applications of POP. MEW constructs were fabricated in hierarchical geometries by two-way stacking of the fibers with three different inter layer angles of 90°, 45°, or 22.5°. Implants printed at 22.5° have higher tensile strength under dry conditions and show better vaginal fibroblast (VF) attachment in vitro. In vivo assessment using preclinical mouse and ovine models demonstrates more effective degradation and improved tissue integration in 22.5° angular meshes compared to 90° and 45° meshes, with evidence of neo-collagen deposition within implants at 6 weeks. The pattern and geometry of the layered MEW implants also influence the foreign body response, wherein the anti-inflammatory phenotype shows a greater ratio of anti-inflammatory CD206+ M2 macrophages/pro-inflammatory CCR7+ M1 macrophages. This presents an attractive strategy for improving the design and fabrication of next-generation vaginal implants for pelvic reconstructive surgery.

Keywords: 3D‐printing; gynaecology; implant immune response; melt electrowriting; tissue engineering.


Conflict of interest statement

The authors declare no conflict of interest.

Figures

Figure 1
Figure 1
Fabrication of MEW meshes with an array of geometries and biophysical characterisation of hierarchical MEW meshes showing A) schematic of representative hierarchical mesh fabrication at 90°, B–J) mesh architecture/gross morphologies (scale bars are 5 mm) K–S) SEM images of mesh morphologies with fiber deposition, open pores, and MEW surface (scale bars are 500 µm), (T‐V) geometric arrays of the 2P structured mesh printed at 90°, 45°, and 22.5°. MEW mesh attributes showing (W) open pore diameter and (X) normalised MEW surface area. Data are mean ± SD for n = 5 meshes/group. Statistical analysis is one‐way ANOVA with Tukey's multiple comparisons test, (*p < 0.05; ****p < 0.0001).
Figure 2
Figure 2
Mechanical characterisation of MEW meshes under uniaxial tensile loading at dry conditions showing stress‐strain curve (A–C) 1st cyclic loading‐unloading cycle (black solid line) and under increasing tensile loading before failure (red solid line) for 90°2P, 45°2P and 22.5°2P MEW meshes; red bordered white dots are the rupture points, D) (%) deformation after a five loading‐unloading cycle, E) ultimate strength, F) toughness of MEW meshes assessed by monotonic stress‐strain curve before failure and G) Poisson's ratio of MEW 2P meshes. Data are mean ± SD for n = 5 meshes/group. Statistical analysis is one‐way ANOVA with Tukey's multiple comparisons test, (*p < 0.05; ***p < 0.0004; ****p < 0.0001).
Figure 3
Figure 3
Surface topography and cellular interaction showing A) nanoscopic features (white arrows) facilitating B) the spreading of the cytoskeleton (pink color) of vaginal fibroblast on 3DP MEW mesh (green asterisks), C–H) SEM image of vaginal fibroblast's attachment (cell cytoskeleton; red color, white scale bars are 500 µm and yellow scale bars are 50 µm) and I) their proliferation at day 14 of vaginal fibroblast cells from non‐POP patients. NP represents “no pore” mesh, and TCP represents “tissue culture plate”. Data are mean ± SD. Statistical analysis is two‐way ANOVA with Tukey's multiple comparisons tests, (*p < 0.05; **p < 0.009; ***p < 0.004, ****p < 0.0001).
Figure 4
Figure 4
MEW mesh fate and histological assessment of the meshes after 1 and 6 week implantation in mice model showing (A–I) and (K–S) SEM images of the explanted meshes in cross‐section. MEW mesh fibers are represented by white asterisks (*) and collagen deposition is represented by white hash (#), J,T) fiber diameter in vivo after 1 and 6 week respectively. Scale bars are 50 µm. Data are mean ± SD, n = 6 meshes/group. Statistical analysis is one‐way ANOVA with Tukey's multiple comparison test, (*p < 0.05; ***p < 0.0003; ****p < 0.0001).
Figure 5
Figure 5
Schematic of subcutaneously implanted mesh and histomorphology assessment of fibrotic capsule thickness of MEW meshes after 1 and 6‐week implantation using Masson Trichrome staining showing mesh implantation A (a, b), the mesh tissue interface (white border), fiber alignments, and capsule formation (yellow double head arrow) after 1 week (B–J) and 6 weeks (M–U). Scale bars are 200 µm. The fibrotic capsule thickness is quantified in (K,V). The newly formed collagen area percentage inside and around the mesh is quantified in (L,W). Data are mean ± SD, n = 6 meshes/group. Statistical analysis is one‐way ANOVA with Tukey's multiple comparisons test, (*p < 0.05; **p < 0.0035; ****p < 0.0001).
Figure 6
Figure 6
Pro‐inflammatory M1 macrophage‐associated foreign body response in mice after 1 and 6 weeks showing total macrophages immunostained with F4/80 (green, pan‐macrophage, M0); CCR7 (yellow, pro‐inflammatory M1 macrophages), nuclei (blue) after 1 week (A‐I) and 6 weeks (M–U). The number of immunostained cells/mm2 is shown in (J–L) at 1 and (V‐X) at 6 weeks. Data are mean ± SD, n = 6 meshes/group. Statistical analysis is two‐way ANOVA with Tukey's multiple comparisons test, (*p < 0.05 (α); **p < 0.0016 (θ); ***p < 0.0003 (ε); ****p < 0.0001 (φ)).
Figure 7
Figure 7
Anti‐inflammatory M2 macrophage‐associated foreign body response in mice after 1 and 6 week, showing total macrophages immunostained with F4/80 (green, pan‐macrophage, M0), CD206 (yellow, anti‐inflammatory M2 macrophages), nuclei (blue) after 1 week (A–I) and 6 week (M–U). The number of cells/mm2 is shown in (J–L) at 1 and (V–X) at 6 week. Data are mean ± SD, n = 6 meshes/group. Statistical analysis is two‐way ANOVA with Tukey's multiple comparisons test, (*p < 0.05 (α); **p < 0.0016 (θ); ***p < 0.0003 (ε); ****p < 0.0001 (φ)).
Figure 8
Figure 8
Gene expression by qPCR of tissues explanted from mice with 2P hierarchical MEW meshes after 1 and 6 weeks, showing differentially expressed genes associated with (A) immune response and (B) cell adhesion and ECM organisation indicating the impact of mesh geometry on the FBR and tissue regeneration in vivo. Data are median ± interquartile range (IQR), n = 6 meshes/group. Statistical analysis is a non‐parametric T‐test with Mann–Whitney comparison test (*p < 0.05).
Figure 9
Figure 9
Preclinical assessment of the acute response of MEW meshes in preclinical sheep model with vaginal POP after 1 week A) Schematic of experimental timeline, B–G) acute tissue response showing the presence of multinucleated giant cells (green arrows) and neo‐collagen deposition (blue color), H,J) showing HLA‐DR expression for pro‐inflammatory M1 macrophages (in green) and I,K) showing CD206 expression of anti‐inflammatory M2 macrophages (in red) around 90° and 22.5° meshes fibers.

Similar articles

Cited by

References

    1. Paul K., Darzi S., Werkmeister J. A., Gargett C. E., Mukherjee S., Nanomaterials 2020, 10, 1120. - PMC - PubMed
    1. Barber M. D., Maher C., Int. Urogynecol J. 2013, 24, 1783. - PubMed
    1. Subak L. L., Waetjen L. E., van den Eeden S., Thom D. H., Vittinghoff E., Brown J. S., Obstet Gynecol 2001, 98, 646. - PubMed
    1. Ashton‐Miller J. A., Delancey J. O., Annu. Rev. Biomed. Eng. 2009, 11, 163. - PMC - PubMed
    1. DeLancey J. O., Am. J. Obstet. Gynecol. 2005, 192, 1488. - PubMed

LinkOut - more resources