. 2024 Nov;11(42):e2308990.
doi: 10.1002/advs.202308990. Epub 2024 Sep 19.

Gasdermin C promotes Stemness and Immune Evasion in Pancreatic Cancer via Pyroptosis-Independent Mechanism

Affiliations

Gasdermin C promotes Stemness and Immune Evasion in Pancreatic Cancer via Pyroptosis-Independent Mechanism

Renfei Wu et al. Adv Sci (Weinh). 2024 Nov.

Abstract

Pancreatic ductal adenocarcinoma (PDAC) is a highly metastatic and lethal disease. Gasdermins are primarily associated with necrosis via membrane permeabilization and pyroptosis, a lytic pro-inflammatory type of cell death. In this study, GSDMC upregulation during PDAC progression is reported. GSDMC directly induces genes related to stemness, EMT, and immune evasion. Targeting Gsdmc in murine PDAC models reprograms the immunosuppressive tumor microenvironment, rescuing the recruitment of anti-tumor immune cells through CXCL9. This not only results in diminished tumor initiation, growth and metastasis, but also enhances the response to KRASG12D inhibition and PD-1 checkpoint blockade, respectively. Mechanistically, it is discovered that ADAM17 cleaves GSDMC, releasing nuclear fragments binding to promoter regions of stemness, metastasis, and immune evasion-related genes. Pharmacological inhibition of GSDMC cleavage or prevention of its nuclear translocation is equally effective in suppressing GSDMC's downstream targets and inhibiting PDAC progression. The findings establish GSDMC as a potential therapeutic target for enhancing treatment response in this deadly disease.

Keywords: KRAS inhibition; cancer stem cells; gasdermin C; immune evasion; immunotherapy; invasion; metastasis; pancreatic ductal adenocarcinoma.


Conflict of interest statement

The authors declare no conflict of interest.

Figures
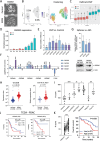
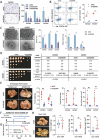
Figure 1
Figure 1
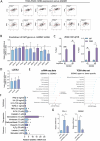
Gasdermin C is overexpressed in advanced PDAC. A) Representative morphology of primary human PDAC culture SIC002 following treatment with macrophage‐conditioned medium (MCM) or control medium. B) UMAP projection of single‐cell data demonstrating the percentage of GSDMC+ cancer cells within primary PDAC cultures (SIC002) after pre‐treatment with EMT‐inducing MCM or control medium (left panel). UMAP projection specifically highlighting clusters 0–8 (right panel). C) Hallmark EMT enrichment score for clusters 0–8 in PDAC cultures treated with MCM or control medium. D) Expression levels of GSDMC in clusters 0–8 from the UMAP projection shown in (C). E) The qPCR fold change of GSDMC expression in eight different human primary PDAC cell cultures after 48 hours of exposure to EMT‐inducing MCM pre‐treatment. The dotted line represents the fold change in expression without MCM treatment (n = 3 independent samples). F) The single‐cell RNA‐seq data illustrates the expression of GSDMA, GSDMB, GSDMC, GSDMD, GSDME, and PJVK in four different primary PDAC cultures. The dotted line indicates Log22 = 1, which signifies a threshold of 2 (t‐test). G) qPCR fold change of GSDMC expression in CSC‐enriched spheres derived from three human primary PDAC cell cultures (upper panel). Fold change values are compared to expression levels in adherent cells (Adh), indicated by the dotted line. Protein levels of GSDMC in spheres versus adherent cells, detected by Western blot, are shown (lower panel) (n = 3 independent samples). Full‐length GSDMC was detected by the GSDMC antibody BS‐16332R (Bioss). H) GSDMC gene expression profiles in PDAC tumor tissue compared to normal tissue from two different datasets (left panel: OncoDB (https://oncodb.org), right panel: Cao et al.,[ 49 ] I) H‐score analysis of GSDMC staining in histological specimens from PDAC patients, including low‐grade well‐differentiated PDAC (Low‐PDAC, n = 7), high‐grade poorly differentiated PDAC (High‐PDAC, n = 6), metastatic PDAC specimens (n = 18), PDAC tumor‐positive lymph nodes (Pos‐LN, n = 6), negative lymph nodes (Neg‐LN, n = 4), and pancreatitis specimens (n = 4). One‐way ANOVA with Fisher's LSD test was used for statistical analysis. J) Prognostic value of GSDMC mRNA expression in PDAC patients from the TCGA data base for overall survival (OS) and relapse‐free survival (RFS) as analyzed by Kaplan‐Meier Plotter (https://kmplot.com/analysis/).[ 50 ] Patient samples were dichotomized by the median value of the target gene. K) H‐score analysis of staining for GSDMC protein in histological specimens from a different set of PDAC patients enrolled at Ruijin Hospital (Shanghai, China), comparing adjacent tumor‐free tissue with tumor tissue (left panel) (n = 60). Prognostic value of GSDMC expression derived from PDAC patients for overall survival (OS) (right panel) (n = 54) using the log‐rank test (right panel). *p < 0.05, **p < 0.01, ***p < 0.001, ****p < 0.0001; Mann Whitney test, two‐tailed. Please also see Figure S1 (Supporting Information).
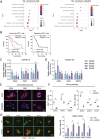
Figure 2
Figure 2
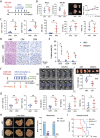
GSDMC is linked to invasion and stemness phenotypes. A) Invasion assay was performed in three different human primary PDAC cultures after knockdown of GSDMC using two different shGSDMCs compared to shNC control. Representative images show invaded cells stained with crystal violet (left panel), and quantification of invaded cells is shown on the right panel (n = 3 independent samples). B) Flow cytometry analysis for the content of CD133+ CXCR4+ cancer stem cells (CSCs) in two different human primary PDAC cultures following genetic targeting of GSDMC. Representative flow cytometric analyses (left), quantification (right) (n = 3 independent samples). C) Sphere formation capacity expressed as number of formed spheres per 10,000 cells in 1 mL, following knockdown of GSDMC in three different human primary PDAC cultures. Representative photographs (left), quantification of sphere counts (middle), and sphere size (right) (n = 3 independent samples). D) In vivo tumorigenicity of decreasing numbers of two different primary PDAC cultures following genetic targeting of GSDMC. N = 6 for both groups. Gross morphology of the explanted tumors (left), tumor take rate and CSC frequency (right). E) Liver metastases (LM) developed in an orthotopic PDAC model after intrapancreatic injection of human primary PDAC cultures with knockdown of GSDMC (shGSDMC) or control (shNC). Representative photographs of macroscopic liver metastases (left), assessment of liver metastases (right), and weight of the primary pancreatic tumors (middle). N = 6 for both groups. F) Schematic of the experimental design. G) Kaplan Meier survival analysis of mice following orthotopic injection of human primary PDAC cells into the pancreas followed by doxycycline (DOX)‐inducible overexpression (OE) of GSDMC. N = 6 for both groups. Statistical analysis was performed using the log‐rank test. H) Macroscopic liver metastases (LM) developed in (G) following doxycycline (DOX)‐induced GSDMC overexpression or control (Con). Representative photographs of macroscopic liver metastases (left), assessment of liver metastases (right), and weight of the primary pancreatic tumors (middle). *p < 0.05 and **p < 0.01; Mann–Whitney U test, two‐tailed, unless stated otherwise. Please also see Figure S2 (Supporting Information).
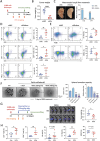
Figure 3
Figure 3
GSDMC expression is linked to immune evasion signals. A) Enriched Gene Ontology (GO) pathway analysis in PDAC primary cultures with GSDMC knockdown (shGSDMC) compared to control (shNC). B) Prognostic value of GSDMC expression in PDAC patients for overall survival (OS) using datasets enriched or depleted for CD8+ T cells, analyzed through Kaplan‐Meier Plotter. C) qPCR analysis of RNA levels for the immune evasion molecules CD24, CD47, and CD274 (encoding PD‐L1) following knockdown (kd) of GSDMC in four different PDAC cultures. The dotted line indicates control treatment (shNC) (n = 3 independent samples). D) qPCR analysis of RNA levels for the immune evasion molecules CD24, CD47, and CD274 following DOX‐inducible overexpression (OE) of GSDMC (n = 3 independent samples). E) Immunofluorescence for CD24, CD47, and PD‐L1 expression (red) after GSDMC knockdown (shGSDMC) versus control (shNC). Nuclei were stained with DAPI (blue). F) Flow cytometry analysis for content of CD47+ and PD‐L1+ cells following genetic targeting of GSDMC (shGSDMC: blue) versus control treatment (shNC: red) (n = 3 independent samples). G) Phagocytic capacity of PBMCs (cell tracker, red) in the presence of PDAC cultures (expressing GFP, green) with genetic targeting of GSDMC (shGSDMC) versus control (shNC). Representative immunofluorescence (left), quantification of the phagocytic index (right) (n = 3 independent samples). *p < 0.05; Mann–Whitney U test, two‐tailed. Please also see Figure S3 (Supporting Information).
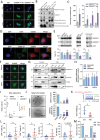
Figure 4
Figure 4
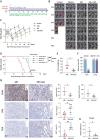
Gsdmc promotes immune evasion in PDAC. A) Schematic illustration of the treatment schedule. B) Tumor weight of primary pancreatic tumors in orthotopic syngeneic KPC models (CHX2000) with genetic targeting of murine Gsdmc (shGsdmc) versus control (shNC). N = 6 for both groups (two‐tailed t‐test). C) Macroscopic lung metastases (left), quantification of liver and lung metastases (right). D) Immune profiling of shGsdmc tumors compared to control (shNC) tumors. N = 6 for both groups. Representative flow cytometry dot plots showing CD8+ T cells, CD4+ T cells, and NK cells (left panel), with quantification in the right panel. The indicated percentage represents the proportion of live cells. E) Representative flow cytometry dot plots illustrating M1 TAM and MDSCs (left panel), with quantification in the right panel. The indicated percentage represents the proportion of live cells. N = 6 for both groups (two‐tailed t‐test). F) Sphere formation capacity of CHX2000 KPC cells expressed as number of formed spheres per 10,000 cells in 1 mL for DOX‐induced shGsdmc for 7 days versus no Dox (control) and WT KPC cells. Representative bright field images of sphere cultures (left panel) and quantification of sphere counts and size (right panel) (n = 3 independent samples). One‐way ANOVA analysis with Tukey's post‐hoc test comparing Tet‐DOX versus Tet‐Con. G) Schematic illustration of the treatment schedule of in vivo DOX‐induced Gsdmc knockdown in mice with orthotopic CHX2000 KPC tumors (left panel). Representative IVIS images for baseline and day 7 (middle panel). Tumor weight on day 12 (right panel). H) Immune cell content in the tumors on day 12 as assessed by flow cytometry. N = 5 for Control group, N = 6 for DOX group. *p < 0.05, **p < 0.01, and ****p < 0.0001; Mann–Whitney U test, two‐tailed, unless stated otherwise. Please also see Figure S4 (Supporting Information).
Figure 5
Figure 5
Nuclear GSDMC transcriptionally controls aggressiveness of PDAC. A) Immunofluorescence (green) for GSDMC using the cytoplasmic (GSDMCCyto) and nuclear GSDMC (GSDMCNuc) antibodies (ab) in SIC003 human PDAC cells. IgG is used as a negative control, while DAPI serves as a nuclear stain. B) Western blot analysis of cell fractionation showing the expression of full length (FL) and nuclear GSDMC in various cellular compartments of human SIC003 PDAC cultures. GSDMC‐FL and nuclear GSDMC are detected using the GSDMCNuc antibody. C) Fold change for ChIP‐qPCR of CD24, CD44, CD47, and CD274 (PD‐L1) promotor DNA expression in PDAC cells following immunoprecipitation with the GSDMCCyto and GSDMCNuc antibodies (ab), or IgG as negative control (n = 3 independent samples). D) Immunofluorescence to co‐localize GSDMC (red) with COPA (green) or ERGIC‐53 (green). DAPI is utilized as a nuclear stain. E) Effects on GSDMC cleavage by inhibition of members of the ADAM family of proteases (ADAM17 inhibitor TMI‐1, ADAM10 inhibitor GI254023X [GI], ADAM10/17 inhibitor GW280264X [GW], siADAM17 [siAD17], and control siRNA [siNC]). Effect on GSDMC content by nuclear import inhibitor ivermectin (IVM; 5 µM). Representative Western blot (upper panel) and quantification (lower panel) (n = 3 independent samples). F) Immunofluorescence for GSDMC (green) in human SIC003 PDAC cultures in the presence of the ADAM17 inhibitor TMI‐1 and ivermectin. DAPI is used as a nuclear stain. G) Nuclear GSDMC protein levels in the whole cell (WCL), nucleus (Nuc), cytoplasm (Cyto), and Golgi, in the presence or absence of the ADAM17 inhibitor TMI‐1. A representative Western blot is displayed. H) qPCR fold change for CD47 and CD274 (PD‐L1) mRNA expression using the ADAM17 inhibitor TMI‐1, siADAM17, and ivermectin. The dotted line indicates treatment with DMSO (control) and is set to 1.0 (n = 3 independent samples). I) Flow cytometry for CD47 and PD‐L1 surface expression in the presence or absence of the ADAM17 inhibitor TMI‐1, siADAM17, or ivermectin. DMSO is used as a negative control (n = 3 independent samples). J) Sphere formation capacity of CHX2000 KPC cells expressed as number of formed spheres per 10,000 cells per 1 mL for treatment with ivermectin (IVM), the ADAM17 inhibitor TMI‐1, and siADAM17 compared to control (DMSO). Representative images (left panel), quantification of sphere count and size (right panel) (n = 3 independent samples; one‐way ANOVA analysis with Games‐Howell post‐hoc test). K) Schematic illustration of the treatment schedule for ivermectin in an orthotopic (orth.) PDAC model using a mixture of KPC‐derived CHX2000 cells and CAF‐1 cells (upper panel). The lower panel shows the tumor weight of the pancreatic tumors with and without ivermectin (IVM) treatment; n = 6‐7. L) Percentage of tumor‐infiltrating CD4+ T helper cells, CD8+ cytotoxic T cells, NK cells, and M1 tumor‐associated macrophages (TAM). M) Occurrence of lung and liver metastases, both with and without ivermectin (IVM) treatment, along with the ratio of mice showing metastases. N = 7 for Control group, N = 6 for IVM group. *p < 0.05, **p < 0.01, and ***p < 0.001; Mann–Whitney U test, two‐tailed, unless stated otherwise. Please also see Figure S5 (Supporting Information).
Figure 6
Figure 6
GSDMC inhibition unleashes CXCL9‐mediated influx of T cells. A) Schematic depicting administration of siGsdmc(siGs) and siCxcl9(siCx) as single treatments or in combination, compared with control treatment in a murine PDAC model. B) Tumor size (left), tumor weight (middle), and representative photographs of gross tumor morphology (right) in response to single or combinational treatment; n = 6. C) Tumor immunoprofiling by flow cytometry for CD4+ and CD8+ T cells, NK cells, and MDSCs following treatment with single or combinational siRNA. D) Infiltrating CD8+ cells were functionally characterized by the expression of granzyme B, and E) IFNγ, utilizing intracellular staining for flow cytometry analysis. *p < 0.05 and **p < 0.01; Mann–Whitney U test, two‐tailed. Please also see Figure S6 (Supporting Information).
Figure 7
Figure 7
Identification of upstream modulators of GSDMC expression. A) Correlation analysis between mRNA expression for GSDMC versus several EMT‐related genes using TCGA datasets. B) qPCR fold change showing GSDMC mRNA expression following knockdown of EMT‐related genes using siRNA in SIC002 PDAC cells. The expression level observed with control siRNA (siNC) is represented by the dotted line (n = 3 independent samples). C) ZEB2 ChIP‐qPCR analysis following pull‐down with antibodies for ZEB2 or IgG as a control for two different PDAC cultures. Results are shown as input DNA in % for amplicon #1 and #2 within the GSDMC promoter (n = 3 independent samples; two‐tailed t‐test). D) qPCR fold change of GSDMC in three different human primary PDAC cell cultures following pre‐treatment with siZEB2. The dotted line represents control treatment with siNC (n = 3 independent samples). E) Pathway enrichment analysis for GSDMC+ versus GSDMC PDAC cells using our single‐cell RNA sequencing (scRNA‐seq) data (left panel). Pathway enrichment analysis for patients in the TCGA dataset stratified for tumor GSDMC expression in the upper versus lower quartile (right panel). Up‐regulated pathways are denoted in blue, while down‐regulated pathways are depicted in red. F) Relative mRNA expression levels for GSDMC in response to a diverse range of upstream activators for 48 hours (n = 3 independent samples). G) qPCR fold change of mRNA levels for CD274 (left) and GSDMC (right) in PDAC cells treated with gemcitabine (GEM: 10  µM) in the presence of siNC or siGSDMC (n = 3 independent samples). *p < 0.05, **p < 0.01, and ****p < 0.0001; Mann–Whitney U test, two‐tailed, unless stated otherwise. Please also see Supplementary Figures S7.
Figure 8
Figure 8
Therapeutic targeting of Gsdmc in preclinical PDAC models. A) Schematic illustrating the experimental design for the subcutaneous murine PDAC model treated with intratumoral siGsdmc (siGs) or siNC injections. B) Tumor size of siGsdmc or siNC‐treated tumors on day 1 (left), tumor weight on day 10 with corresponding photographs depicting the macroscopic morphology of the explanted tumors (middle), and body weight over the course of the experiment (right). N = 6 for both groups. C) Immune profiling of tumor‐infiltrating cells by flow cytometry, depicting the percentages of CD4+ cells, CD8+ cells, NK cells, M1 TAMs, and MDSCs in siGsdmc‐treated versus siNC‐treated tumors. N = 6 for both groups. D) Representative images for H&E staining and immunohistochemistry for CD4 and CD8 in tumor sections derived from siGsdmc‐treated versus siNC‐treated mice. E) Quantification of cells that stained positive for the listed T cell markers. N = 3 for both groups. F) Schematic illustrating the experimental design for orthotopic murine PDAC models treated with systemic siGsdmc or siNC injections (left panel). Representative IVIS images recorded at baseline and on day 7 (middle panel). Representative photos and weight of tumors harvested on day 16 (right panel). N = 5 for both groups. G) Immune profiling of tumor‐infiltrating cells by flow cytometry, depicting the percentages of CD4+ cells, CD8+ cells, NK cells, M1 TAMs, and MDSCs in siGsdmc‐treated versus siNC‐treated tumors. The indicated percentage represents the proportion of live cells. N = 5 for both groups. H) Representative images of liver metastases and enumeration of lung and liver metastases. I) Kaplan Meier analysis for overall survival of siGsdmc‐treated (n = 7) versus siNC‐treated (n = 8) mice. Statistical analysis was performed using the log‐rank test. *p < 0.05 and **p < 0.01; Mann–Whitney U test, two‐tailed. Please also see Figure S8 (Supporting Information).
Figure 9
Figure 9
Combined inhibition of Gsdmc and KRAS delays PDAC progression. A) Schematic illustrating the treatment strategy for siGsdmc and KRASG12D protein inhibition using MRTX1133 in an orthotopic murine PDAC model, either as single treatment or in combination. MRTX1133 was administered twice daily, while siGsdmc was injected every other day. B) Representative bioluminescence analysis comparing mice treated with control, siGsdmc (siGs) alone, MRTX1133 (MR) alone, or their combination over 6 weeks (W1 to W6). C) Follow‐up of tumor progression by IVIS as an indicator of tumor load. D) Survival analysis, E) tumor weight, and F) metastatic burden according to allocated treatment regimens. G) Top panel shows representative immunohistochemistry for the expression of the cancer stem cell marker CD44 (upper left), along with quantification of CD44+ area and intensity (right) in tumor tissue of mice treated with the combination of siGsdmc and MRTX1133 versus MRTX1133 alone. Middle and lower panels show representative immunohistochemistry for tumor‐infiltrating CD4+ and CD8+ T cells (left), with corresponding quantification (right) by the combination treatment versus MRTX1133 alone; n = 6. H) Expression levels of the stemness gene Sox2 according to allocated treatment. *p < 0.05, **p < 0.01, and ***p < 0.001; Mann–Whitney U test, two‐tailed, unless stated otherwise.

References

    1. Sung H., Ferlay J., Siegel R. L., Laversanne M., Soerjomataram I., Jemal A., Bray F., CA Cancer J. Clin. 2021, 71, 209. - PubMed
    1. Arnold M., Abnet C. C., Neale R. E., Vignat J., Giovannucci E. L., McGlynn K. A., Bray F., Gastroenterology. 2020, 159, 335. - PMC - PubMed
    1. G. P. C. Collaborators , Lancet Gastroenterol. Hepatol. 2017, 4, 934.
    1. Conroy T., Desseigne F., Ychou M., Bouché O., Guimbaud R., Bécouarn Y., Adenis A., Raoul J.‐L., Gourgou‐Bourgade S., de la Fouchardière C., Bennouna J., Bachet J.‐B., Khemissa‐Akouz F., Péré‐Vergé D., Delbaldo C., Assenat E., Chauffert B., Michel P., Montoto‐Grillot C., Ducreux M., N. Engl. J. Med. 2011, 364, 1817. - PubMed
    1. Siegel R. L., Miller K. D., Jemal A., CA Cancer J. Clin. 2019, 69, 7. - PubMed

MeSH terms