. 2024 Dec 2;221(12):e20240103.
doi: 10.1084/jem.20240103. Epub 2024 Sep 19.

Interleukin-33-activated basophils promote asthma by regulating Th2 cell entry into lung tissue

Affiliations

Interleukin-33-activated basophils promote asthma by regulating Th2 cell entry into lung tissue

Martijn J Schuijs et al. J Exp Med. .

Abstract

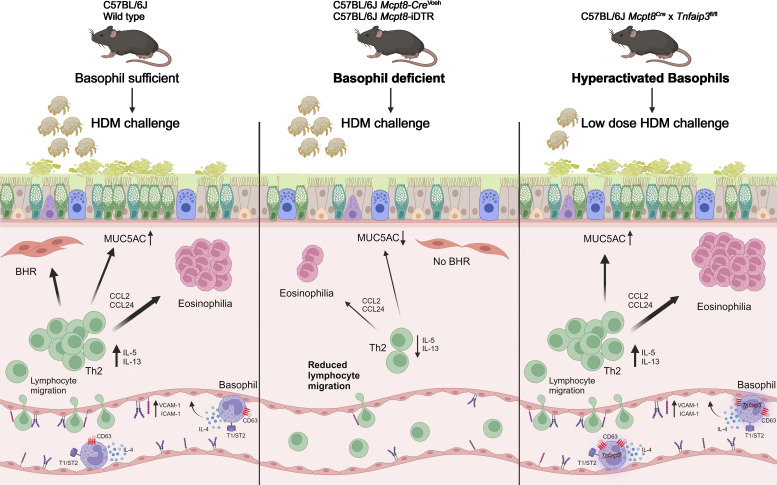
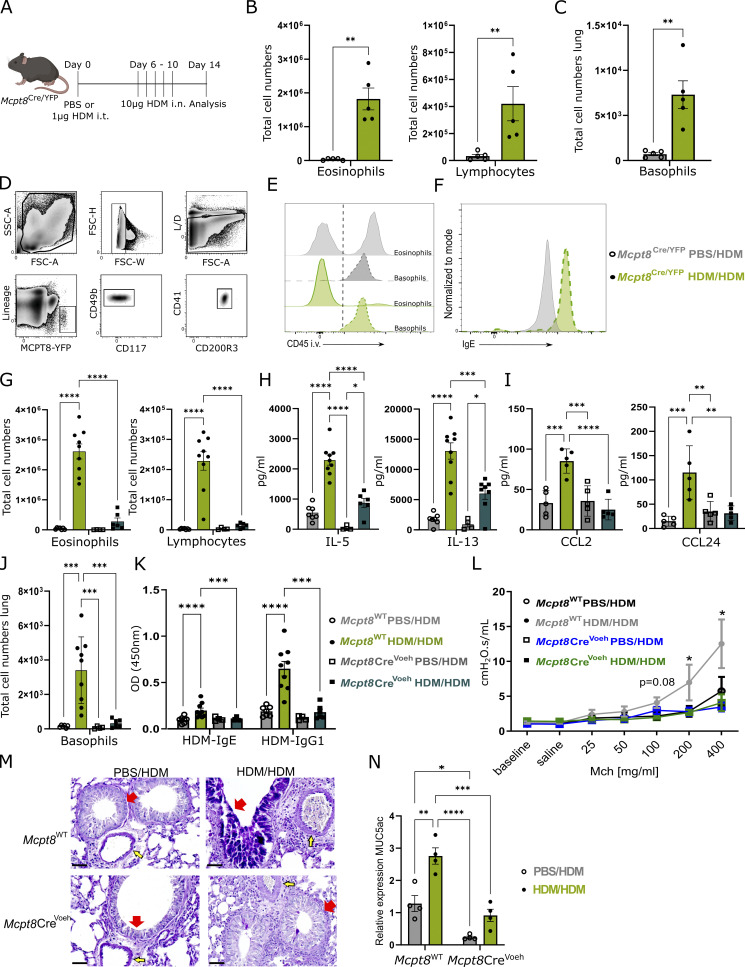
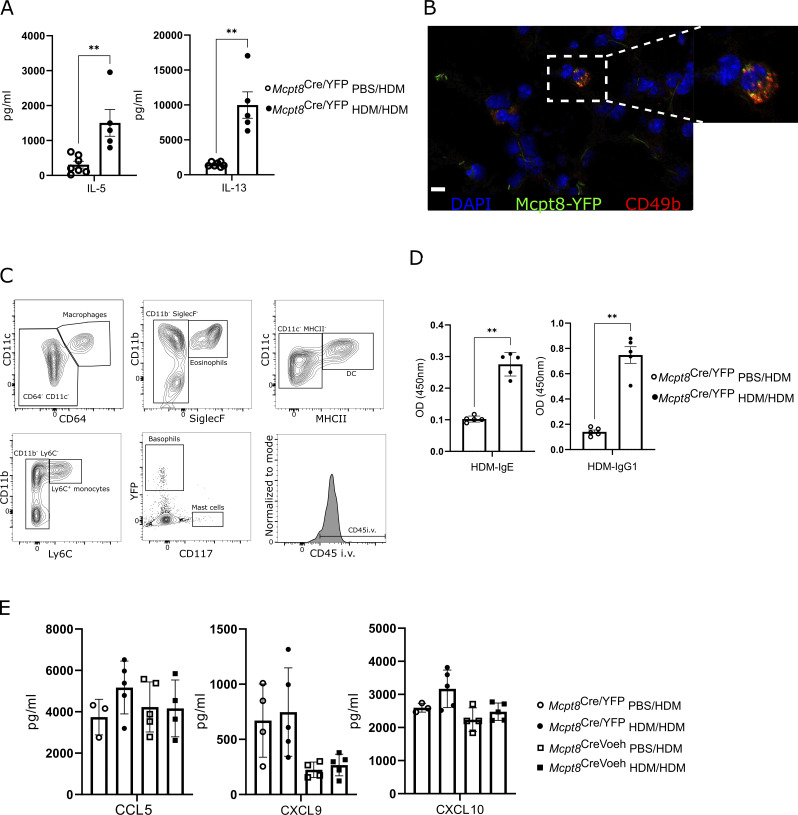
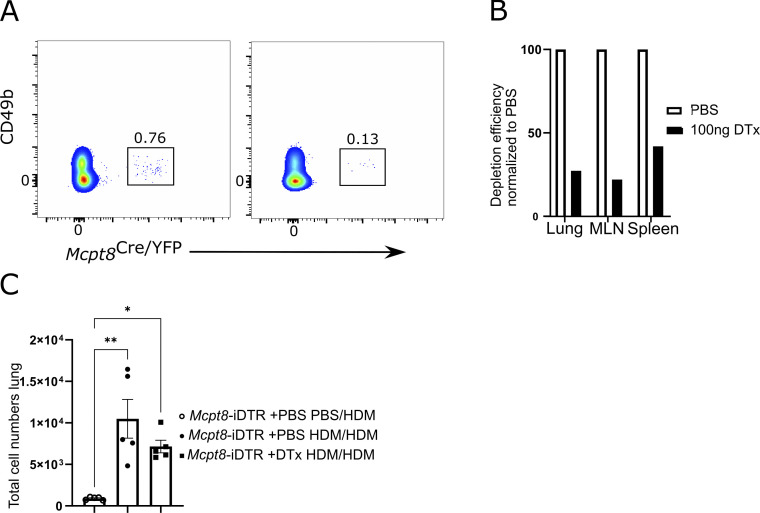
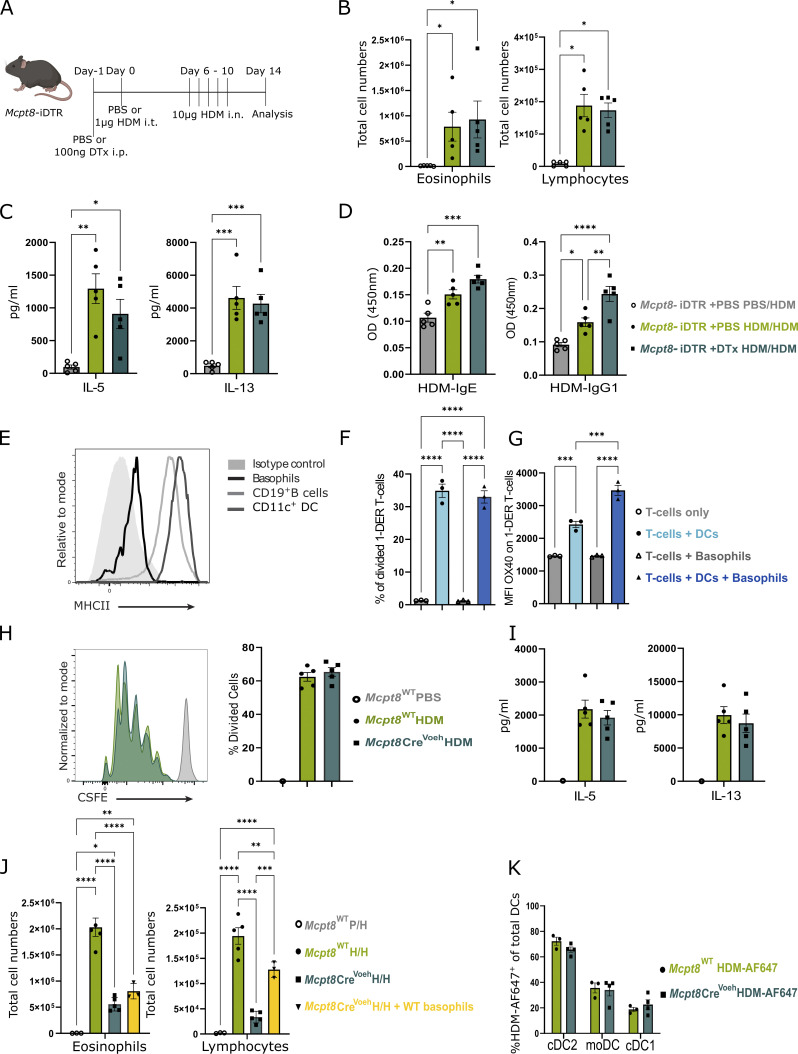
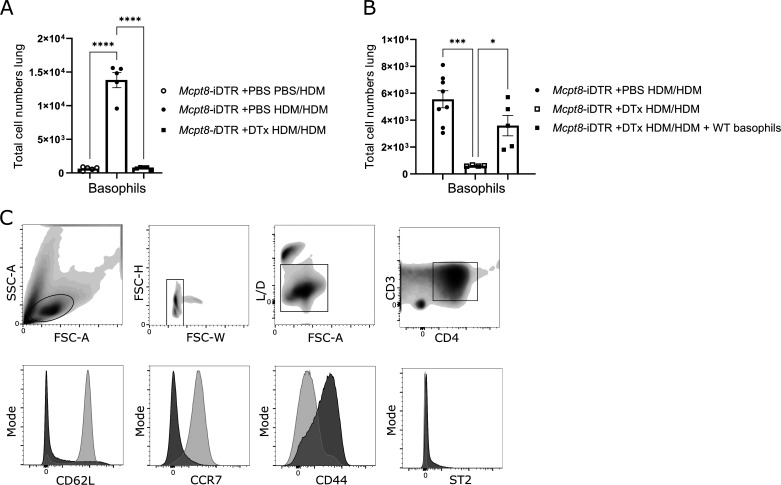
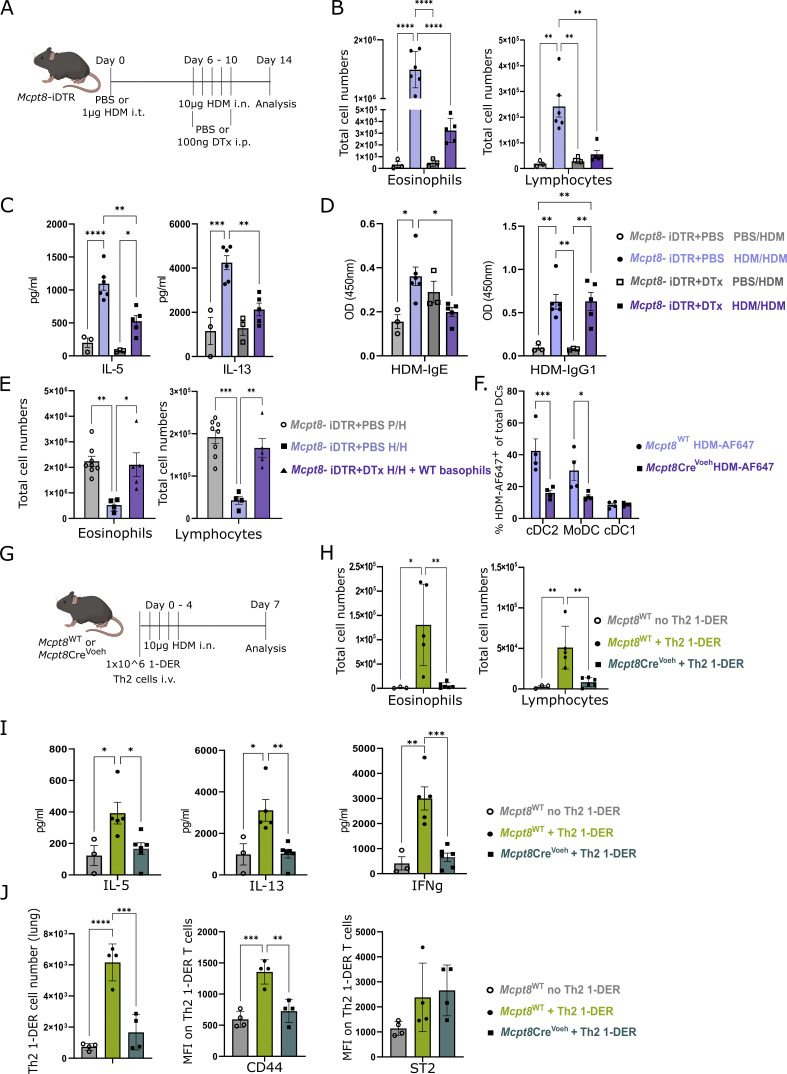
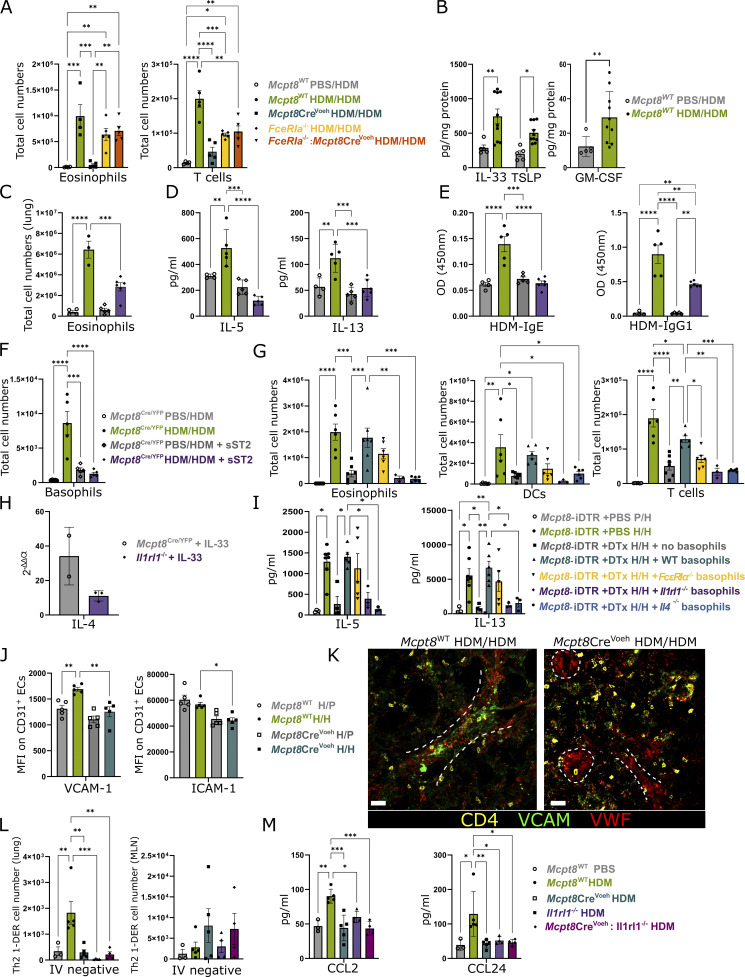
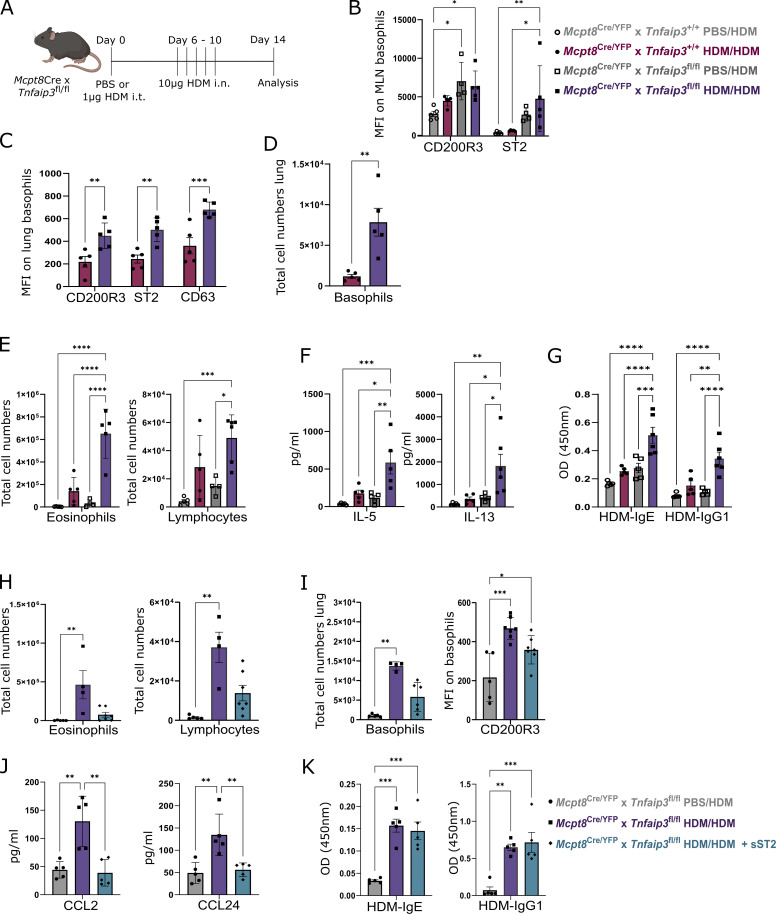
Asthma is characterized by lung eosinophilia, remodeling, and mucus plugging, controlled by adaptive Th2 effector cells secreting IL-4, IL-5, and IL-13. Inhaled house dust mite (HDM) causes the release of barrier epithelial cytokines that activate various innate immune cells like DCs and basophils that can promote Th2 adaptive immunity directly or indirectly. Here, we show that basophils play a crucial role in the development of type 2 immunity and eosinophilic inflammation, mucus production, and bronchial hyperreactivity in response to HDM inhalation in C57Bl/6 mice. Interestingly, conditional depletion of basophils during sensitization did not reduce Th2 priming or asthma inception, whereas depletion during allergen challenge did. During the challenge of sensitized mice, basophil-intrinsic IL-33/ST2 signaling, and not FcεRI engagement, promoted basophil IL-4 production and subsequent Th2 cell recruitment to the lungs via vascular integrin expression. Basophil-intrinsic loss of the ubiquitin modifying molecule Tnfaip3, involved in dampening IL-33 signaling, enhanced key asthma features. Thus, IL-33-activated basophils are gatekeepers that boost allergic airway inflammation by controlling Th2 tissue entry.


Conflict of interest statement

Disclosures: The authors declare no competing interests exist.

Figures

None
Graphical abstract
Figure 1.
Figure 1.
Basophils are required for HDM-induced eosinophilic inflammation. (A) Mcpt8Cre/YFP reporter mice were sensitized i.t. (1 µg) with HDM extract or PBS, as control, at day 0. Mice were then challenged i.n. with 10 µg HDM extract daily between day 6 and 10, and on day 14 BAL was performed and lungs were taken for further analysis. (B) Shown are the numbers of eosinophils and lymphocytes present in BAL as assessed by flow cytometry. (C) Basophil numbers in the lung were measured by flow cytometry. (D) Gating strategy used for the identification of basophils by flow cytometry. (E) CD45 intravascular staining of basophils compared with eosinophils in lungs, as measured by flow cytometry. (F) Flow cytometric analysis of IgE binding to basophils. (G) Eosinophil and lymphocyte numbers in BAL are shown for Mcpt8CreVoeh or littermate controls. (H) Graphs show the amount of IL-5 and IL-13 in supernatant of restimulated MLN cells, as measured by ELISA. (I) Measurement of CCL2 and CCL24 chemokines in BAL supernatant of Mcpt8CreVoeh or littermate controls. (J) Flow cytometric analysis of lung basophils in Mcpt8CreVoeh mice and littermate controls. (K) Concentration of HDM-specific IgE and IgG1 in serum measured by ELISA. (L) Graph shows the increase in airway resistance of Mcpt8CreVoeh compared with littermate controls after PBS or HDM exposure. (M) PAS staining of PBS or HDM-challenged lungs, red arrows point to airways, and yellow arrows indicate vessels. Scale bar = 30 µm. (N) Normalized gene expression of MUC5ac. One representative of three independent experiments, all of which gave similar results (B–F, I, and L–N) with five mice per group and for (L) six mice per group, or pooled data of two independent experiments (G, H, J, and K), with 7–10 mice per group is shown. Data are means ± SEM. *P < 0.05; **P < 0.01; ***P < 0.001; ****P < 0.0001. Student’s t test (B and C), ordinary ANOVA (G–J and L), or two-way ANOVA (K and N).
Figure S1.
Figure S1.
Analysis of basophils in a house dust mite model of asthma. (A) IL-5 and IL-13 levels in the supernatant of restimulated MLN cells, as measured by ELISA. (B) Confocal microscopy image of the lung basophils with staining for Mcpt8-YFP (green), CD49b (red), and nuclear stain (blue). Scale bar = 10 µm. (C) Flow cytometric gating strategy for lung basophils using the Mcpt8Cre/YFP reporter mouse and intravascular CD45 labeling. (D) HDM-specific IgG1 and IgE concentration in serum, as measured by ELISA. (E) Chemokine levels as measured in BAL. One representative of three independent experiments, all of which gave similar results, with five to seven mice per group is shown. Data are means ± SEM. **P < 0.01. Student’s t test (A and D) or ordinary ANOVA (E).
Figure S2.
Figure S2.
Validation of basophil depletion. (A) Representative flow plot of lung basophil depletion after DTx administration. (B) Basophil depletion efficiency 3 days after 100 ng DTx injection, normalized to PBS, in lung, MLN, and spleen. (C) Basophil numbers 14 days post depletion with 100 ng DTx during sensitization. One representative of three independent experiments, all of which gave similar results, with five mice per group is shown. Data are means ± SEM. *P < 0.05; **P < 0.01. Ordinary ANOVA (C).
Figure 2.
Figure 2.
Basophils are redundant for Th2 priming to inhaled HDM allergen. (A) Mcpt8-iDTR mice received PBS or 100 ng DTx i.p. 1 day before sensitization with 1 µg HDM extract and were subsequently challenged i.n. with 10 µg HDM extract daily from day 6 till 10 and sacrificed on day 14. (B) Eosinophil and lymphocyte numbers in BAL at day 14. (C and D) Graphs show levels of IL-5 and IL-13 in supernatant of restimulated MLN cells and serum concentration of HDM-specific IgE and IgG1, respectively, as measured by ELISA. (E) MHCII expression by basophils compared with CD19+ B cells and CD11c+ DCs, as measured by flow cytometry. (F and G) In vitro co-culture of 1-DER T cells with sorted basophils and DCs, graphs show 1-DER proliferation (F) by analysis of CFSE content and OX40 expression levels (G) after 3 days of culture. (H) Proliferation of adoptively transferred 1-DER T cells labeled with CFSE, measured 3 days after single HDM (10 µg) injection in Mcpt8CreVoeh or littermate controls. (I) Cytokine production from MLNs of mice receiving 1-DER T cells, collected 3 days after HDM injection. (J) Graphs show differential eosinophil and lymphocyte cell count in BAL after adoptive transfer of in vitro cultured WT BM basophils into Mcpt8CreVoeh at the time of sensitization. (K) Percentage of HDM-AF647 positive DCs within the MLN 24 h after HDM-AF647 i.n. instillation. One representative of three independent experiments, all of which gave similar results, with three to five mice per group is shown. Data are means ± SEM. *P < 0.05; **P < 0.01; ***P < 0.001; ****P < 0.0001. Ordinary ANOVA (B–D, F, G, and J).
Figure S3.
Figure S3.
Validation and kinetics of basophil depletion in conditional basophil depleter mice. (A) Basophil numbers in the lung 4 days after depletion during the challenge phase. (B) Basophil numbers in the lung 8 days after transfer. (C) Flow cytometry gating strategy to identify and phenotype transferred Th2 1-DER T cells compared to naïve CD4+ 1-DER T cells. One representative of three independent experiments, all of which gave similar results, with five to eight mice per group is shown. Data are means ± SEM. *P < 0.05; ***P < 0.001; ****P < 0.0001. Ordinary ANOVA (A and B).
Figure 3.
Figure 3.
Basophils exert their main function during lung allergen challenge. (A) Mcpt8-iDTR mice were administered with PBS or 100 ng DTx every other day selectively during the HDM challenge. (B) Numbers of eosinophils and lymphocytes from BAL were measured at day 14. (C and D) Graphs show IL-5 and IL-13 levels in supernatant of restimulated MLN cells and concentration of HDM-specific IgE and IgG1 in serum, respectively. (E) BAL cell analysis after adoptive transfer of ex vivo cultured WT BM basophils into Mcpt8-iDTR mice just before challenge. (F) Percentage of HDM-AF647 positive DCs in MLN 24 h after challenge. (G) Mcpt8CreVoeh or littermate controls received 1 × 10⁶ Th2-polarized 1-DER T cells 1 day before 10 µg HDM i.n. daily challenge between day 0 and 4. (H) Differential cell counts of Mcpt8CreVoeh or littermate controls that received Th2-polarized 1-DER T cells and HDM challenge. (I) Cytokine production from restimulated MLN cell supernatant of mice that received Th2-polarized 1-DER T cells. (J) Flow cytometry analysis of 1-DER Th2 cells in the lungs of HDM-challenged mice and the expression of CD44 and ST2. One representative of three independent experiments, all of which gave similar results, with three to eight mice per group is shown. Data are means ± SEM. *P < 0.05; **P < 0.01; ***P < 0.001; ****P < 0.0001. Ordinary ANOVA (B–F and H–J) and two-way ANOVA (F).
Figure 4.
Figure 4.
IL-33–activated basophils producing IL-4 control type 2 immunity during HDM challenge. (A) Analysis of BAL eosinophil and T cell numbers in BM chimeric mice with selective FcεRIα deficiency. (B) Level of epithelial alarmins in lung homogenates after HDM stimulation. (C–E) Mice were treated i.n. with 10 μg sST2 during HDM exposure and eosinophil numbers in BAL were measured at day 14 (C). (D) Graphs show the levels of IL-5 and IL-13 in lung homogenates, as measured by ELISA. (E and F) (E) Serum concentrations of HDM-specific immunoglobulins and (F) basophil numbers in the lungs. (G) Reconstitution of Mcpt8-iDTR basophil depleted mice during challenge, with various in vitro cultured BM basophils from different genotypes at challenge; the graphs show cell numbers of eosinophils, DCs, and T cells in BAL after HDM sensitization and challenge. (H) IL-4 expression levels from in vitro cultured Mcpt8Cre/YFP or Il1rl1−/− basophils stimulated with PBS or Il-33 for 24 h, as determined by RT-qPCR. (I) Cytokine production by MLN cells restimulated with HDM for 3 days ex vivo. (J) Flow cytometric analysis of VCAM and ICAM expression on CD31+ endothelial cells in Mcpt8CreVoeh or littermate controls. (K) Confocal image shows VCAM expression on vessels of Mcpt8CreVoeh or littermate controls. (L) Enumeration of CD45iv negative 1-DER Th2 cells in the lungs and MLN of various BM chimeric mice after HDM challenge. (M) Graphs show chemokines CCL2 and CCL24 measurement in BAL of various BM chimeric mice after HDM challenge. One representative of three independent experiments, all of which gave similar results (A and C–M) with two to seven mice per group or pooled data of two independent experiments (B) with five to ten mice per group is shown. Data are means ± SEM. *P < 0.05; **P < 0.01; ***P < 0.001; ****P < 0.0001. Ordinary ANOVA (A, C–G, I, J, L, and M) and two-way ANOVA (B).
Figure S4.
Figure S4.
Flow cytometry gating strategy to asses ST2 expression and intravascular labeling on various immune cells. (A) Flow cytometry analysis of ST2 expression on CD4+ T cells, ILC2s, and basophils. (B) Lung mast cell and ILC2 numbers of mice treated with sST2 at day 14 after sensitization. (C) Flow cytometry gating strategy showing for basophil identification in lung. Graph depicts basophil numbers in lung 14 days after reconstitution. (D) Flow cytometry gating strategy of Th2 CD4+ T cells with CD45 intravascular staining. One representative of three independent experiments, all of which gave similar results, with three to five mice per group is shown. Data are means ± SEM. *P < 0.05; **P < 0.01.
Figure S5.
Figure S5.
PCR-based analysis of Mcpt8Cre/YFP and Tnfaip3fl/fl genotype in KO, Hz, and WT mice, respectively. (A) Mcpt8-WT band size of 314 base pairs (bp) and Mcpt8-Cre band size of 478 bp. Tnfaip3-WT band size of 160 bp and Tnfaip3-floxed band size of 250 bp. Source data are available for this figure: SourceData FS5.
Figure 5.
Figure 5.
Uncontrolled activation of basophils exacerbates mild asthma. (A) Schematic representation of Mcpt8Cre × Tnfaip3fl/fl treatment with 1ug HDM during challenge. (B and C) (B) Flow cytometric analysis of CD200R3 and ST2 expression on MLN basophils and (C) CD200R3, ST2, and CD63 on lung basophils after low-dose HDM challenge. (D) Representative flow cytometric analysis of lung basophil numbers in Mcpt8Cre × Tnfaip3fl/fl or littermate controls. (E–G) Graphs show differential cell count of eosinophils and lymphocytes in BAL (E), cytokine production in the supernatant of ex vivo restimulated MLN cells (F), and levels of serum HDM-specific IgE and IgG1 (G). (H) Mcpt8Cre × Tnfaip3fl/fl were treated i.n. with 10 μg sST2 during HDM exposure and eosinophil and lymphocyte numbers in BAL were measured at day 14. (I) Flow cytometric analysis of total basophils on the lung and their expression of CD200R3. (J and K) Graphs show chemokine levels in BAL at day 14 (J) or concentration of immunoglobulins in serum (K). One representative of three independent experiments, all of which gave similar results, with four to six mice per group is shown. Data are means ± SEM. *P < 0.05; **P < 0.01; ***P < 0.001; ****P < 0.0001. Student’s t test (D), ordinary ANOVA (E, F, and H–K) and two-way ANOVA (B, C, and G).

Similar articles

Cited by

References

    1. Aegerter, H., and Lambrecht B.N.. 2023. The pathology of asthma: What is obstructing our view? Annu. Rev. Pathol. 18:387–409. 10.1146/annurev-pathol-042220-015902 - DOI - PubMed
    1. Braman, S.S. 2006. The global burden of asthma. Chest. 130:4S–12S. 10.1378/chest.130.1_suppl.4S - DOI - PubMed
    1. Brooks, C.R., van Dalen C.J., Hermans I.F., Gibson P.G., Simpson J.L., and Douwes J.. 2017. Sputum basophils are increased in eosinophilic asthma compared with non-eosinophilic asthma phenotypes. Allergy. 72:1583–1586. 10.1111/all.13185 - DOI - PubMed
    1. Chan, L.S., Robinson N., and Xu L.. 2001. Expression of interleukin-4 in the epidermis of transgenic mice results in a pruritic inflammatory skin disease: An experimental animal model to study atopic dermatitis. J. Invest. Dermatol. 117:977–983. 10.1046/j.0022-202x.2001.01484.x - DOI - PubMed
    1. Cheng, L.E., Hartmann K., Roers A., Krummel M.F., and Locksley R.M.. 2013. Perivascular mast cells dynamically probe cutaneous blood vessels to capture immunoglobulin E. Immunity. 38:166–175. 10.1016/j.immuni.2012.09.022 - DOI - PMC - PubMed

MeSH terms

Substances