. 2024 Jul 25;25(5):bbae466.
doi: 10.1093/bib/bbae466.

Novel systems biology experimental pipeline reveals matairesinol's antimetastatic potential in prostate cancer: an integrated approach of network pharmacology, bioinformatics, and experimental validation

Affiliations

Novel systems biology experimental pipeline reveals matairesinol's antimetastatic potential in prostate cancer: an integrated approach of network pharmacology, bioinformatics, and experimental validation

Rama Rajadnya et al. Brief Bioinform. .

Abstract

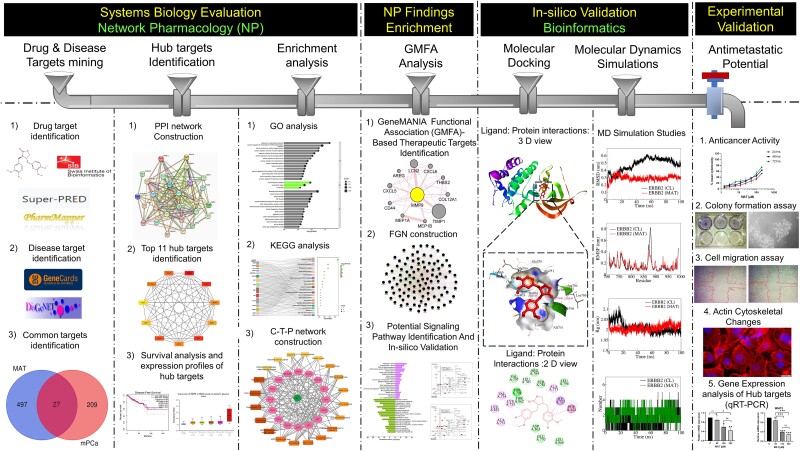
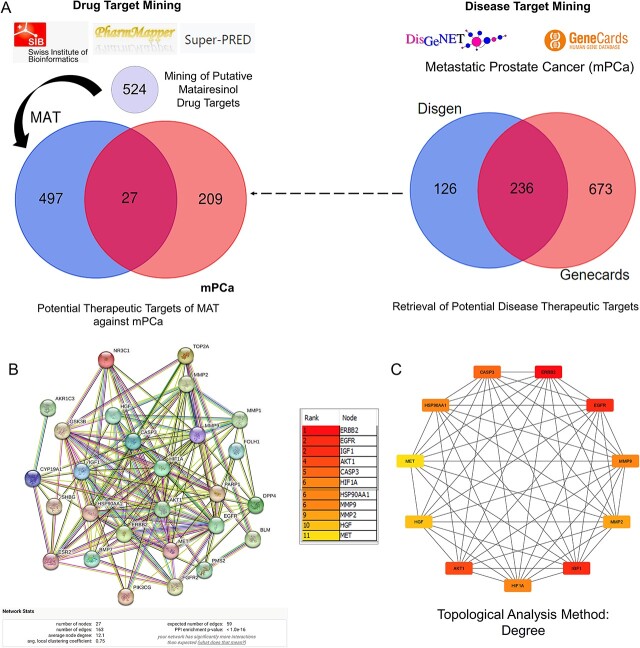
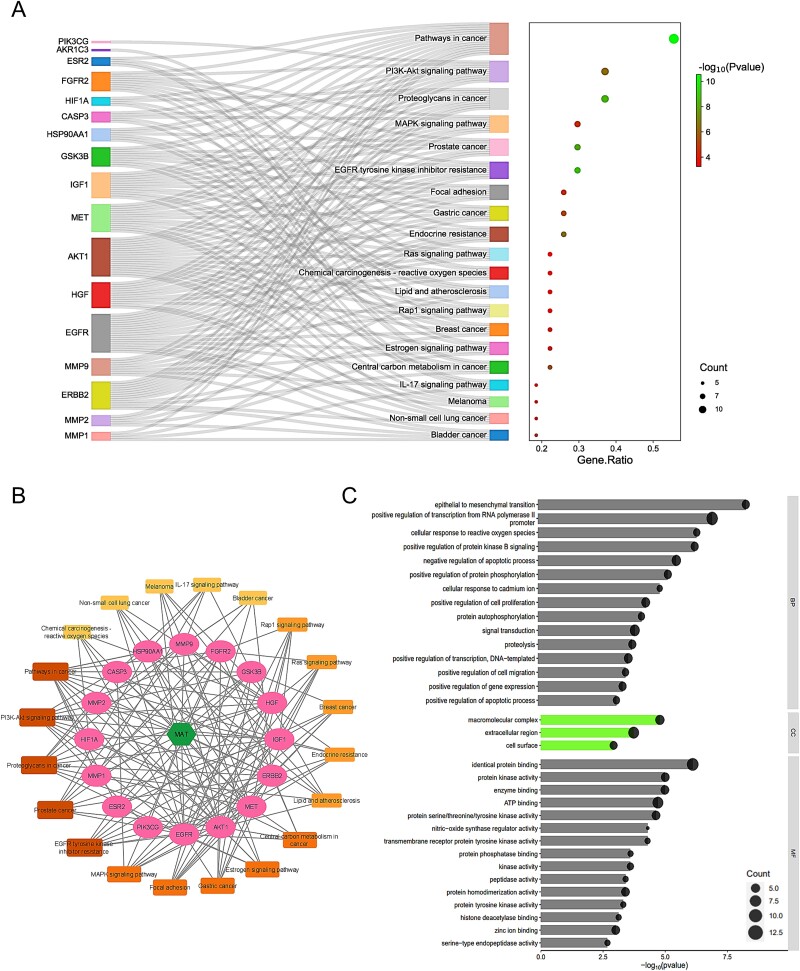
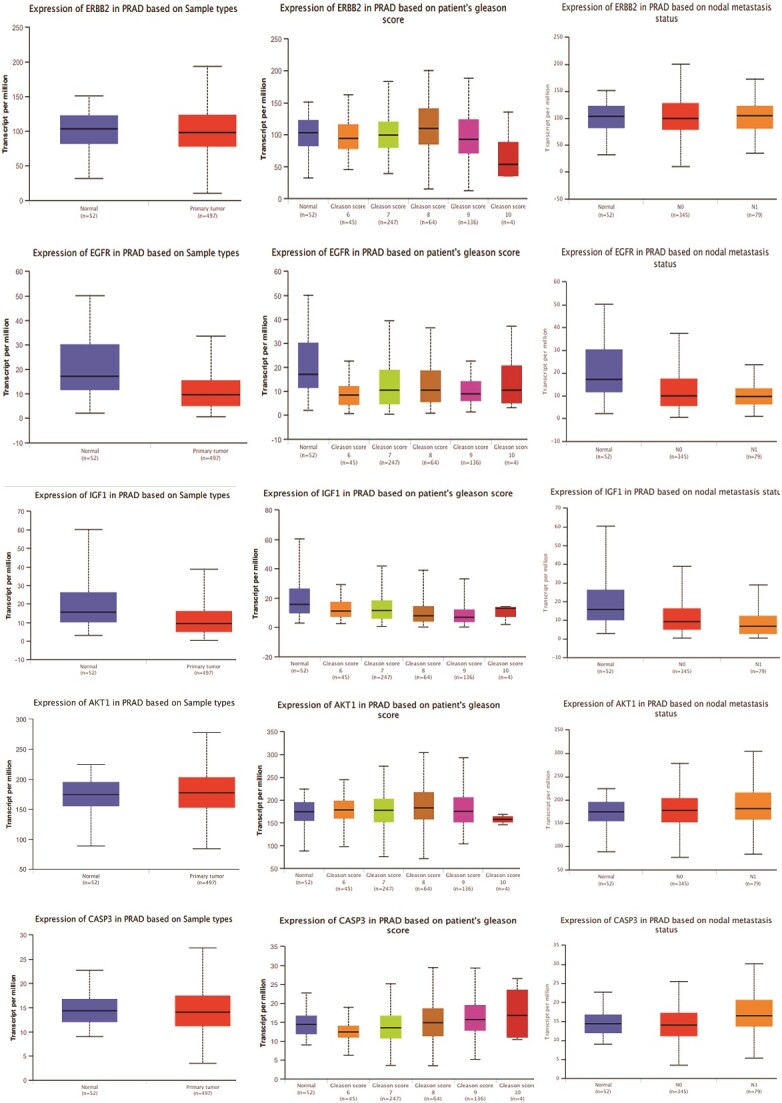
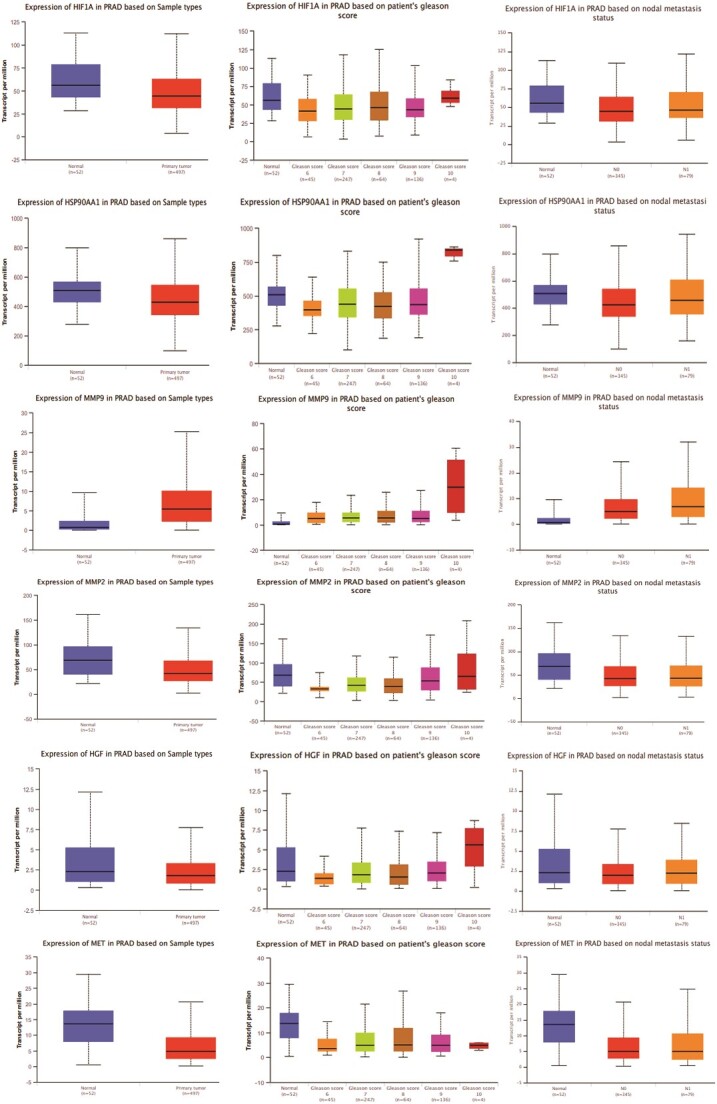
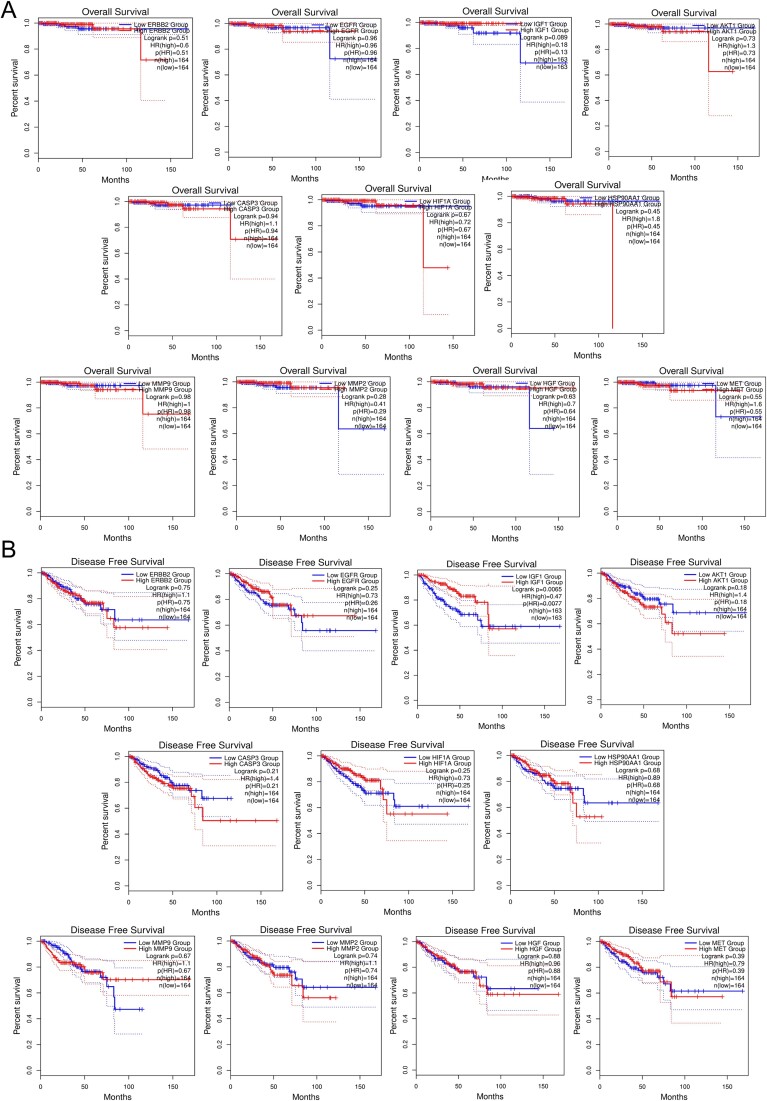
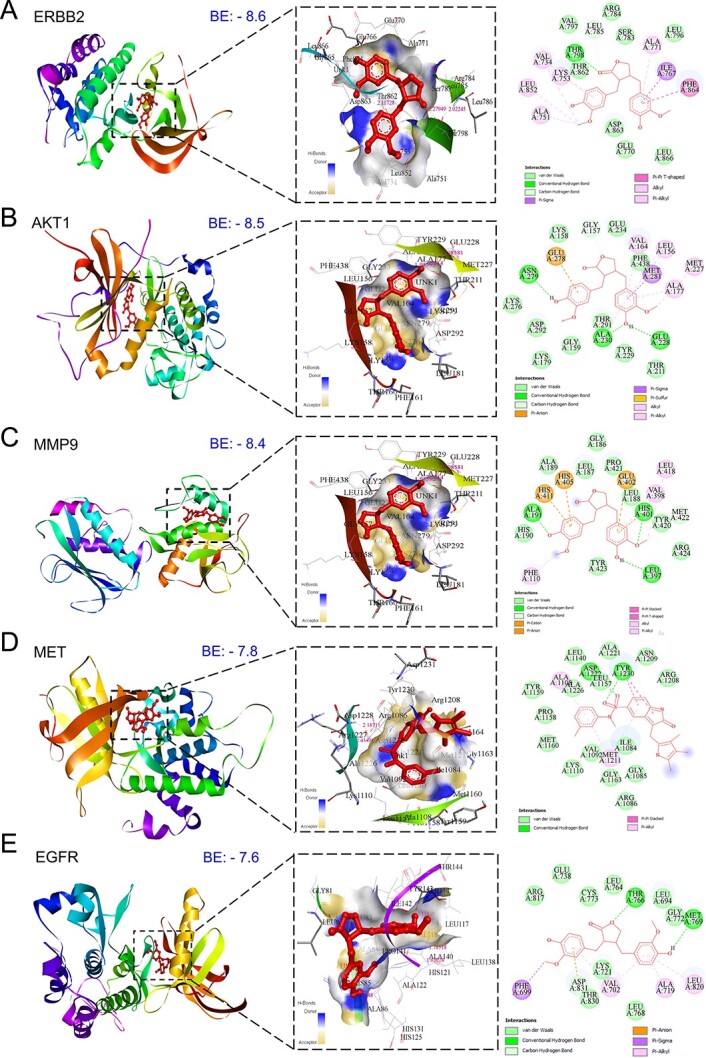
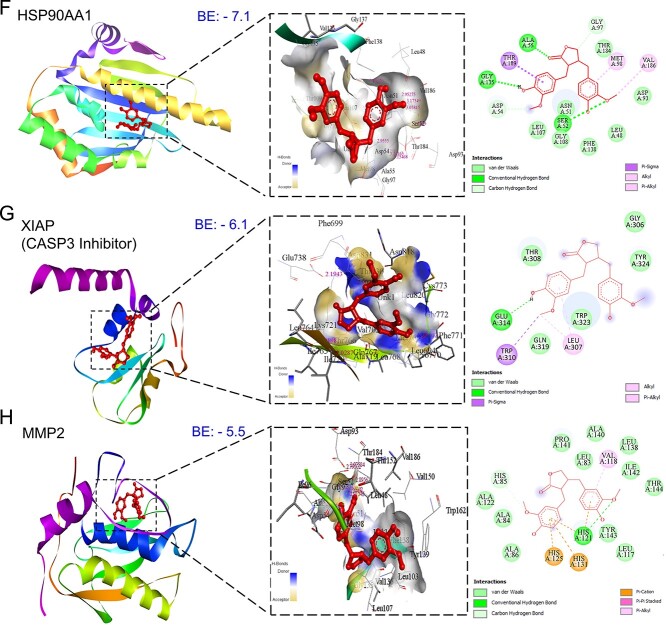
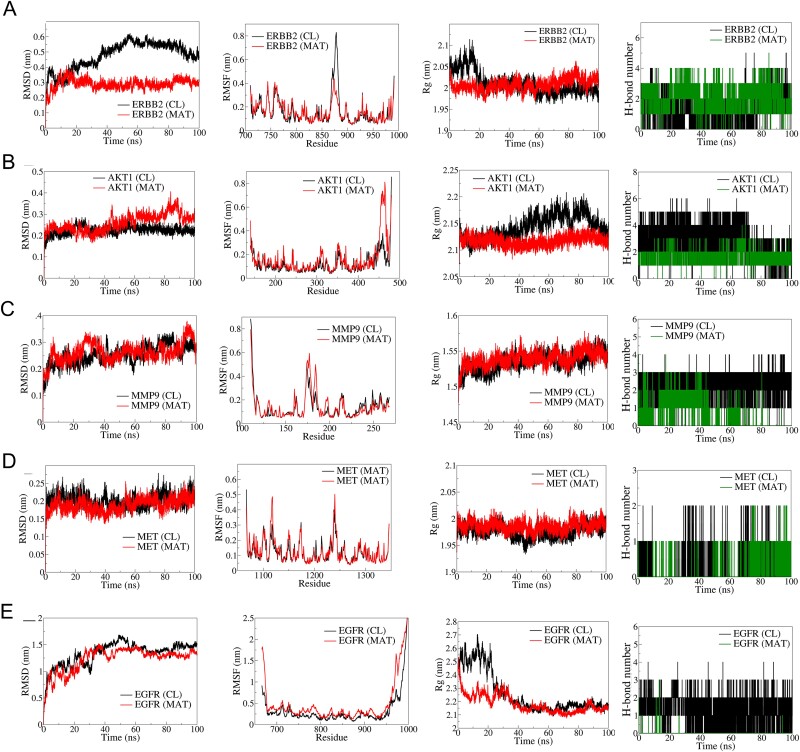
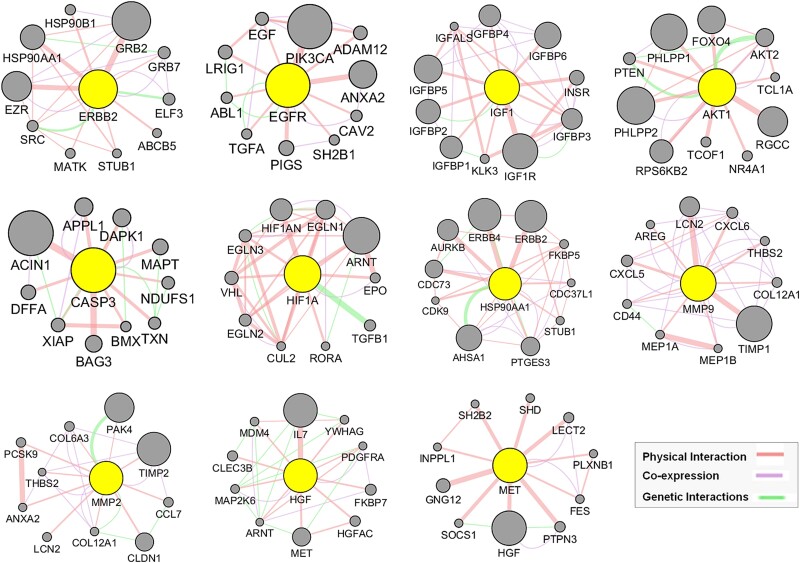
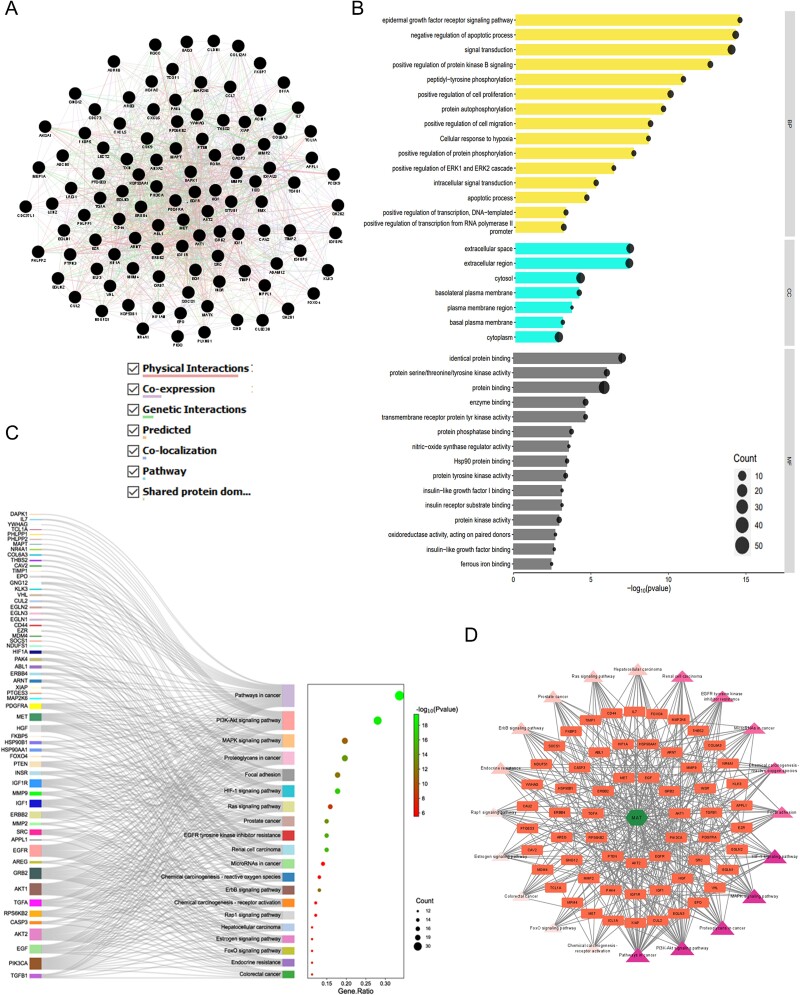
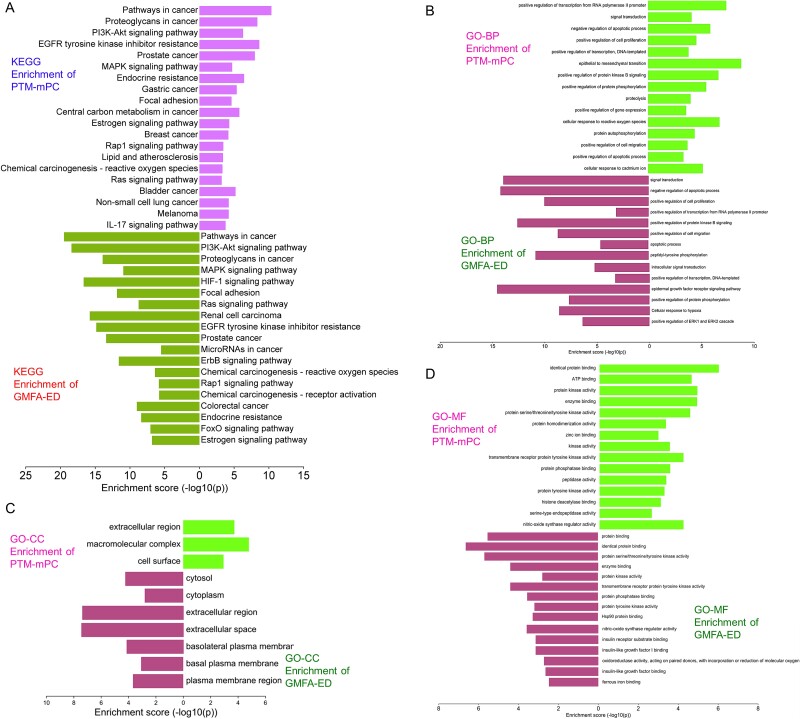
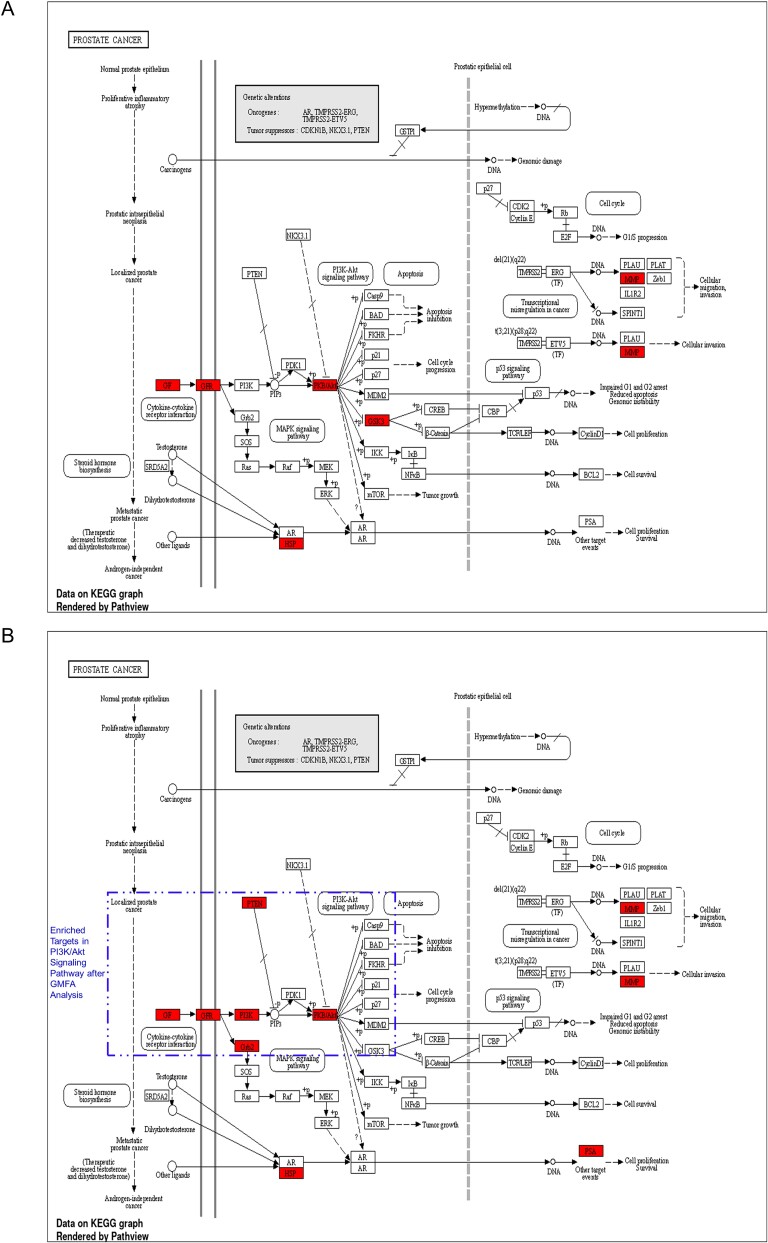
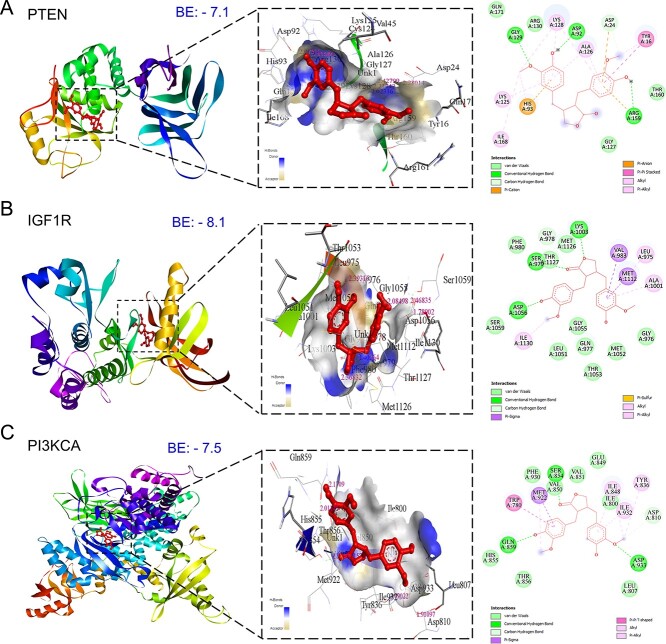
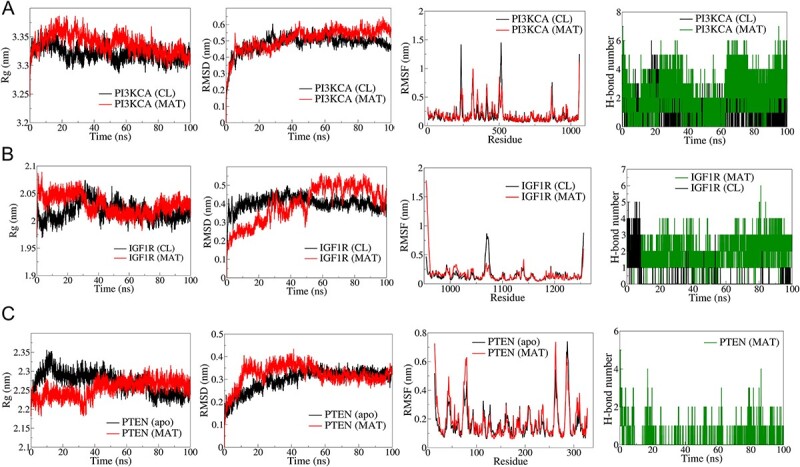
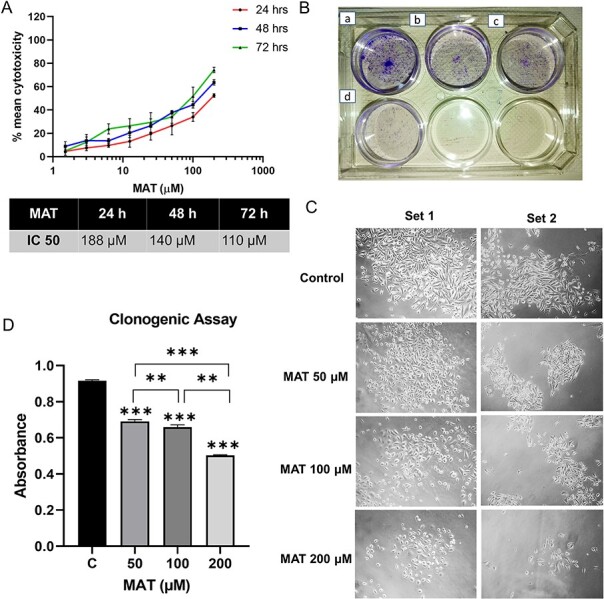
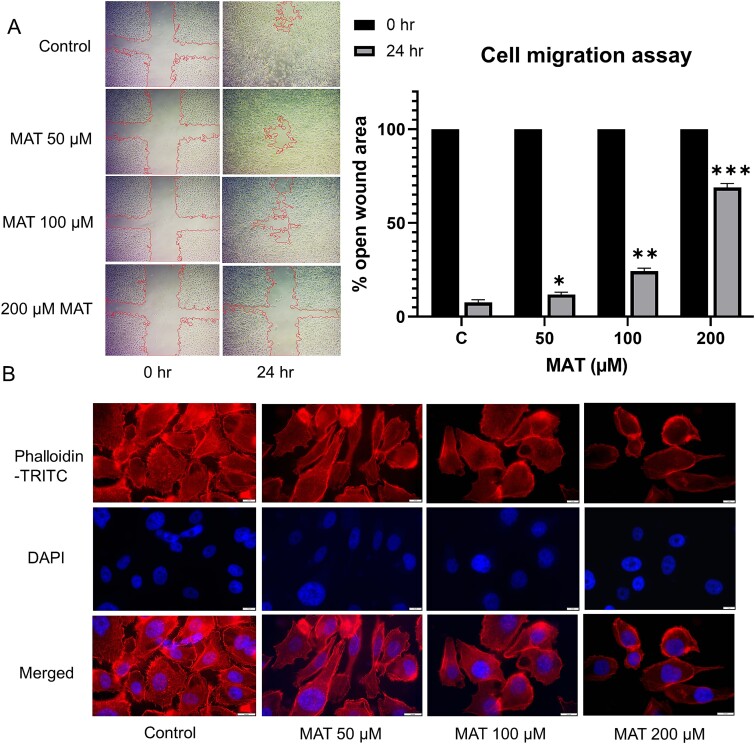
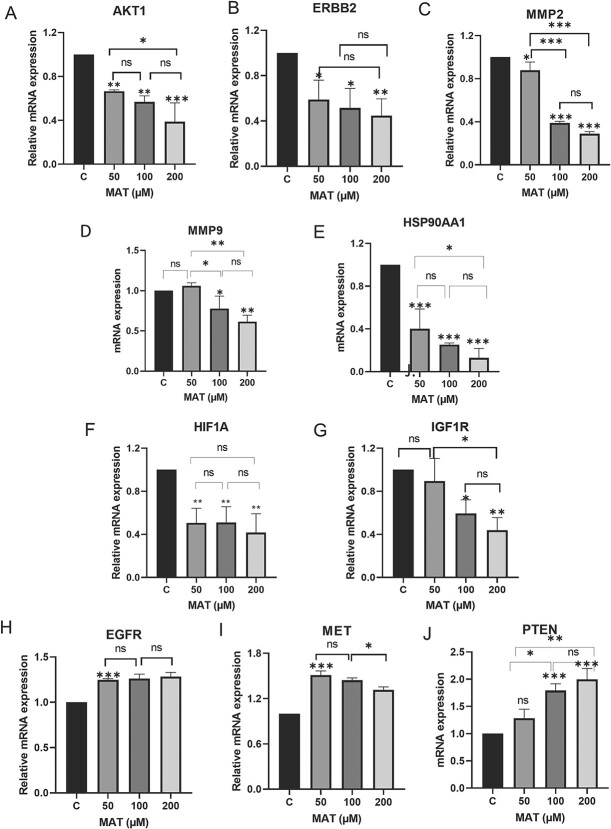
Matairesinol (MAT), a plant lignan renowned for its anticancer properties in hormone-sensitive cancers like breast and prostate cancers, presents a promising yet underexplored avenue in the treatment of metastatic prostate cancer (mPC). To elucidate its specific therapeutic targets and mechanisms, our study adopted an integrative approach, amalgamating network pharmacology (NP), bioinformatics, GeneMANIA-based functional association (GMFA), and experimental validation. By mining online databases, we identified 27 common targets of mPC and MAT, constructing a MAT-mPC protein-protein interaction network via STRING and pinpointing 11 hub targets such as EGFR, AKT1, ERBB2, MET, IGF1, CASP3, HSP90AA1, HIF1A, MMP2, HGF, and MMP9 with CytoHuba. Utilizing DAVID, Gene Ontology (GO) analysis highlighted metastasis-related processes such as epithelial-mesenchymal transition, positive regulation of cell migration, and key Kyoto Encyclopedia of Genes and Genomes (KEGG) pathways, including cancer, prostate cancer, PI3K-Akt, and MAPK signaling, while the web resources such as UALCAN and GEPIA2 affirmed the clinical significance of the top 11 hub targets in mPC patient survival analysis and gene expression patterns. Our innovative GMFA enrichment method further enriched network pharmacology findings. Molecular docking analyses demonstrated substantial interactions between MAT and 11 hub targets. Simulation studies confirmed the stable interactions of MAT with selected targets. Experimental validation in PC3 cells, employing quantitative real-time reverse-transcription PCR and various cell-based assays, corroborated MAT's antimetastatic effects on mPC. Thus, this exhaustive NP analysis, complemented by GMFA, molecular docking, molecular dynamics simulations, and experimental validations, underscores MAT's multifaceted role in targeting mPC through diverse therapeutic avenues. Nevertheless, comprehensive in vitro validation is imperative to solidify these findings.

Keywords: PC3 cells; matairesinol; metastatic prostate cancer (mPC); molecular docking; molecular dynamics; network pharmacology.


Figures

Graphical Abstract
Graphical Abstract
Figure 1
Figure 1
Process of identifying potential targets of MAT against mPC, constructing the PPI network, and determining the top 11 hub targets. (A) Identification of PTM-mPC. (B) Construction and analysis of the interactive PPI network using the STRING database, involving the 27 PTM-mPC. (C) Identification of the top 11 hub targets of MAT against mPC using the CytoHubba plug-in in Cytoscape, applying the degree topological analysis method.
Figure 2
Figure 2
GO, KEGG enrichment analysis, and compound–targets–pathways network of MAT targets against mPC. (A) Sankey diagram for KEGG enrichment analysis of top 20 signaling pathways of MAT against mPC. (B) Compound–targets–pathways network illustrating the interactions between MAT and its targets in mPC. (C) GO enrichment analysis showing top BP, CC, and MF functional attributes of MAT’s targets against mPC.
Figure 3
Figure 3
Gene expression patterns of top 11 hub targets across normal and tumor tissues of PRAD based on sample types, patient’s Gleason score, and nodal metastasis status obtained from the UALCAN platform.
Figure 3
Figure 3
Gene expression patterns of top 11 hub targets across normal and tumor tissues of PRAD based on sample types, patient’s Gleason score, and nodal metastasis status obtained from the UALCAN platform.
Figure 4
Figure 4
Survival analysis predicting the relationship between gene expression patterns of top 11 hub targets and patient survival outcomes in PRAD. (A) OS analysis. (B) DFS analysis.
Figure 5
Figure 5
Three-dimensional and two-dimensional docking patterns and interactions of MAT with the hub targets. (A) ERBB2, (B) AKT1, (C) MMP9, (D) MET, (E) EGFR (F) HSP90AA1, (G) XIAP, and (H) MMP2.
Figure 5
Figure 5
Three-dimensional and two-dimensional docking patterns and interactions of MAT with the hub targets. (A) ERBB2, (B) AKT1, (C) MMP9, (D) MET, (E) EGFR (F) HSP90AA1, (G) XIAP, and (H) MMP2.
Figure 6
Figure 6
Results of molecular dynamics (MD) simulation analysis illustrating root mean square deviation (RMSD), root mean square fluctuation (RMSF), radius of gyration (Rg), and number of H bonds for five distinct MAT–proteins and cocrystal ligand–protein complexes: (A) ERBB2, (B) AKT1, (C) MMP9, (D) MET, and (E) EGFR.
Figure 7
Figure 7
GeneMANIA functional association (GMFA) network analysis illustrating functionally related genes associated with the top 11 hub targets of MAT and the creation of the expanded potential target database against mPC (GMFA-ED).
Figure 8
Figure 8
GO, KEGG enrichment analysis, and compound–targets–pathways network of MAT targets identified in GMFA-ED data set. (A) FGN of all 112 genes, identified as new potential targets of MAT against mPC. (B) The bar-dot plot of the top 15 GO-BP, GO-CC, and GO-MF terms with enriched targets of MAT. (C) Sankey diagram for KEGG enrichment analysis of top 20 signaling pathways of MAT against mPC. (D) Compound–targets–pathways network illustrating the interactions between MAT and its GMFA-based predicted targets in mPC.
Figure 9
Figure 9
Comparison of GO and KEGG enrichment of PTM-mPC versus GMFA-ED targets of MAT against mPC. (A) KEGG enrichment, (B) BP terms of GO enrichment, (C) CC terms of GO enrichment, (D) MF terms of GO enrichment.
Figure 10
Figure 10
Comparison of prostate cancer KEGG pathway enrichment between PTM-mPC and GMFA-ED. (A) KEGG pathway enrichment analysis of PTM-mPC targets for prostate cancer. (B) KEGG pathway enrichment analysis of GMFA-ED targets for prostate cancer with significant enrichment in the PI3K/Akt signaling pathway following the GMFA analysis, indicating the identification of additional relevant therapeutic targets of MAT against mPC.
Figure 11
Figure 11
Three-dimensional and two-dimensional docking patterns and interactions of MAT with the targets of the PI3K/Akt signaling pathway. (A) PTEN, (B) IGF1R, and (C) PI3KCA.
Figure 12
Figure 12
Results of molecular dynamics (MD) simulation analysis illustrating radius of gyration (Rg), root mean square deviation (RMSD), root mean square fluctuation (RMSF), and number of H bonds for three distinct MAT–proteins and cocrystal ligand–protein complexes: (A) PI3KCA, (B) IGF1R, (C) PTEN.
Figure 13
Figure 13
Impact of MAT on the proliferation and clonogenic abilities of PC3 prostate cancer cells. (A) MAT’s effects on PC3 prostate cancer cell viability were assessed through mean percent cytotoxicity in MTT assay. (B) Anchorage-dependent clonogenic assay revealing decreased colony numbers following MAT treatment. Panels depict (a) control, (b) MAT 50 μM, (c) MAT 100 μM, and (d) MAT 200 μM. (C) Inverted phase microscope images capturing morphological changes, including reduced colony size and fewer cells per colony. (D) Quantification of colony numbers through crystal violet staining and absorbance measurement at 595 nm. Values are presented as mean ± SD from three independent experiments (n = 3) with *P ≤ .05, **P ≤ .01, and ***P ≤ .001, denoting statistical significance.
Figure 14
Figure 14
Antimetastatic effect of MAT on PC3 prostate cancer cells: (A) MAT’s dose-dependent influence on cell migration was evaluated by quantifying the percent open wound area in the migration assay, visualized using an inverted microscope with a 4× objective at 24-h intervals. (B) TRITC-phalloidin fluorescence staining illustrates the dose-dependent reduction of lamellipodia and filopodia formation post-MAT treatment. Data represent mean ± SD of three independent experiments (n = 3), with *P ≤ .05, **P ≤ .01, and ***P ≤ .001, indicating statistical significance.
Figure 15
Figure 15
Effects of MAT on mRNA expression levels of hub targets identified as potential therapeutic targets of MAT against mPC. Data represent mean ± SD of three independent experiments (n = 3) conducted in triplicates, with *P ≤ .05, **P ≤ .01, and ***P ≤ .001, indicating statistical significance.

References

    1. Aliebrahimi S, Kouhsari M, Marotte D. et al. . Irradiation of localized prostate cancer in the elderly: a systematic literature review. Clin Transl Radiat Oncol 2022;35:1–8. - PMC - PubMed
    1. Sung H, Ferlay J, Siegel RL. et al. . Global Cancer Statistics 2020: GLOBOCAN estimates of incidence and mortality worldwide for 36 cancers in 185 countries. CA Cancer J Clin 2021;71:209–49. 10.3322/caac.21660. - DOI - PubMed
    1. Wong SK, Mohamad NV, Giaze TR. et al. . Prostate cancer and bone metastases: the underlying mechanisms. Int J Mol Sci 2019;20:2587. 10.3390/ijms20102587. - DOI - PMC - PubMed
    1. La Manna F, Karkampouna S, Zoni E. et al. . Metastases in prostate cancer. Cold Spring Harb Perspect Med 2019;9:1–15. - PMC - PubMed
    1. Miller DR, Ingersoll MA, Teply BA. et al. . Combination treatment options for castration-resistant prostate cancer. Prostate Cancer 2021;9:59–80. - PMC - PubMed