. 2024 Nov 4;221(11):e20240433.
doi: 10.1084/jem.20240433. Epub 2024 Sep 19.

SMARCA5-mediated chromatin remodeling is required for germinal center formation

Affiliations

SMARCA5-mediated chromatin remodeling is required for germinal center formation

Liat Stoler-Barak et al. J Exp Med. .

Abstract

The establishment of long-lasting immunity against pathogens is facilitated by the germinal center (GC) reaction, during which B cells increase their antibody affinity and differentiate into antibody-secreting cells (ASC) and memory cells. These events involve modifications in chromatin packaging that orchestrate the profound restructuring of gene expression networks that determine cell fate. While several chromatin remodelers were implicated in lymphocyte functions, less is known about SMARCA5. Here, using ribosomal pull-down for analyzing translated genes in GC B cells, coupled with functional experiments in mice, we identified SMARCA5 as a key chromatin remodeler in B cells. While the naive B cell compartment remained unaffected following conditional depletion of Smarca5, effective proliferation during B cell activation, immunoglobulin class switching, and as a result GC formation and ASC differentiation were impaired. Single-cell multiomic sequencing analyses revealed that SMARCA5 is crucial for facilitating the transcriptional modifications and genomic accessibility of genes that support B cell activation and differentiation. These findings offer novel insights into the functions of SMARCA5, which can be targeted in various human pathologies.


Conflict of interest statement

Disclosures: The authors declare no competing interests exist.

Figures
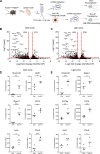
Figure 1.
Figure 1.
GC B cells are enriched in SMARCA5 mRNA transcripts during translation. (A) Scheme illustrating the experimental design. (B and C) Volcano plots showing differential gene expression following ribosomal IP (Sort-IP) in DZ (B) and LZ (C) B cells (n = 4; two independent experiments, P value < 0.05, and log2 FC >0.58 or less than −0.58; raw P values were adjusted for multiple testing using the procedure of Benjamini and Hochberg). (D and E) Graphs showing normalized reads of selected enriched genes in the Sort-IP group derived from DZ (D) or LZ (E) B cells (n = 4; two independent experiments, two-tailed Student’s t test). Each dot in the graphs represents a single mouse; *P ≤ 0.05, **P ≤ 0.01, ***P ≤ 0.001.
Figure S1.
Figure S1.
Translatome biological processes. Pathway analysis of enriched genes in DZ or LZ B cells following ribosome IP (Sort-IP) (n = 4; two independent experiments, adjusted P value < 0.05, and log2 FC > 0.58 or less than −0.58; raw P values were adjusted for multiple testing using the procedure of Benjamini and Hochberg).
Figure S2.
Figure S2.
SMARCA5 is required for proper cell division and not for cell viability. (A) SMARCA5 protein expression was determined by western blot analysis of B cells that were either left unmanipulated or stimulated with LPS. Blots show two independent biological repeats. (B) Flow cytometry histograms of all repetitions related to Fig. 3 A, and quantification of CTV in each cell division of the in vitro proliferation of B cells treated with LPS (n = 8; two independent experiments). (C) Analysis of the different cell-cycle stages in LPS stimulated B cells by EdU incorporation and 7AAD DNA staining (n = 5–6; two independent experiments, two-tailed Student’s t test; ns, not significant). (D) Flow cytometry histograms and the fraction of live or dead cells measured by the viability dye 7AAD, of LPS-stimulated splenic B cells (n = 5–6; two independent experiments, one-way ANOVA; ns, not significant). Each dot in the graph represents a single mouse. Source data are available for this figure: SourceData FS2.
Figure 2.
Figure 2.
GC and ASC formation are dependent on SMARCA5. (A) Serum IgM, IgA, and IgG1 titers as determined by ELISA in control or Smarca5-deficient mice (n = 7–10 unmanipulated mice; two independent experiments, two-tailed Student’s t test; **P ≤ 0.01, ***P ≤ 0.001). (B) Representative flow cytometry plots and frequencies of B cell subsets in the BM of unmanipulated control versus Smarca5-deficient mice (n = 5; two independent experiments, two-tailed Student’s t test; ns, not significant). (C) Representative flow cytometry plots and frequencies of total ASCs in the BM of unmanipulated mice (n = 5; two independent experiments, two-tailed Student’s t test; *P ≤ 0.05). (D) Representative flow cytometry plots and frequencies of total B cells, ASCs, and GC B cells in popliteal LNs 7 days after NP-KLH immunization (n = 10–11; four independent experiments, two-tailed Student’s t test; ***P ≤ 0.001). (E) Representative flow cytometry plot and frequencies of GC B cells in popliteal LNs 7 days after NP-KLH immunization of chimeric mice consisting of 50% tdTomato CD45.2 WT and 50% CD45.2 Smarca5-deficient BM cells (n = 5; two independent experiments, two-tailed Student’s t test; ***P ≤ 0.001). (F) Representative flow cytometry plots and frequencies of ASCs and GC B cells in popliteal LNs 7 days after NP-KLH immunization of control and AID.Cre.Smarca4fl/fl mice (n = 7–12; three independent experiments, two-tailed Student’s t test; *P ≤ 0.05, ***P ≤ 0.001). Each dot in the graphs represents a single mouse.
Figure 3.
Figure 3.
SMARCA5 is required for B cell expansion, class-switch recombination, and ASC formation. (A) Representative flow cytometry histograms and quantification of CTV indicating the in vitro proliferation and absolute number of splenic B cells treated with LPS for 4 days (n = 5–8; two independent experiments, two-tailed Student’s t test; **P ≤ 0.01). (B) Representative flow cytometry histograms and frequencies of untreated B cells, and B cells stimulated with LPS for 16 h (top) or 4 days (bottom) (n = 5–6; two independent experiments, one-way ANOVA; *P ≤ 0.05, **P ≤ 0.01, ***P ≤ 0.001, ns, not significant). (C and D) Representative flow cytometry plots and frequencies of IgG1+ B cells (C) or total B cells and ASCs (D) derived from naive spleens that were either left unmanipulated or stimulated in vitro with LPS+IL-4 for 4 days (n = 4–6; two independent experiments, one-way ANOVA; ***P ≤ 0.001, ns, not significant). Each dot in the graphs represents a single mouse.
Figure 4.
Figure 4.
SMARCA5 is required to establish an appropriate antigen-specific B cell immune response. (A) Scheme illustrating the experimental design. (B) Representative TPLSM images of intact popliteal LNs removed at the indicated time points after NP-KLH immunization (n = 3–4; three independent experiments). Scale bar: 200 µm. (C–E) Representative flow cytometry plots and frequencies of total transferred (C), activated (D; left and middle), GC (D; right), or ASCs (E), antigen-specific B1-8hi B cells in popliteal LNs at the indicated time points after NP-KLH immunization (n = 7; two independent experiments, two-tailed Student’s t test; *P ≤ 0.05, **P ≤ 0.01, ***P ≤ 0.001). Each dot in the graph represents a single mouse.
Figure S3.
Figure S3.
The viability of resting and activated antigen-specific B cells is not substantially impaired following SMARCA5 depletion. (A and B) Flow cytometry plots and frequencies of resting (A) and activated (B) antigen-specific B1-8hi GFP B cells in popliteal LNs 5 days after NP-KLH immunization (n = 6; two independent experiments, one-way ANOVA; *P ≤ 0.05, **P ≤ 0.01; ns, not significant). Each dot in the graph represents a single mouse.
Figure 5.
Figure 5.
SMARCA5 mediates proper genetic re-programming of activated B cells. (A) Scheme illustrating the experimental design. (B) Volcano plots showing differential gene expression in transferred B1-8hi B cells 5 days after immunization (n = 3–6; three independent experiments, adjusted P value <0.05, and log2 FC > 0.58 or less than −0.58; raw P values were adjusted for multiple testing using the procedure of Benjamini and Hochberg). (C) Heatmap of differentially expressed genes. (D) GO term biological pathway analysis of upregulated genes in control B1-8hi B cells. (E) GSEA analysis of differentially expressed genes. NES, normalized enrichment score; FDR, false discovery rate.
Figure 6.
Figure 6.
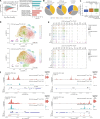
Chromatin accessibility of GC- and ASC-promoting genes is regulated by SMARCA5. (A) MA plot of the log average (A) on the X-axis, and log ratio (M) on the Y-axis representing the changes in accessibility peaks under SMARCA5 deficiency (left); GO term biological pathway analysis of genes associated with differential accessibility peaks (right) upregulated in either control or Smarca5-deficient transferred B1-8hi B cells, 5 days after immunization. Upregulated peaks in the control B cells are marked in pink and the upregulated peaks in the Smarca5-deficient B cells are marked in blue (log2 FC greater than or equal to ±0.3, adjusted P < 0.1). (B) Distribution of SMARCA5 accessibility peaks (ATAC-seq) and binding sites (using the CUT&RUN protocol) across genomic regions. TTS: transcription termination site. (C) Box plots representing the median, quartiles, and 5th and 95th percentiles of changes in gene expression of control compared to Smarca5-deficient B cells in genes linked to ATAC peaks or both ATAC and CUT&RUN peaks compared with total genes. P value was calculated by a two-sided Wilcoxon rank sum test. (D) UMAP projections of Multiome profiles with color coding according to the different clusters. Top and bottom UMAPs represent the control and Smarca5-deficient groups, respectively. (E) Dot plots depicting the RNA expression of selected marker genes presented by average expression and percent expression per cluster. The top and bottom plots represent the control and deficient groups, respectively. (F) Gene tracks depicting chromatin accessibility and expression of selected marker genes from specific clusters. Each track also represents the DNA binding sites of SMARCA5, as shown by CUT&RUN peaks.
Figure S4.
Figure S4.
Changes in chromatin accessibility in the absence of SMARCA5. (A) MA plots of the log average (A) on the X-axis, and log ratio (M) on the Y-axis representing the changes in accessibility peaks under SMARCA5 deficiency for each expression cluster. (B) Venn diagrams indicating the intersection and total number of peaks of the ATAC and CUT&RUN datasets. (C) Dot plots depicting the RNA expression of the most expressed genes in each cluster presented by average expression and percent expression. Left and right plots represent the control and deficient groups, respectively. (D) Gene tracks of chromatin accessibility and SMARCA5 DNA binding sites as shown by CUT&RUN peaks for selected marker genes.

References

    1. Allen, C.D.C., Ansel K.M., Low C., Lesley R., Tamamura H., Fujii N., and Cyster J.G.. 2004. Germinal center dark and light zone organization is mediated by CXCR4 and CXCR5. Nat. Immunol. 5:943–952. 10.1038/ni1100 - DOI - PubMed
    1. Alvarez-Saavedra, M., De Repentigny Y., Lagali P.S., Raghu Ram E.V.S., Yan K., Hashem E., Ivanochko D., Huh M.S., Yang D., Mears A.J., et al. . 2014. Snf2h-mediated chromatin organization and histone H1 dynamics govern cerebellar morphogenesis and neural maturation. Nat. Commun. 5:4181. 10.1038/ncomms5181 - DOI - PMC - PubMed
    1. Arends, T., Dege C., Bortnick A., Danhorn T., Knapp J.R., Jia H., Harmacek L., Fleenor C.J., Straign D., Walton K., et al. . 2019. CHD4 is essential for transcriptional repression and lineage progression in B lymphopoiesis. Proc. Natl. Acad. Sci. USA. 116:10927–10936. 10.1073/pnas.1821301116 - DOI - PMC - PubMed
    1. Aydin, Ö.Z., Vermeulen W., and Lans H.. 2014. ISWI chromatin remodeling complexes in the DNA damage response. Cell Cycle. 13:3016–3025. 10.4161/15384101.2014.956551 - DOI - PMC - PubMed
    1. Barisic, D., Stadler M.B., Iurlaro M., and Schübeler D.. 2019. Mammalian ISWI and SWI/SNF selectively mediate binding of distinct transcription factors. Nature. 569:136–140. 10.1038/s41586-019-1115-5 - DOI - PMC - PubMed

MeSH terms

Substances