. 2024 Nov 4;221(11):e20240435.
doi: 10.1084/jem.20240435. Epub 2024 Sep 19.

Inhibition of hTERT/telomerase/telomere mediates therapeutic efficacy of osimertinib in EGFR mutant lung cancer

Affiliations

Inhibition of hTERT/telomerase/telomere mediates therapeutic efficacy of osimertinib in EGFR mutant lung cancer

Zhen Chen et al. J Exp Med. .

Abstract

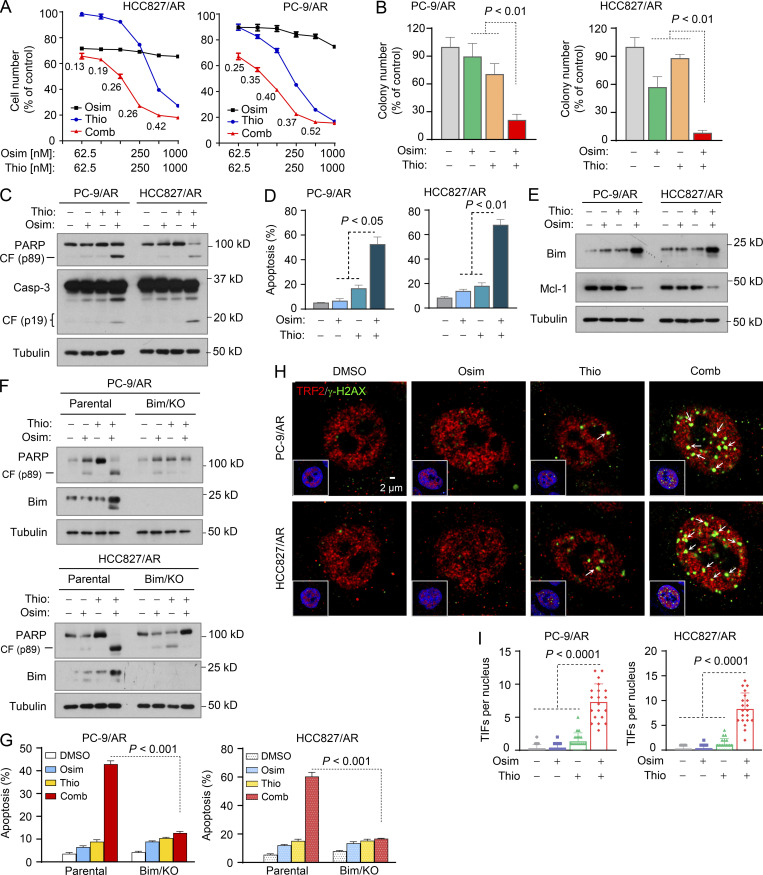
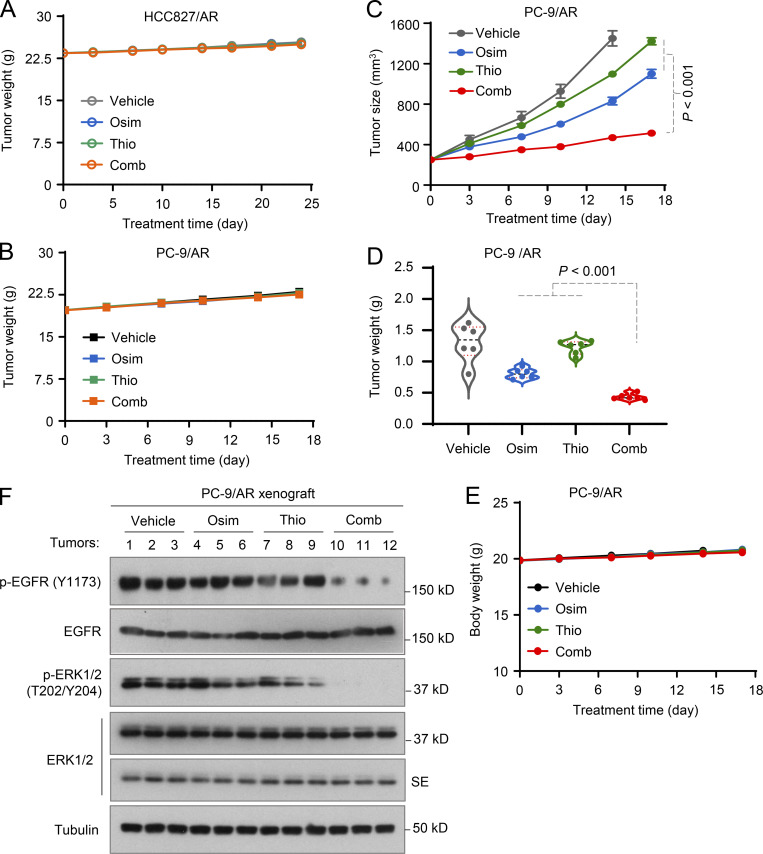
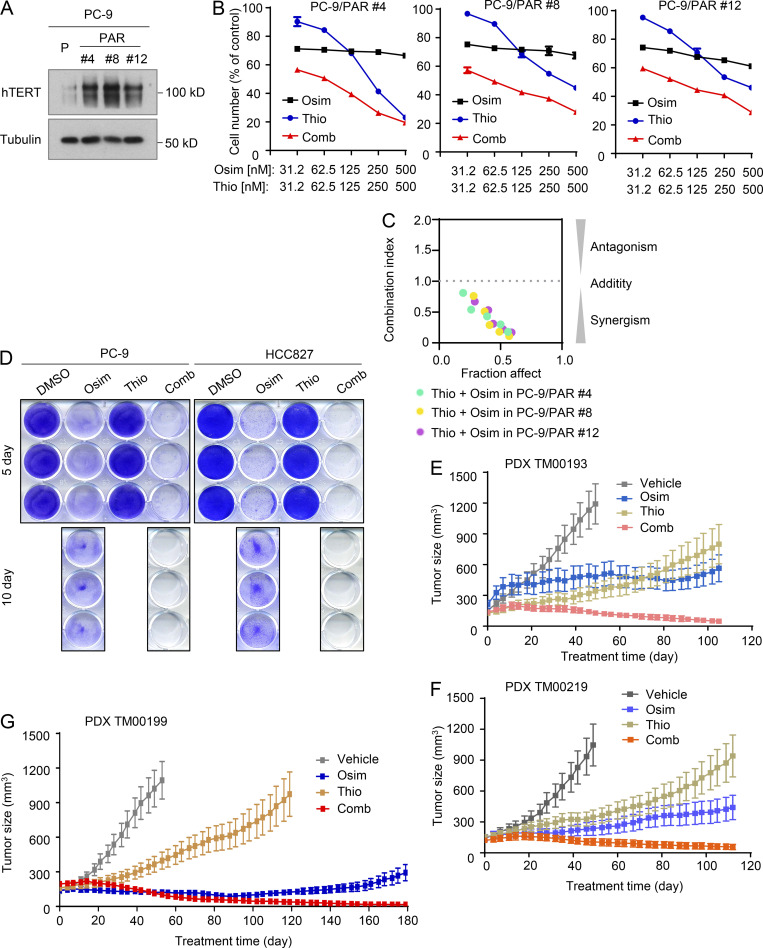
The inevitable acquired resistance to osimertinib (AZD9291), an FDA-approved third-generation EGFR tyrosine kinase inhibitor (EGFR-TKI) for the treatment of patients with advanced non-small cell lung cancer (NSCLC) harboring EGFR activating or T790M resistant mutations, limits its long-term clinical benefit. Telomere maintenance via telomerase reactivation is linked to uncontrolled cell growth and is a cancer hallmark and an attractive cancer therapeutic target. Our effort toward understanding the action mechanisms, including resistance mechanisms, of osimertinib has led to the identification of a novel and critical role in maintaining c-Myc-dependent downregulation of hTERT, a catalytic subunit of telomerase, and subsequent inhibition of telomerase/telomere and induction of telomere dysfunction in mediating therapeutic efficacy of osimertinib. Consequently, osimertinib combined with the telomere inhibitor, 6-Thio-dG, which is currently tested in a phase II trial, effectively inhibited the growth of osimertinib-resistant tumors, regressed EGFRm NSCLC patient-derived xenografts, and delayed the emergence of acquired resistance to osimertinib, warranting clinical validation of this strategy to manage osimertinib acquired resistance.


Conflict of interest statement

Disclosures: T. Leal reported personal fees from AstraZeneca, Daiichi-Sankio, Janssen, Takeda, EMD Serono, Eisai, Novocure, Amgen, Roche/Genentech, Regeneron, Jazz, Catalyst, OncoC4, Pfizer, Novartis, Bristol Myers Squibb, AbbVie, Gilead, Black Diamond, and Boehringer-Ingelheim outside the submitted work. S.S. Ramalingam reported grants from Bristol Myers Squibb, AstraZeneca, Merck, Pfizer, and Amgen outside the submitted work. No other disclosures were reported.

Figures

Figure 1.
Figure 1.
Osimertinib suppresses hTERT expression accompanied by telomerase/telomere inhibition and TIF induction. (A and B) RNA-seq data were generated from PC-9 cells treated with DMSO or 100 nM osimertinib (Osim) for 14 h. Each column is the mean ± SD of triplicate treatments. FPKM, fragments per kilobase per million. (C) RT-qPCR data for hTERT suppression by osimertinib in the indicated cell lines exposed to DMSO or 100 nM osimertinib for 14 h. Each column is the mean ± SD of triplicate treatments. (D–G) The given cell lines were exposed to different concentrations of osimertinib as indicated for 24 h (D), 200 nM osimertinib for varied times as indicated (E), 200 nM indicated EGFR-TKIs for 24 h (F), or 500 nM osimertinib for 24 h (G). The proteins of interest were detected with western blotting. (H) IF was used to detect hTERT in PC-9 tumors treated with 15 mg/kg osimertinib for 9 days. (I and J) The indicated cell lines were exposed to DMSO or 100 nM osimertinib for 24 h and then subject to telomerase (I) and telomere length (J) assays using the Telomerase Activity Quantification qPCR Assay and Absolute Human Telomere Length Quantification qPCR Assay kits, respectively. The data are means ± SDs of four replicate treatments. (K and L) Both PC-9 and HCC827 cell lines were treated with 200 nM osimertinib for 24 h followed with the TIF assay. TIFs were counted from 20 cells for each treatment and represented as means ± SEs. Arrows indicate TIFs (colocalization of TRF2 and γ-H2AX). Statistical differences were assessed with two-sided unpaired Student’s t test. Source data are available for this figure: SourceData F1.
Figure S1.
Figure S1.
c-Myc positive regulation of hTERT in EGFRm NSCLC cells. (A and B) IF detection of hTERT (A) or hTERT and c-Myc (B). The indicated cell lines were exposed to DMSO or 100 nM osimertinib for 24 h. (C) Osimertinib modulation of hTERT in EGFRm NSCLC cell lines expressing ectopic c-Myc or c-Myc (T58A) gene. The treatment condition was the same for Fig. 2 G. Source data are available for this figure: SourceData FS1.
Figure 2.
Figure 2.
c-Myc suppression mediates downregulation of hTERT expression by osimertinib. (A) Putative transcriptional factors were predicted with PROMO program. (B) Alterations of transcriptional factors in RNA-seq data generated from both PC-9 and HCC827 cells treated with DMSO or 100 nM osimertinib (Osim) for 14 h presented in the heatmap (triplicate treatments). (C and D) PC-9 cells were exposed to 200 nM for the indicated times (C) or 24 h (D), (E) The indicated cell lines were transfected with the indicated siRNAs for 48 h. (F) The indicated cell lines were infected with lentiviruses carrying hTERT shRNA followed by puromycin selection. (G) The indicated cell lines expressing ectopic vector (V), WT, and mutant c-Myc genes, respectively, were exposed to DMSO or 200 nM osimertinib (Osim) for 16 h. After the aforementioned treatments, the proteins of interest were detected with western blotting (C and E–G) or IF (D). (H) Reporter constructs harboring the core hTERT promoter region and deleted regions. (I) The indicated cell lines were transfected with the given reporter constructs for 24 h followed by 200 nM osimertinib for another 16 h. Cells were then harvested for luciferase assay. The data are the means ± SD of four replicate determinations. Statistical differences were assessed with two-sided unpaired Student’s t test. Source data are available for this figure: SourceData F2.
Figure S2.
Figure S2.
hTERT expression in human NSCLC tissues, its association with c-Myc expression, and its impact on patient survival. (A–C) TCGA data analysis of the correlation between c-Myc and hTERT expression (A) and their respective impact on patient survival (B and C) in EGFRm lung adenocarcinomas. (A) c-Myc and hTERT mRNA expression data from 33 EGFRm lung adenocarcinoma (LUAD) in the TCGA database were extracted and their correlation was then analyzed. TPM, transcripts per million. (B and C) High versus low expression (cutoff: median) of hTERT or c-Myc in these 33 tumors were also stratified and their impacts on patient survival were analyzed. (D–G) hTERT expression in human NSCLC tissues including lung adenocarcinoma (LUAD) and lung squamous cell carcinoma (LUSC) in comparison with normal tissue (NL) (D and E) and the impact of hTERT expression on patient survival (F and G). hTERT was stained with IHC. Statistical differences were assessed with two-sided unpaired Student’s t test. **, P < 0.01; ***, P < 0.001; ns, not significant.
Figure 3.
Figure 3.
hTERT expression is elevated in EGFRm NSCLC cell lines and patient tumor tissues with acquired resistance to osimertinib. (A) RNA-seq data for hTERT upregulation in osimertinib-resistant PC-9 cells. Each column is the mean ± SD of triplicate treatments. (B) RT-qPCR detection of hTERT mRNA levels in the indicated cell lines. Each column is the mean ± SD of triplicate treatments. (C–E) Western blotting detection of hTERT protein from the indicated cell lines with or without exposure to 200 nM osimertinib (Osim) or HS-10296 for 16 h (C and D) or basal levels of TERT in the indicated cell lines (E). P, parental; AR, AZD9291-resistant; HSR, HS-10296-resistant. (F) IF detection of hTERT in the indicated cell lines exposed to 100 nM osimertinib for 24 h. (G and H) Telomerase activity (G) and telomere length (H) in the tested cell lines were detected using the Telomerase Activity Quantification qPCR Assay and Absolute Human Telomere Length Quantification qPCR Assay kits, respectively. The data are the means ± SDs of four replicate determinations. (I and J) hTERT in human EGFRm NSCLC issues were detected with IHC and representative pictures of hTERT staining are shown (J). WI, weight index, which represents % positive stain × intensity score (0–3). Statistical differences were assessed with a two-sided unpaired Student’s t test. Source data are available for this figure: SourceData F3.
Figure 4.
Figure 4.
Genetic manipulations of hTERT expression alter the responses of EGFRm NSCLC cell lines to osimertinib. (A–F) The indicated cell lines transfected with scrambled control or hTERT siRNA for 48 h (A–C) or expressing pLKO.1 or shTERT (D and E) were exposed to DMSO or 200 nM osimertinib (Osim) for 24 h (A and D), 48 h (B and E), or 72 h (C and F). (G–I) The indicated cell lines expressing vector (V) or hTERT gene were exposed to DMSO or 100 nM osimertinib for 24 h (G), 48 h (H), or 72 h (I). The proteins of interest were detected with western blotting (A, D, and G). Annexin V-positive cells were determined with flow cytometry (B, E, and H). Cell numbers were estimated with the SRB assay (C, F, and I). The data are means ± SDs of triplicate (B, E, and H) or four replicate (C, F, and I) determinations. Statistical analysis was conducted with one-way ANOVA test (B) or two-sided unpaired Student’s t test (E and H). CF, cleaved form. Source data are available for this figure: SourceData F4.
Figure 5.
Figure 5.
6-Thio-dG in combination with osimertinib synergistically induces apoptosis and TIFs in osimertinib-resistant EGFRm NSCLC cell lines. (A) The given cell lines were treated with varied concentrations of the tested agents either alone or in combinations for 3 days. Cell numbers were then measured by SRB assay and CIs were calculated and presented inside the graph. The data are means ± SDs of four replicate determinations. (B) The tested cell lines seeded in 12-well plates were treated with 50 nM osimertinib, 50 nM 6-Thio-dG (Thio), or their combination, which were repeated with fresh medium every 3 days. After 10 days, the cells were fixed, stained with crystal violet dye, imaged, and counted. Columns are means ± SDs of triplicate determinations. (C–G) The tested cell lines were exposed to 200 nM osimertinib, 250 nM 6-Thio-dG or their combination for 16 h (E), 24 h (C and F), or 48 h (D and G). The proteins of interest were detected with western blotting (E, C, and F) and apoptotic cells were detected with annexin V staining/flow cytometry (D and G). Each column represents mean ± SD of triplicate treatments. (H and I) Both PC-9/AR and HCC827/AR cells were treated with 200 nM osimertinib, 250 nM 6-Thio-dG, or their combination for 24 h followed by the TIF assay. TIFs were counted from 20 cells for each treatment and represented as means ± SEs. The inserted images show costaining of DAPI, TRF2 and γ-H2AX. Arrows indicate TIFs (colocalization of TRF2 and γ-H2AX). Statistical analysis was conducted with one-way ANOVA test (B, D, and I) or two-sided unpaired Student’s t test (G). Source data are available for this figure: SourceData F5.
Figure S3.
Figure S3.
Osimertinib in combination with other telomerase inhibitors synergistically decreases the survival of osimertinib-resistant cell lines. The indicated cell lines were treated with varied concentrations of osimertinib alone, the tested telomerase inhibitor alone, or their respective combinations for 3 days. Cell numbers were determined with the SRB assay. The data are means ± SDs of four replicate determinations. The numbers in the graph by the red lines are CIs.
Figure 6.
Figure 6.
The combination of osimertinib with 6-Thio-dG effectively inhibits the growth of osimertinib-resistant EGFRm NSCLC xenografts. HCC27/AR or PC-9/AR cells grown in NU/NU nude mice as xenografted tumors (n = 6/group) were treated with vehicle, osimertinib alone (5 mg/kg, daily, oral gavage [og]), 6-Thio-dG (Thio) alone (2.5 mg/kg/day, daily, intraperitoneal injection [ip]), or their combination. (A) Tumor sizes were measured at the indicated time points (A). (B and C) At the end of treatment, tumors in each group were also weighed (B) and photographed (C). The data in each group are means ± SEs of six tumors from six mice. (D) The proteins of interest as indicated were stained with IHC (D). Statistical analysis was conducted with one-way ANOVA test.
Figure S4.
Figure S4.
Osimertinib and 6-Thio-dG combination is well tolerated in nude mice, inhibits the growth of osimertinib-resistant tumors, and suppresses EGFR/ERK signaling. (A, B, and F) Treatments were the same as described in Fig. 6. SE, short exposure. (C–E) Treatments were the same as described in Fig. 6 except for the initial tumor sizes, which were over 200 mm3, and osimertinib dosage, which was 15 mg/kg/day. Mice in the vehicle group were sacrificed a few days early before the end of the experiment. The data in each group are means ± SEs of six tumors from six mice. Statistical analysis was conducted with one-way ANOVA test. Source data are available for this figure: SourceData FS4.
Figure 7.
Figure 7.
Osimertinib and 6-Thio-dG combination eliminates DTCs and regresses different EGFRm PDX tumors with long-term remissions. (A) Detection of baseline hTERT expression in the indicated EGFRm NSCLC cell lines with primary osimertinib resistance by western blotting. (B and C) The given cell lines were exposed to varied concentrations of osimertinib (Osim), 6-Thio-dG (Thio) alone, or their combination. After 3 days, cell numbers were determined with the SRB assay (B). The data are means ± SDs of four replicate determinations. CIs for the combinations were also calculated (C). (D) The indicated cell lines seeded in 12-well plates were treated with 50 nM osimertinib, 50 nM 6-Thio-dG, or their combination; these treatments were repeated with fresh medium every 2 days. After 5 or 10 days, the cells were fixed, stained with crystal violet dye, and pictured. (E–G) The indicated PDXs in nude mice (six tumors/group) were treated with vehicle, 5 mg/kg osimertinib (daily, og), 2.5 mg/kg 6-Thio-dG (daily, ip), or their combination. The data are means ± SEs of six tumors. Source data are available for this figure: SourceData F7.
Figure S5.
Figure S5.
Osimertinib suppresses EGFR signaling and, when combined with 6-Thio-dG, is well-tolerated in vivo. (A) The indicated tumors at sizes of around 100 mm3 (n = 3) were treated with osimertinib (Osim; 5 mg/kg/day, og) for 18 (PC-9) or 21 (HCC827) days. SE, short exposure. (B–F) Treatments were the same as described in Fig. 7. Tumor growth is presented as a fold change in tumor sizes in comparison with their initial sizes of PDXs. Source data are available for this figure: SourceData FS5.

References

    1. Aras, G., Kanmaz D., Urer N., Purisa S., Kadakal F., Yentürk E., and Tuncay E.. 2013. Immunohistochemical expression of telomerase in patients with non-small cell lung cancer: Prediction of metastasis and prognostic significance. Anticancer Res. 33:2643–2650. - PubMed
    1. Blaquier, J.B., Ortiz-Cuaran S., Ricciuti B., Mezquita L., Cardona A.F., and Recondo G.. 2023. Tackling osimertinib resistance in EGFR mutant non-small cell lung cancer. Clin. Cancer Res. 29:3579–3591. 10.1158/1078-0432.CCR-22-1912 - DOI - PubMed
    1. Cabanos, H.F., and Hata A.N.. 2021. Emerging insights into targeted therapy-tolerant persister cells in cancer. Cancers. 13:2666. 10.3390/cancers13112666 - DOI - PMC - PubMed
    1. Camps, C., Sirera R., Bremnes R.M., Ródenas V., Blasco A., Safont M.J., Garde J., Juarez A., Caballero C., Sanchez J.J., et al. . 2006. Quantification in the serum of the catalytic fraction of reverse telomerase: A useful prognostic factor in advanced non-small cell lung cancer. Anticancer Res. 26:4905–4909. - PubMed
    1. Chen, Z., Vallega K.A., Chen H., Zhou J., Ramalingam S.S., and Sun S.Y.. 2022. The natural product berberine synergizes with osimertinib preferentially against MET-amplified osimertinib-resistant lung cancer via direct MET inhibition. Pharmacol. Res. 175:105998. 10.1016/j.phrs.2021.105998 - DOI - PMC - PubMed

MeSH terms