. 2024 Sep 3;7(9):e2436157.
doi: 10.1001/jamanetworkopen.2024.36157.

Preconception and Early-Pregnancy Body Mass Index in Women and Men, Time to Pregnancy, and Risk of Miscarriage

Affiliations

Preconception and Early-Pregnancy Body Mass Index in Women and Men, Time to Pregnancy, and Risk of Miscarriage

Aline J Boxem et al. JAMA Netw Open. .

Abstract

Importance: Obesity in women is associated with reduced fertility and an increased risk of miscarriage. These associations might also be present across the full range of body mass index (BMI) categories as well as among men.

Objective: To investigate the associations of preconception BMI in both partners with time to pregnancy and miscarriage.

Design, setting, and participants: This population-based prospective cohort study was conducted in Rotterdam, the Netherlands, between August 9, 2017, and July 1, 2021. A total of 3604 women and their partners were included from the preconception period onward with follow-up until birth. The date of analysis was July 12, 2024.

Exposure: Body mass index (calculated as weight in kilograms divided by height in meters squared) measured in preconception or early pregnancy.

Main outcome and measures: Fecundability, defined as the probability of conceiving within 1 month; subfertility, defined as time to pregnancy or duration of actively pursuing pregnancy of more than 12 months or use of assisted reproductive technology; and miscarriage, defined as pregnancy loss before 22 weeks of gestation. These measures were assessed using questionnaires and via the obstetric caregiver.

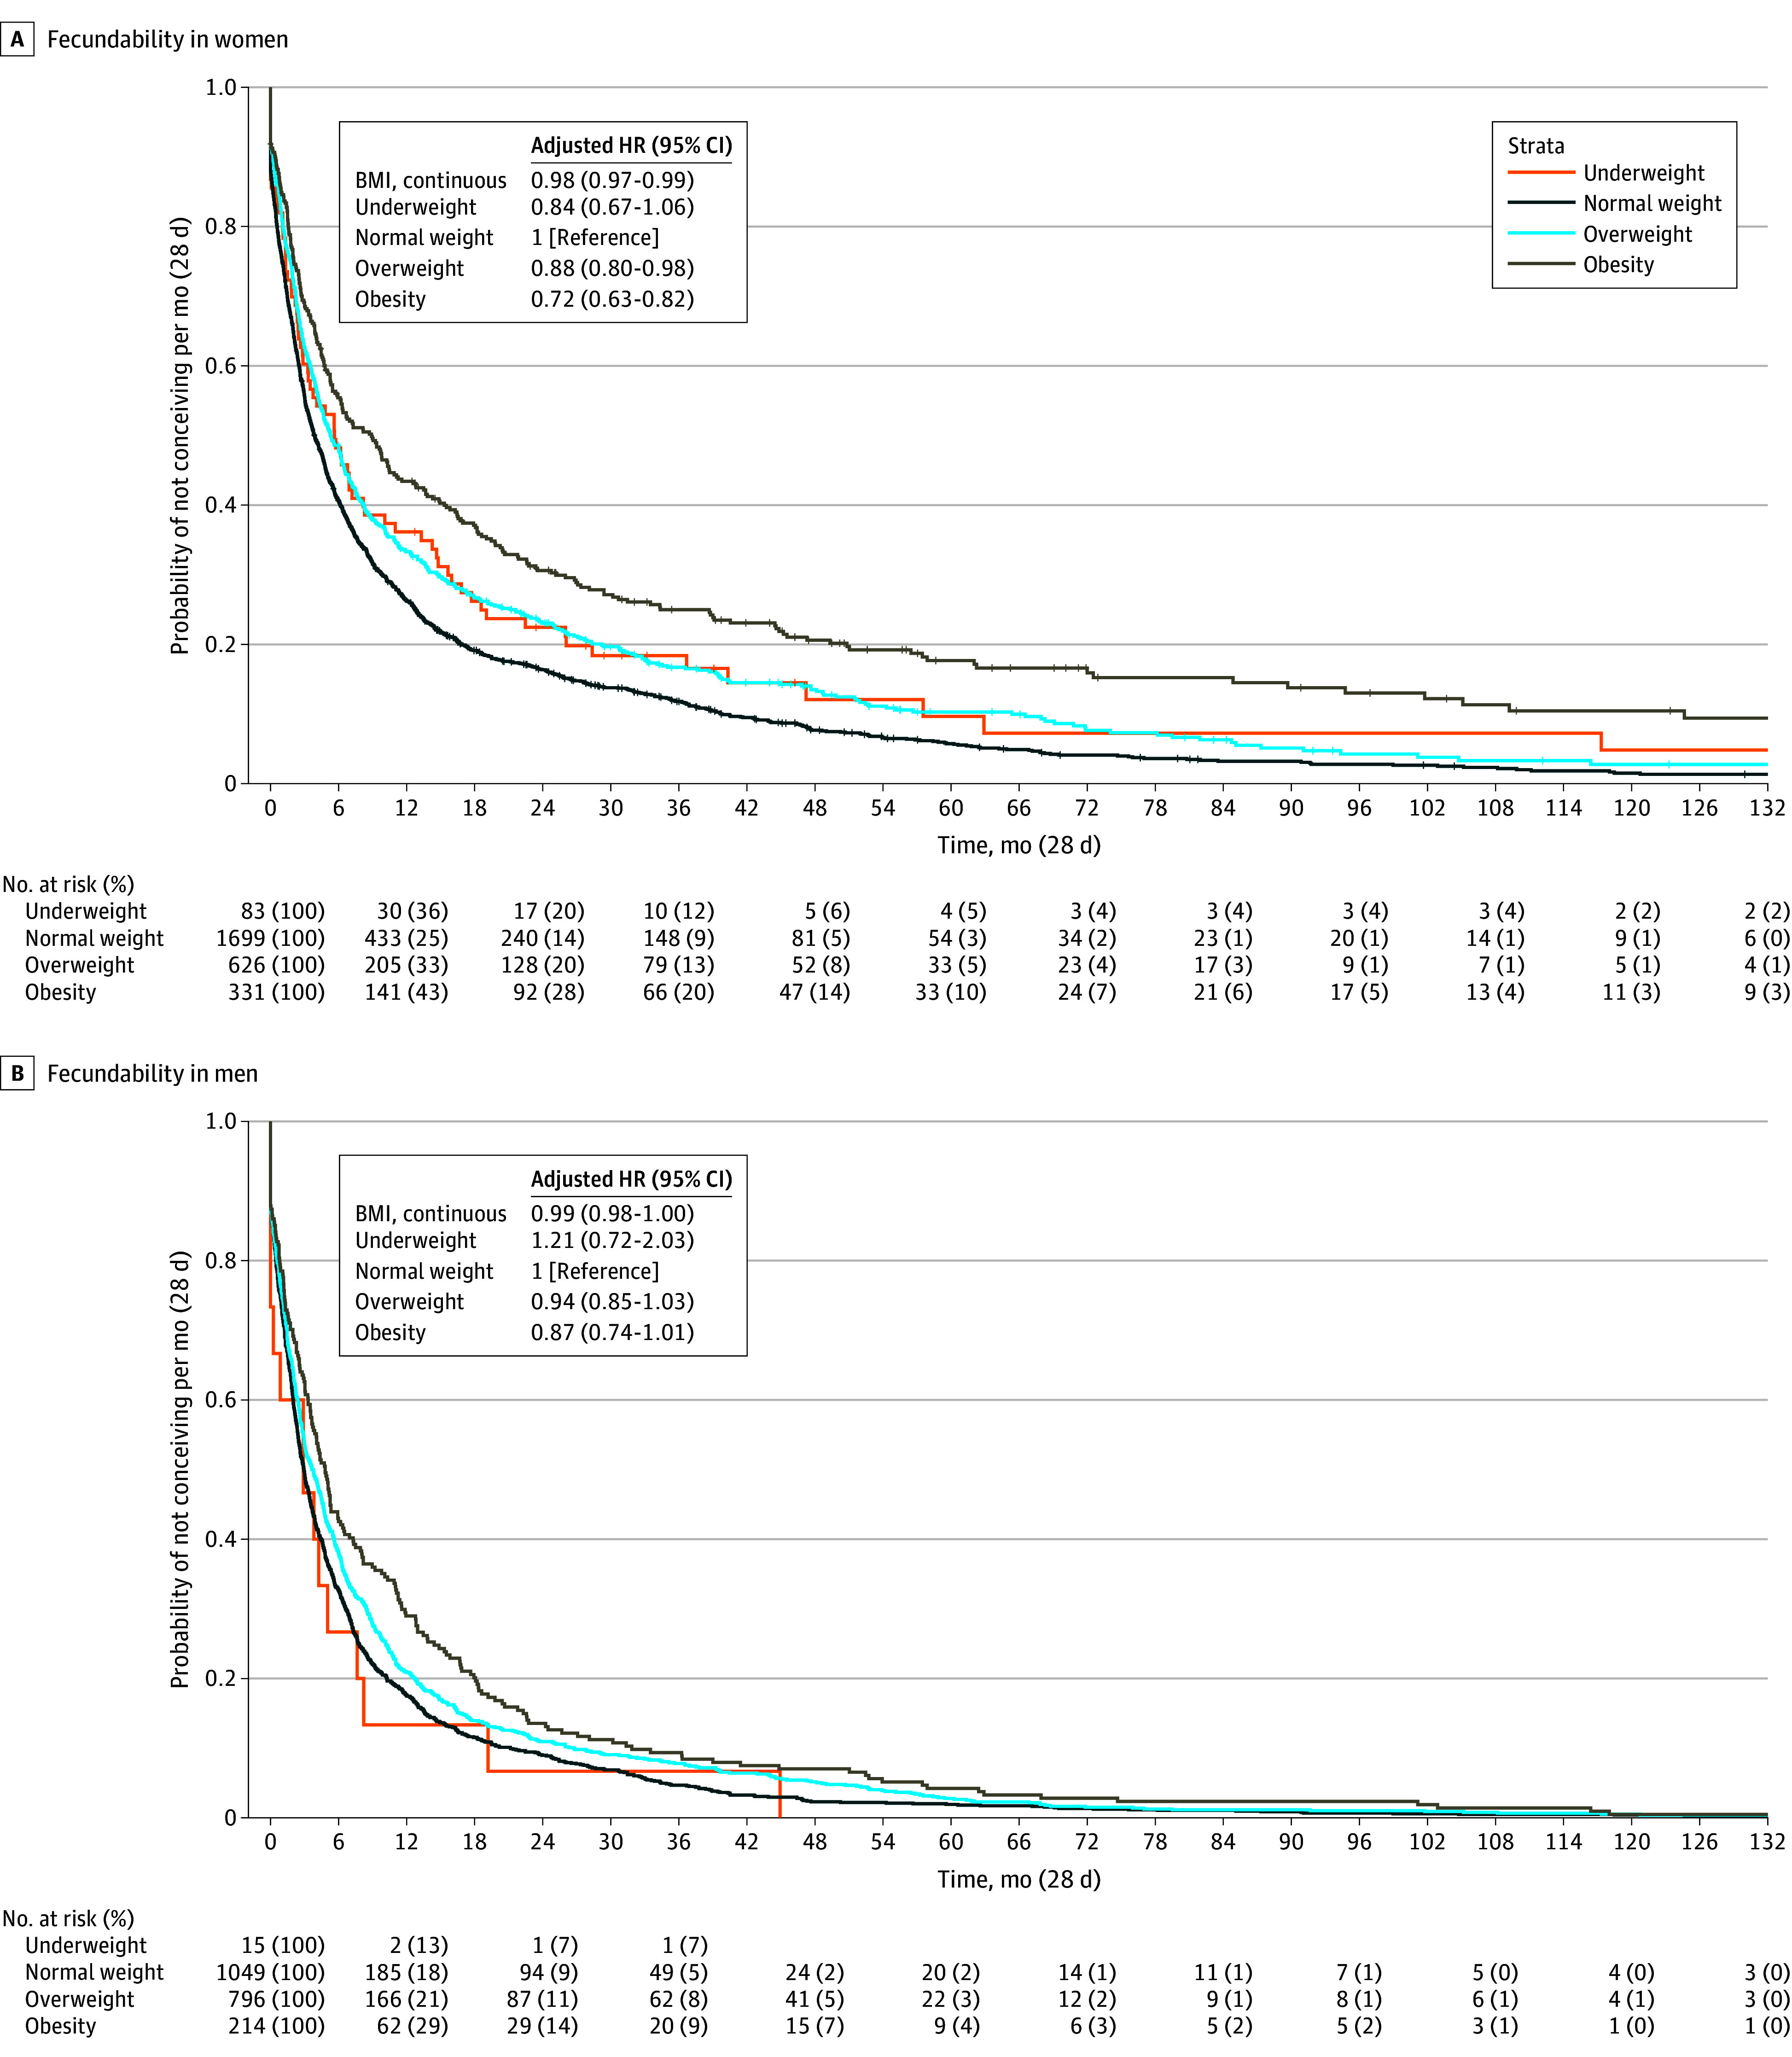
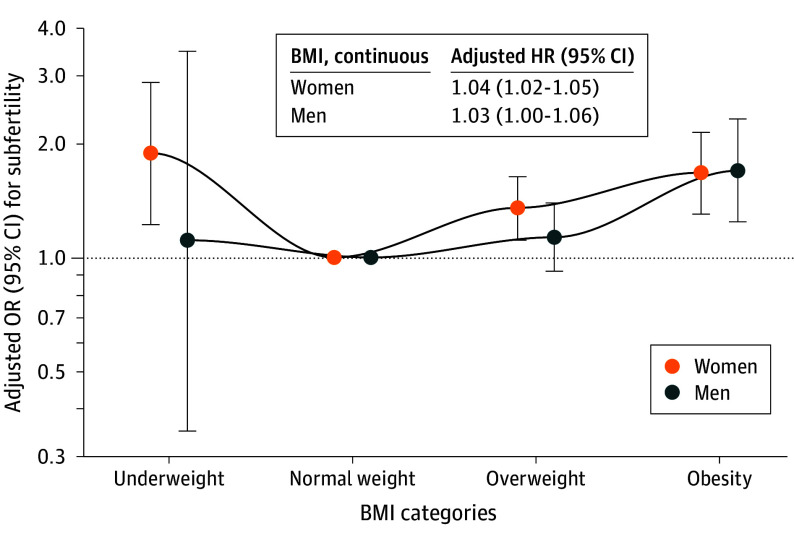
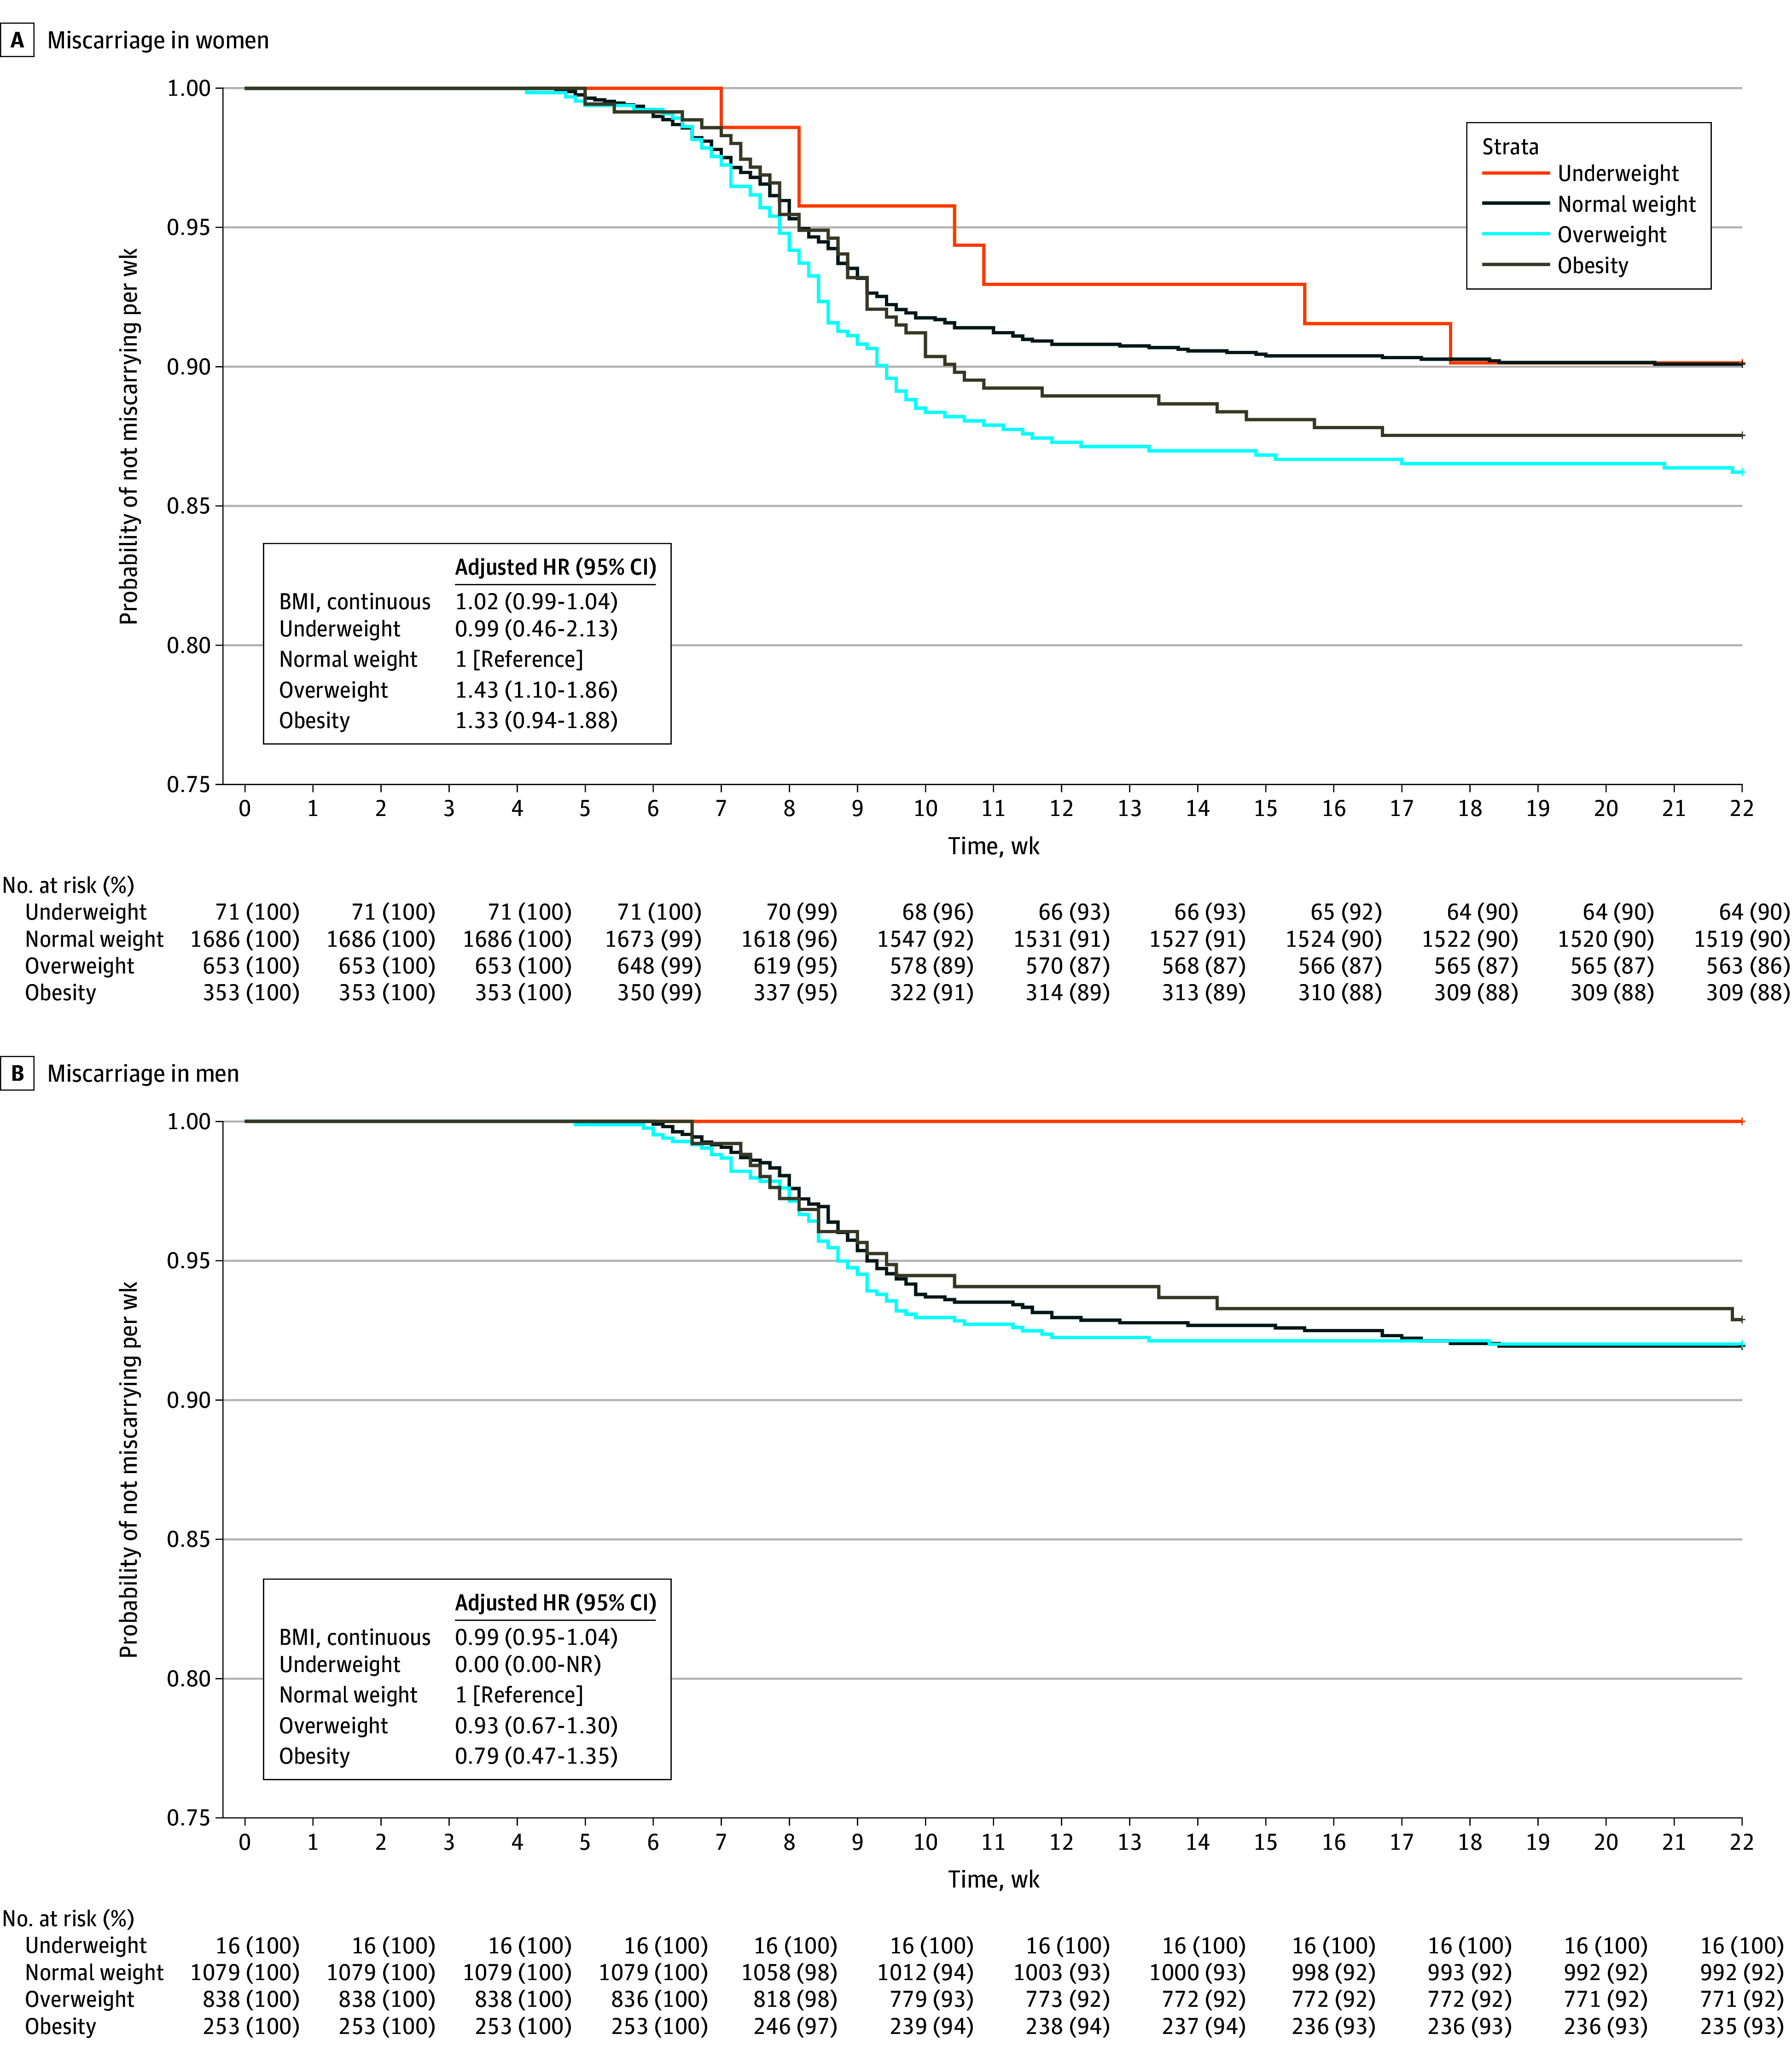
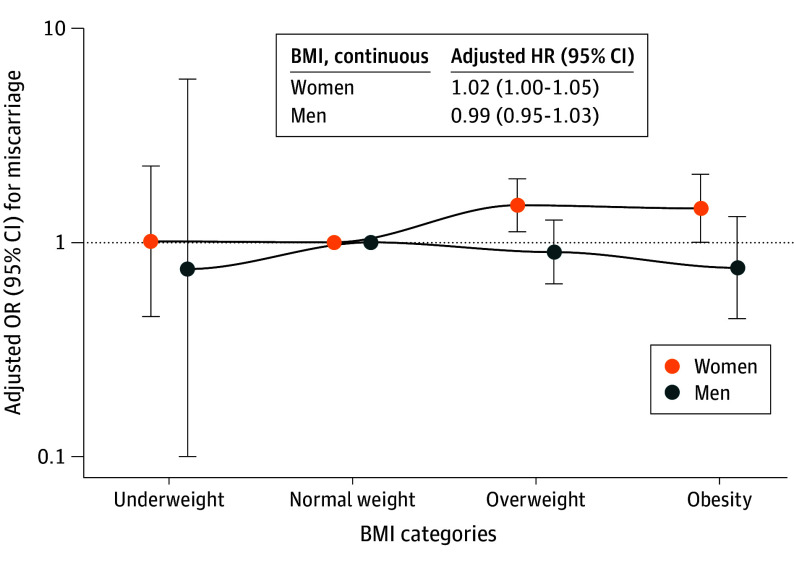
Results: The study population for time-to-pregnancy analyses consisted of 3033 episodes among women (median age, 31.6 years [IQR, 29.2-34.5 years]; median BMI, 23.5 [IQR, 21.2-26.5]) and 2288 episodes among men (median age, 33.4 years [IQR, 30.5-36.8 years]; median BMI, 24.9 [IQR, 23.0-27.4]). The study population for miscarriage analyses consisted of 2770 pregnancy episodes among women (median age, 31.5 years [IQR, 28.9-34.3 years]; median BMI, 23.5 [IQR, 21.3-26.7]) and 2189 pregnancy episodes among men (median age, 33.5 years [IQR, 30.4-36.8 years]; median BMI, 25.0 [IQR, 23.0-27.5]). Higher BMI in women and men was associated with lower fecundability: for every unit increase in BMI, fecundability decreased (fecundability ratio [FR]: women, 0.98 [95% CI, 0.97-0.99]; men, 0.99 [95% CI, 0.98-1.00]). Women with overweight (FR, 0.88 [95% CI, 0.80-0.98]) and obesity (FR, 0.72 [95% CI, 0.63-0.82]) had lower fecundability compared with women with normal weight. Compared with normal weight in women, underweight (odds ratio [OR], 1.88 [95% CI, 1.22-2.88]), overweight (OR, 1.35 [95% CI, 1.11-1.63]), and obesity (OR, 1.67 [95% CI, 1.30-2.13]) were associated with increased odds of subfertility. In men, obesity was associated with increased odds of subfertility (OR, 1.69 [95% CI, 1.24-2.31]). Compared with normal weight in women, overweight (OR, 1.49 [95% CI, 1.12-1.98]) and obesity (OR, 1.44 [95% CI, 1.00-2.08]) were associated with increased odds of miscarriage.

Conclusions and relevance: In this cohort study, BMI outside of the normal category in women and men during the preconception or early-pregnancy periods was associated with time to pregnancy and miscarriage. Optimizing BMI in women and men from the preconception period onward might be an important strategy to improve fertility outcomes.


Conflict of interest statement

Conflict of Interest Disclosures: None reported.

Figures

Figure 1.
Figure 1.. Associations of Body Mass Index (BMI) in Women and Men With Their Adjusted Fecundability Ratios
Fecundability ratios (with 95% CIs) associated with BMI (calculated as weight in kilograms divided by height in meters squared) categories. Fecundability ratios were derived from the hazard ratios (HRs) of the Cox proportional hazards regression model. The fecundability ratio of BMI on the categorical scale was calculated as follows: HR = hazard rate [H(t)] of the different BMI categories / [H(t) BMI reference category (normal weight)]. An HR less than 1 indicates a lower fecundability compared with the reference category. A, Main analysis for women with adjustment for participant’s age, ethnicity, educational level, smoking, alcohol consumption, and parity. The survival curve was derived from the unadjusted model. B, Main analysis for men with adjustment for participant’s age, ethnicity, educational level, smoking, and alcohol consumption. The survival curve was derived from the unadjusted model. Several sensitivity analyses were performed excluding the top 5% observations of time to pregnancy correcting for the right-skewed distribution (eTable 4 in Supplement 1), including only first episodes of participants (eTable 5 in Supplement 1), and including partner’s BMI as a covariate (eTable 6 in Supplement 1).
Figure 2.
Figure 2.. Associations of Body Mass Index (BMI) in Women and Men With Adjusted Odds Ratios (ORs) of Subfertility
Adjusted ORs (with 95% CIs) of subfertility (time to pregnancy or duration of actively pursuing pregnancy >12 months and assisted reproductive technology) associated with BMI categories. Odds ratios were derived from the exponentiated coefficients of the logistic regression models. An OR greater than 1 indicates increased odds of subfertility compared with the reference category (normal weight). Main analysis for women was adjusted for participant’s age, ethnicity, educational level, smoking, alcohol consumption, and parity. Main analysis for men was adjusted for participant’s age, ethnicity, educational level, smoking, and alcohol consumption (OR of underweight in men must be interpreted with caution due to the small sample size in this group). Several sensitivity analyses were performed, excluding episodes with assisted reproductive technology (eTable 11 in Supplement 1), excluding the top 5% observations of time to pregnancy correcting for the right-skewed distribution (eTable 12 in Supplement 1), including only first episodes of participants (eTable 13 in Supplement 1), and including partner’s BMI as a covariate (eTable 14 in Supplement 1).
Figure 3.
Figure 3.. Associations of Body Mass Index (BMI) in Women and Men With Their Adjusted Hazard Ratios (HRs) for Miscarriage
Adjusted HRs (with 95% CIs) of miscarriage associated with BMI categories. Hazard ratios were derived from the Cox proportional hazards regression model. The HR of BMI on the categorical scale was calculated as follows: HR = hazard rate [H(t)] of the different BMI categories / [H(t) BMI reference category (normal weight)]. An HR greater than 1 indicates a higher probability of miscarriage per week compared with the reference category. A, Main analysis for women with adjustment for participant’s age, ethnicity, educational level, smoking, alcohol consumption, parity, and history of miscarriage. The survival curve was derived from the unadjusted model. B, Main analysis for men with adjustment for participant’s age, ethnicity, educational level, smoking, and alcohol consumption. The survival curve was derived from the unadjusted model. Several sensitivity analyses were performed, excluding episodes with assisted reproductive technology (eTable 18 in Supplement 1), including only first episodes of participants (eTable 19 in Supplement 1), and including partner’s BMI as a covariate (eTable 20 in Supplement 1). NR indicates not reached.
Figure 4.
Figure 4.. Associations of Body Mass Index (BMI) in Women and Men and Adjusted Odds Ratios (ORs) of Miscarriage
Adjusted ORs (with 95% CIs) of miscarriage associated with BMI categories. Odds ratios were derived from the exponentiated coefficients of the logistic regression models. An OR greater than 1 indicates increased odds of miscarriage compared with the reference category (normal weight). Main analysis for women was adjusted for participant’s age, ethnicity, educational level, smoking, alcohol consumption, parity, and history of miscarriage. Main analysis for men was adjusted for participant’s age, ethnicity, educational level, smoking, and alcohol consumption (OR of underweight in men must be interpreted with caution due to the small sample size in this group). Several sensitivity analyses were performed, excluding episodes with assisted reproductive technology (eTable 24 in Supplement 1), including only first episodes of participants (eTable 25 in Supplement 1), and including partner’s BMI as a covariate (eTable 26 in Supplement 1).

References

    1. World Health Organization . WHO European Regional Obesity Report 2022. World Health Organization; 2022.
    1. Godfrey KM, Reynolds RM, Prescott SL, et al. . Influence of maternal obesity on the long-term health of offspring. Lancet Diabetes Endocrinol. 2017;5(1):53-64. doi:10.1016/S2213-8587(16)30107-3 - DOI - PMC - PubMed
    1. Gaillard R, Jaddoe VWV. Maternal cardiovascular disorders before and during pregnancy and offspring cardiovascular risk across the life course. Nat Rev Cardiol. 2023;20(9):617-630. doi:10.1038/s41569-023-00869-z - DOI - PubMed
    1. Catalano PM, Shankar K. Obesity and pregnancy: mechanisms of short term and long term adverse consequences for mother and child. BMJ. 2017;356:j1. doi:10.1136/bmj.j1 - DOI - PMC - PubMed
    1. Voerman E, Santos S, Patro Golab B, et al. . Maternal body mass index, gestational weight gain, and the risk of overweight and obesity across childhood: an individual participant data meta-analysis. PLoS Med. 2019;16(2):e1002744. doi:10.1371/journal.pmed.1002744 - DOI - PMC - PubMed

Publication types