. 2024 Nov 8;9(21):e178644.
doi: 10.1172/jci.insight.178644.

Pivotal roles for cancer cell-intrinsic mPGES-1 and autocrine EP4 signaling in suppressing antitumor immunity

Affiliations

Pivotal roles for cancer cell-intrinsic mPGES-1 and autocrine EP4 signaling in suppressing antitumor immunity

Nune Markosyan et al. JCI Insight. .

Abstract

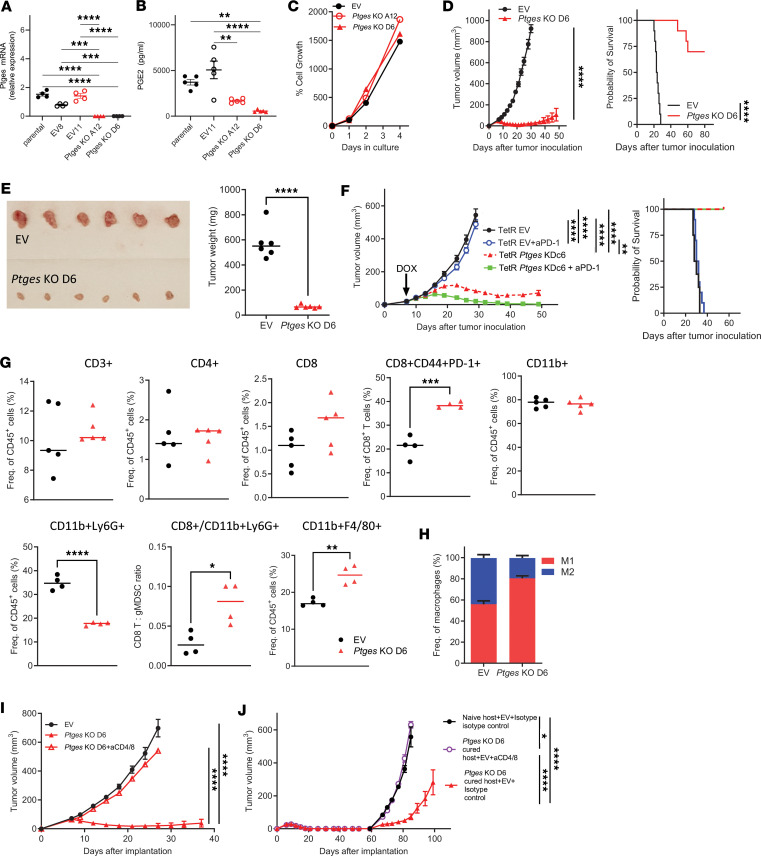
Tumor cell-derived prostaglandin E2 (PGE2) is a tumor cell-intrinsic factor that supports immunosuppression in the tumor microenvironment (TME) by acting on the immune cells, but the impact of PGE2 signaling in tumor cells on the immunosuppressive TME is unclear. We demonstrate that deleting the PGE2 synthesis enzyme or disrupting autocrine PGE2 signaling through EP4 receptors on tumor cells reverses the T cell-low, myeloid cell-rich TME, activates T cells, and suppresses tumor growth. Knockout (KO) of Ptges (the gene encoding the PGE2 synthesis enzyme mPGES-1) or the EP4 receptor gene (Ptger4) in KPCY (KrasG12D P53R172H Yfp CrePdx) pancreatic tumor cells abolished growth of implanted tumors in a T cell-dependent manner. Blockade of the EP4 receptor in combination with immunotherapy, but not immunotherapy alone, induced complete tumor regressions and immunological memory. Mechanistically, Ptges- and Ptger4-KO tumor cells exhibited altered T and myeloid cell attractant chemokines, became more susceptible to TNF-α-induced killing, and exhibited reduced adenosine synthesis. In hosts treated with an adenosine deaminase inhibitor, Ptger4-KO tumor cells accumulated adenosine and gave rise to tumors. These studies reveal an unexpected finding - a nonredundant role for the autocrine mPGES-1/PGE2/EP4 signaling axis in pancreatic cancer cells, further nominating mPGES-1 inhibition and EP4 blockade as immune-sensitizing therapy in cancer.

Keywords: Cancer immunotherapy; Eicosanoids; Immunology; Mouse models; Oncology.


Figures

Figure 1
Figure 1. Ptges deficiency suppresses tumor growth in a T cell–dependent manner.
(A) Ptges mRNA expression by Q-PCR in parental (non-transduced 6419c5), control (empty vector transduced [EV]), and Ptges-KO clonal tumor cell lines A12 and D6 (n = 3–4). (B) Extracellular PGE2 levels measured by ELISA in parental, EV, and Ptges-KO clones (n = 5). (C) EV and Ptges-KO clonal cell line growth in vitro (n = 2). (D) Subcutaneously (s.c.) implanted EV and Ptges-KO D6 clone growth in vivo (left, n = 10/group) and host survival (right, n = 7–13). One out of 3 experiments with similar results shown. (E) Orthotopically injected EV and Ptges-KO D6 tumors harvested, photographed, and weighed on day 18 after transplantation (n = 6). (F) Control TetR EV and TetR Ptges KDc6 tumor growth in vivo (left) and host survival (right) with and without anti–PD-1 (αPD-1) treatment (n = 8–10). (G) Flow cytometric analysis of s.c. implanted EV and Ptges-KO D6 tumors on day 7 after implantation (n = 4–5; 1 of 3 experiments with similar results shown). (H) Proportions of M1 (F4/80+CD206MHCIIhi) and M2 (F4/80+CD206+MHCIImed) macrophages as a percentage of total macrophages in s.c. implanted EV and Ptges-KO D6 tumors (flow cytometry, day 7 after implantation, n = 4; 1 of 2 experiments with similar results shown). (I) Growth curves of EV and Ptges-KO D6 s.c. implanted tumors in hosts receiving CD4+ and CD8+ cell–depleting or isotype control antibodies (n = 5). (J) Growth curves of EV tumor cells implanted s.c. into naive hosts receiving isotype control antibodies and hosts that had previously cleared the Ptges-KO D6 tumors receiving either CD4+ and CD8+ T cell–depleting or isotype control antibodies (n = 5–8). Data are presented as mean ± SEM (A, B, D [left], F [left], I, and J), mean (C), or median (E and G). Significance was assessed by ordinary 1-way ANOVA with Tukey’s multiple-comparison test (A and B), 2-way ANOVA with main-effects analysis and Tukey’s multiple-comparison test (C), 2-way ANOVA with mix-effects analysis (D, left and F, left), log-rank Mantel-Cox test (D, right), 2-tailed unpaired Student’s t test (E and G), or 2-way ANOVA with mixed-effects analysis and Tukey’s multiple-comparison test (I and J). For all figures, P < 0.05 was considered statistically significant. *P < 0.05; **P < 0.01; ***P < 0.001; ****P < 0.0001.
Figure 2
Figure 2. Ptger4 KO in T cell–low tumor cell line abolishes implanted tumor growth in a T cell–dependent manner.
(A) Ptger4 mRNA expression by Q-PCR in control EV and TL 6419c5 Ptger4-KO clonal tumor cell lines (n = 3). (B) S.c. implanted non-transduced 6419c5 (parental), EV, and Ptger4-KO tumor growth (n = 6, 1 of 3 experiments with similar results shown). (C) Individual tumor growth curves of tumors in B. The black vertical arrow indicates the rechallenge of tumor-free mice with control cell implants on day 85 (n = 11: 5 and 6 mice cured of Ptger4-KO E10 and Ptger4-KO C3 tumors, respectively). (D) Control and Ptger4-KO tumor growth in WT and Ptger4-KO hosts (n = 10, 1 of 2 experiments with similar results shown). (E) Flow cytometric analysis of T cells in control and Ptger4-KO s.c. tumors 11 days after implantation (n = 10, 1 of 3 experiments with similar results shown). (F) Flow cytometric analysis of myeloid cells in control and Ptger4-KO s.c. tumors, 11 days after implantation (n = 10, 1 of 3 experiments with similar results shown). (G) Flow cytometric analysis of s.c. tumor-draining lymph nodes 10 days after implantation (n = 9–10, 1 of 3 experiments with similar results shown). (H) S.c. implanted control and Ptger4-KO tumor growth with and without CD4+ and CD8+ T cell depletion (n = 10). (I) Rechallenge control tumor growth with and without CD4+ and CD8+ T cell depletion in hosts after complete regression of Ptger4-KO s.c. implants (n = 10). (J) Ptger4 mRNA expression by Q-PCR in control E0771 EVb3 and E0771 OEb8 mammary clonal tumor cell lines (n = 3). (K) Growth curves of orthotopically implanted E0771 EVb3 and E0771 OEb8 mammary tumor cell lines (n = 4–5). Data are presented as median (A, E, and F), mean ± SEM (B, D, and HJ), and in C, each line represents an individual tumor. Significance was assessed by ordinary 1-way ANOVA with Tukey’s multiple-comparison test (A), 2-way ANOVA with Tukey’s multiple-comparison test for main-effects analysis (B, D, H, I, and K), or 2-tailed unpaired Student’s t test (EG and J). *P < 0.05; **P < 0.01; ***P < 0.001; ****P < 0.0001.
Figure 3
Figure 3. Disruption of PGE2 signaling in tumor cells changes the TME through altered production of cytokines, chemokines, and immunosuppressive adenosine.
(A) Cytokine and chemokine array analysis of media from control (7 pooled samples) and Ptger4-KO (8 pooled samples) tumors cultured ex vivo in hypoxic conditions (average of 2 technical replicates shown). (B) Cytokines from A measured using multiplex bead-based assay in the media of control and Ptger4-KO tumors cultured ex vivo in hypoxic conditions (n = 5–7; in the control group, all data points represent individual tumors and in Ptger4-KO group, 3 data points represent individual tumors and 2 data points represent 2 pooled samples each). (C) Cell viability in vitro assay after 48-hour incubation of the indicated cell lines with indicated concentrations of TNF-α. Cell viability in treatment groups is shown as a percentage of untreated control cells (n = 3/cell line/TNF-α concentration). (D) Proportion of cleaved caspase 3+ (CC3+) tumor cells in Ptger4-KO and control tumors by flow cytometry 11 days after implantation (n = 10). (E) Cell viability in vitro assay after 48-hour incubation of the indicated cell lines with indicated concentrations of TNF-α. Cell viability in treatment groups is shown as a percentage of untreated control cells (n = 3/cell line/TNF-α concentration). (F) Flow cytometric analysis of adenosine synthesis pathway enzymes in EV and Ptger4-KO tumors, 11 days after s.c. implantation (n = 6–10). (G) Flow cytometric analysis of adenosine synthesis pathway enzymes in EV and Ptges-KO tumors, 10 days after s.c. implantation (n = 6–10). (H) Adenosine levels per mg tumor tissue measured by mass spectrometry in media of control EV and Ptger4-KO tumors cultured ex vivo for 24 hours under hypoxic conditions in the presence of 1 μM PGE2 and 10 μM EHNA (adenosine deaminase inhibitor). Combined data from 2 separate experiments shown (n = 11–17). (I) Survival (left) and individual growth curves (right) of s.c. control EV and Ptger4-KO tumors implanted in hosts receiving either vehicle or 0.3 mg/ml EHNA every other day (n = 7). Data are presented as mean ± SEM (A), median (B, D, and FH), and in I (right), each line represents an individual tumor. Significance was assessed by 2-tailed unpaired Student’s t test (B, D, FH), global nonlinear regression analysis in GraphPad Prism (C and E), or log-rank Mantel-Cox test (I, left). *P < 0.05; **P < 0.01; ***P < 0.001; ****P < 0.0001.
Figure 4
Figure 4. Pharmacological inhibition of PGE2 signaling sensitizes tumors to immunotherapy and chemotherapy.
(A) Released cAMP measured by ELISA in culture media of TI 4662 MD7 PDAC clonal cell line treated either with vehicle (control) or 1 nM and 10 nM EP4 antagonist ONO-AE3-208 (αEP4) for 48 hours (n = 3). (B) S.c. implanted 4662 MD7 tumor volume change with and without indicated treatments, 41 days after implantation compared to the volume at the start of the treatment (each bar represents a tumor). (C) Individual tumor growth curves of the tumors in A, before and after rechallenges. The black vertical arrow indicates treatment start, blue arrows indicate first and second rechallenges on days 62 and 136, and horizontal black arrows indicate the period host mice were depleted of T cells (n = 5–8 initial implant, n = 12 rechallenge group: 2, 2, and 8 cured mice from αEP4, αPD-1+aCD40, and αEP4+αPD-1+aCD40 groups, respectively). (D) Postenrollment survival of KPC and KPCY mice with indicated treatments. Data are presented as median (A), individual columns (B), and in C, each line represents individual tumors. Significance was assessed by ordinary 1-way ANOVA with Tukey’s multiple-comparison test (A). *P < 0.05; ***P < 0.001.

References

    1. American Cancer Society. Cancer Facts & Figures 2023. https://www.cancer.org/content/dam/cancer-org/research/cancer-facts-and-... Accessed September 24, 2024.
    1. Bear AS, et al. Challenges and opportunities for pancreatic cancer immunotherapy. Cancer Cell. 2020;38(6):788–802. doi: 10.1016/j.ccell.2020.08.004. - DOI - PMC - PubMed
    1. Vonderheide RH, Bear AS. Tumor-derived myeloid cell chemoattractants and T cell exclusion in pancreatic cancer. Front Immunol. 2020;11:605619. doi: 10.3389/fimmu.2020.605619. - DOI - PMC - PubMed
    1. Principe DR, et al. Trials and tribulations of pancreatic cancer immunotherapy. Cancer Lett. 2021;504:1–14. doi: 10.1016/j.canlet.2021.01.031. - DOI - PMC - PubMed
    1. Principe DR, et al. The immune modifying effects of chemotherapy and advances in chemo-immunotherapy. Pharmacol Ther. 2022;236:108111. doi: 10.1016/j.pharmthera.2022.108111. - DOI - PMC - PubMed

MeSH terms