

Evaluating current acute aortic syndrome pathways: Collaborative Acute Aortic Syndrome Project (CAASP)
- PMID: 39298295
- PMCID: PMC11412149
- DOI: 10.1093/bjsopen/zrae096
Evaluating current acute aortic syndrome pathways: Collaborative Acute Aortic Syndrome Project (CAASP)
Abstract
Background: Diagnosis of acute aortic syndrome is challenging and associated with high perihospital mortality rates. The study aim was to evaluate current pathways and understand the chronology of acute aortic syndrome patient care.
Method: Consecutive patients with acute aortic syndrome imaging diagnosis between 1 January 2018 and 1 June 2021 were identified using a predetermined search strategy and followed up for 6 months through retrospective case note review. The UK National Interventional Radiology Trainee Research and Vascular and Endovascular Research Network co-ordinated the study.
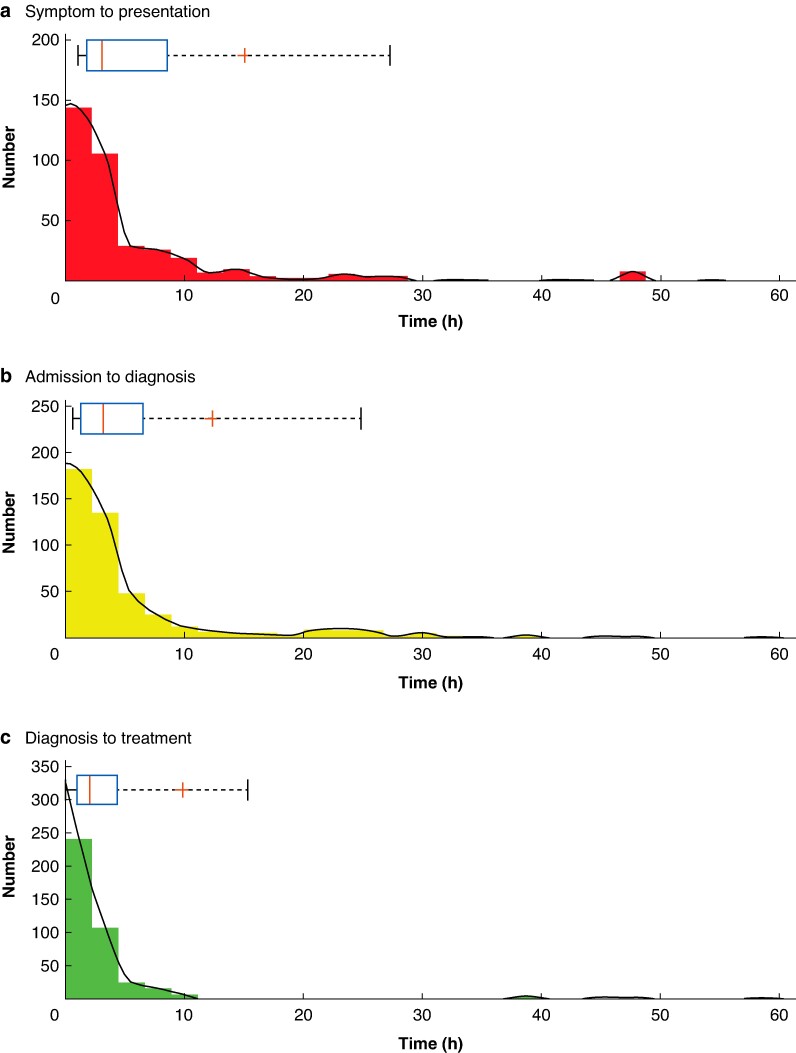
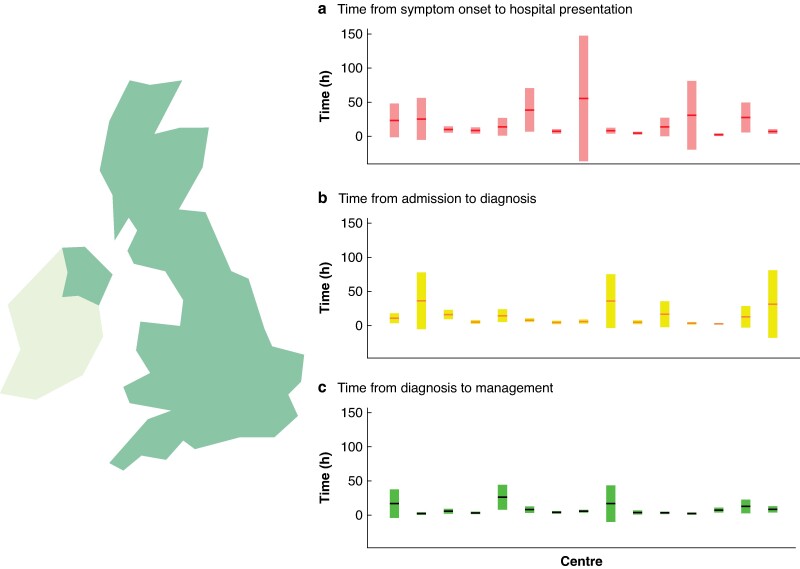
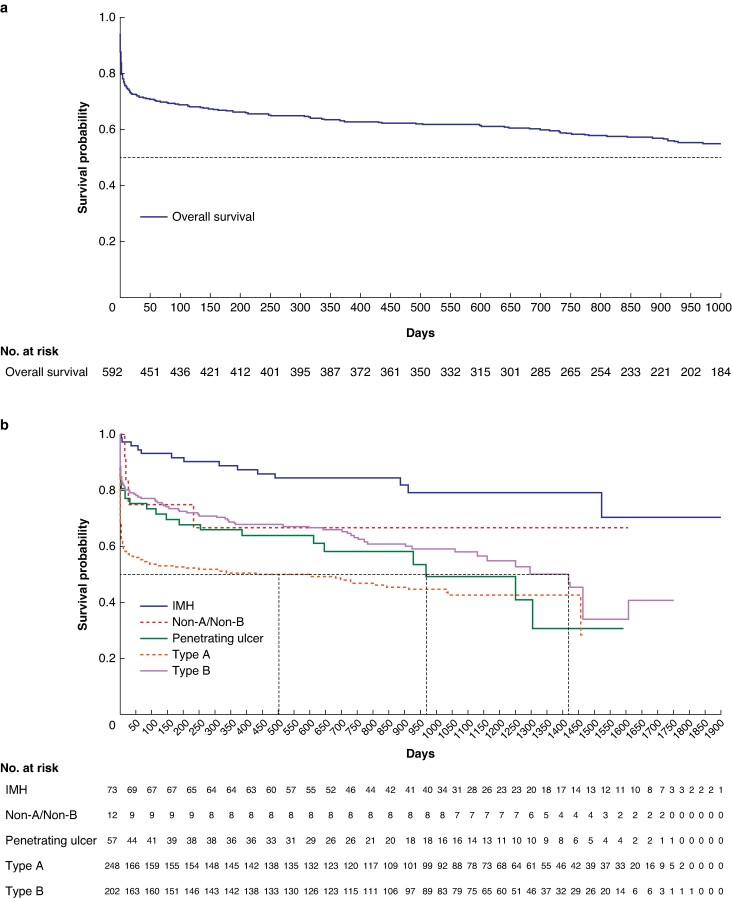
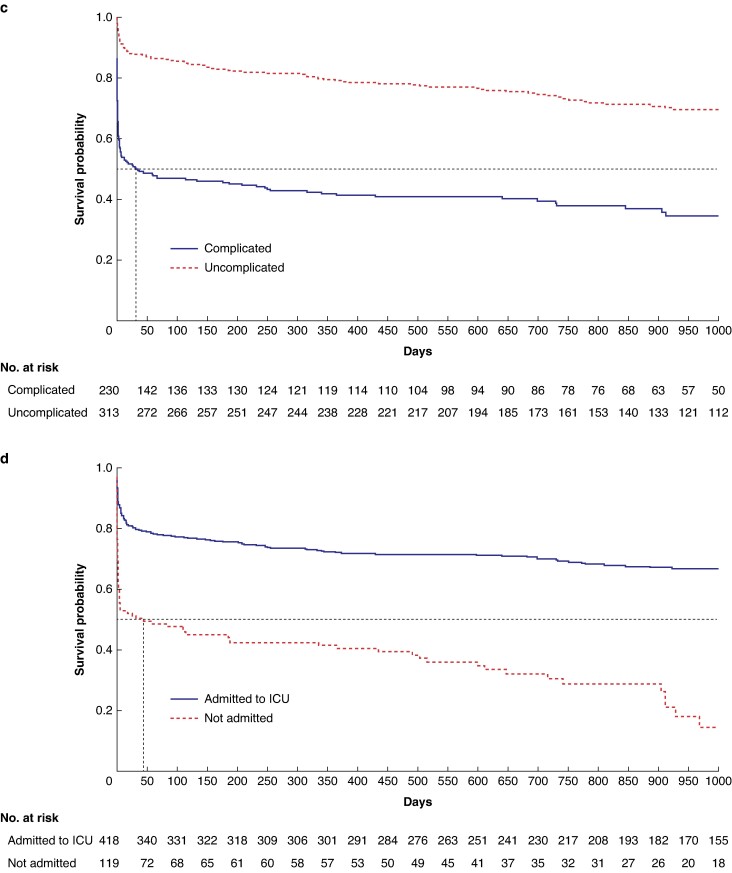
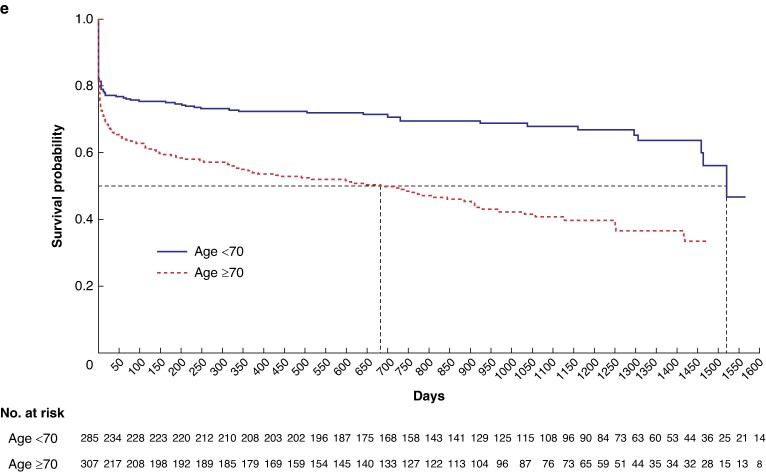
Results: From 15 UK sites, 620 patients were enrolled. The median age was 67 (range 25-98) years, 62.0% were male and 92.9% Caucasian. Type-A dissection (41.8%) was most common, followed by type-B (34.5%); 41.2% had complicated acute aortic syndrome. Mode of presentation included emergency ambulance (80.2%), self-presentation (16.2%), and primary care referral (3.6%). Time (median (i.q.r.)) to hospital presentation was 3.1 (1.8-8.6) h and decreased by sudden onset chest pain but increased with migratory pain or hypertension. Time from hospital presentation to imaging diagnosis was 3.2 (1.3-6.5) h and increased by family history of aortic disease and decreased by concurrent ischaemic limb. Time from diagnosis to treatment was 2 (1.0-4.3) h with interhospital transfer causing delay. Management included conservative (60.2%), open surgery (32.2%), endovascular (4.8%), hybrid (1.4%) and palliative (1.4%). Factors associated with a higher mortality rate at 30 days and 6 months were acute aortic syndrome type, complicated disease, no critical care admission and age more than 70 years (P < 0.05).
Conclusions: This study presents a longitudinal data set linking time-based delays to diagnosis and treatment with clinical outcomes. It can be used to prioritize research strategies to streamline patient care.
© The Author(s) 2024. Published by Oxford University Press on behalf of BJS Foundation Ltd.
Figures
References
-
- Bell R. How do you solve the problem of aortic dissection? J Vasc Soc GB Irel 2022;1:106–107
-
- Vardhanabhuti V, Nicol E, Morgan-Hughes G, Roobottom CA, Roditi G, Hamilton MC et al. Recommendations for accurate CT diagnosis of suspected acute aortic syndrome (AAS)–on behalf of the British Society of Cardiovascular Imaging (BSCI)/British Society of Cardiovascular CT (BSCCT). Br J Radiol 2016;89:20150705. - PMC - PubMed
Publication types
MeSH terms
LinkOut - more resources
Full Text Sources
