. 2024 Oct 22;43(10):114743.
doi: 10.1016/j.celrep.2024.114743. Epub 2024 Sep 18.

Epstein-Barr virus induces host shutoff extensively via BGLF5-independent mechanisms

Affiliations

Epstein-Barr virus induces host shutoff extensively via BGLF5-independent mechanisms

Alejandro Casco et al. Cell Rep. .

Abstract

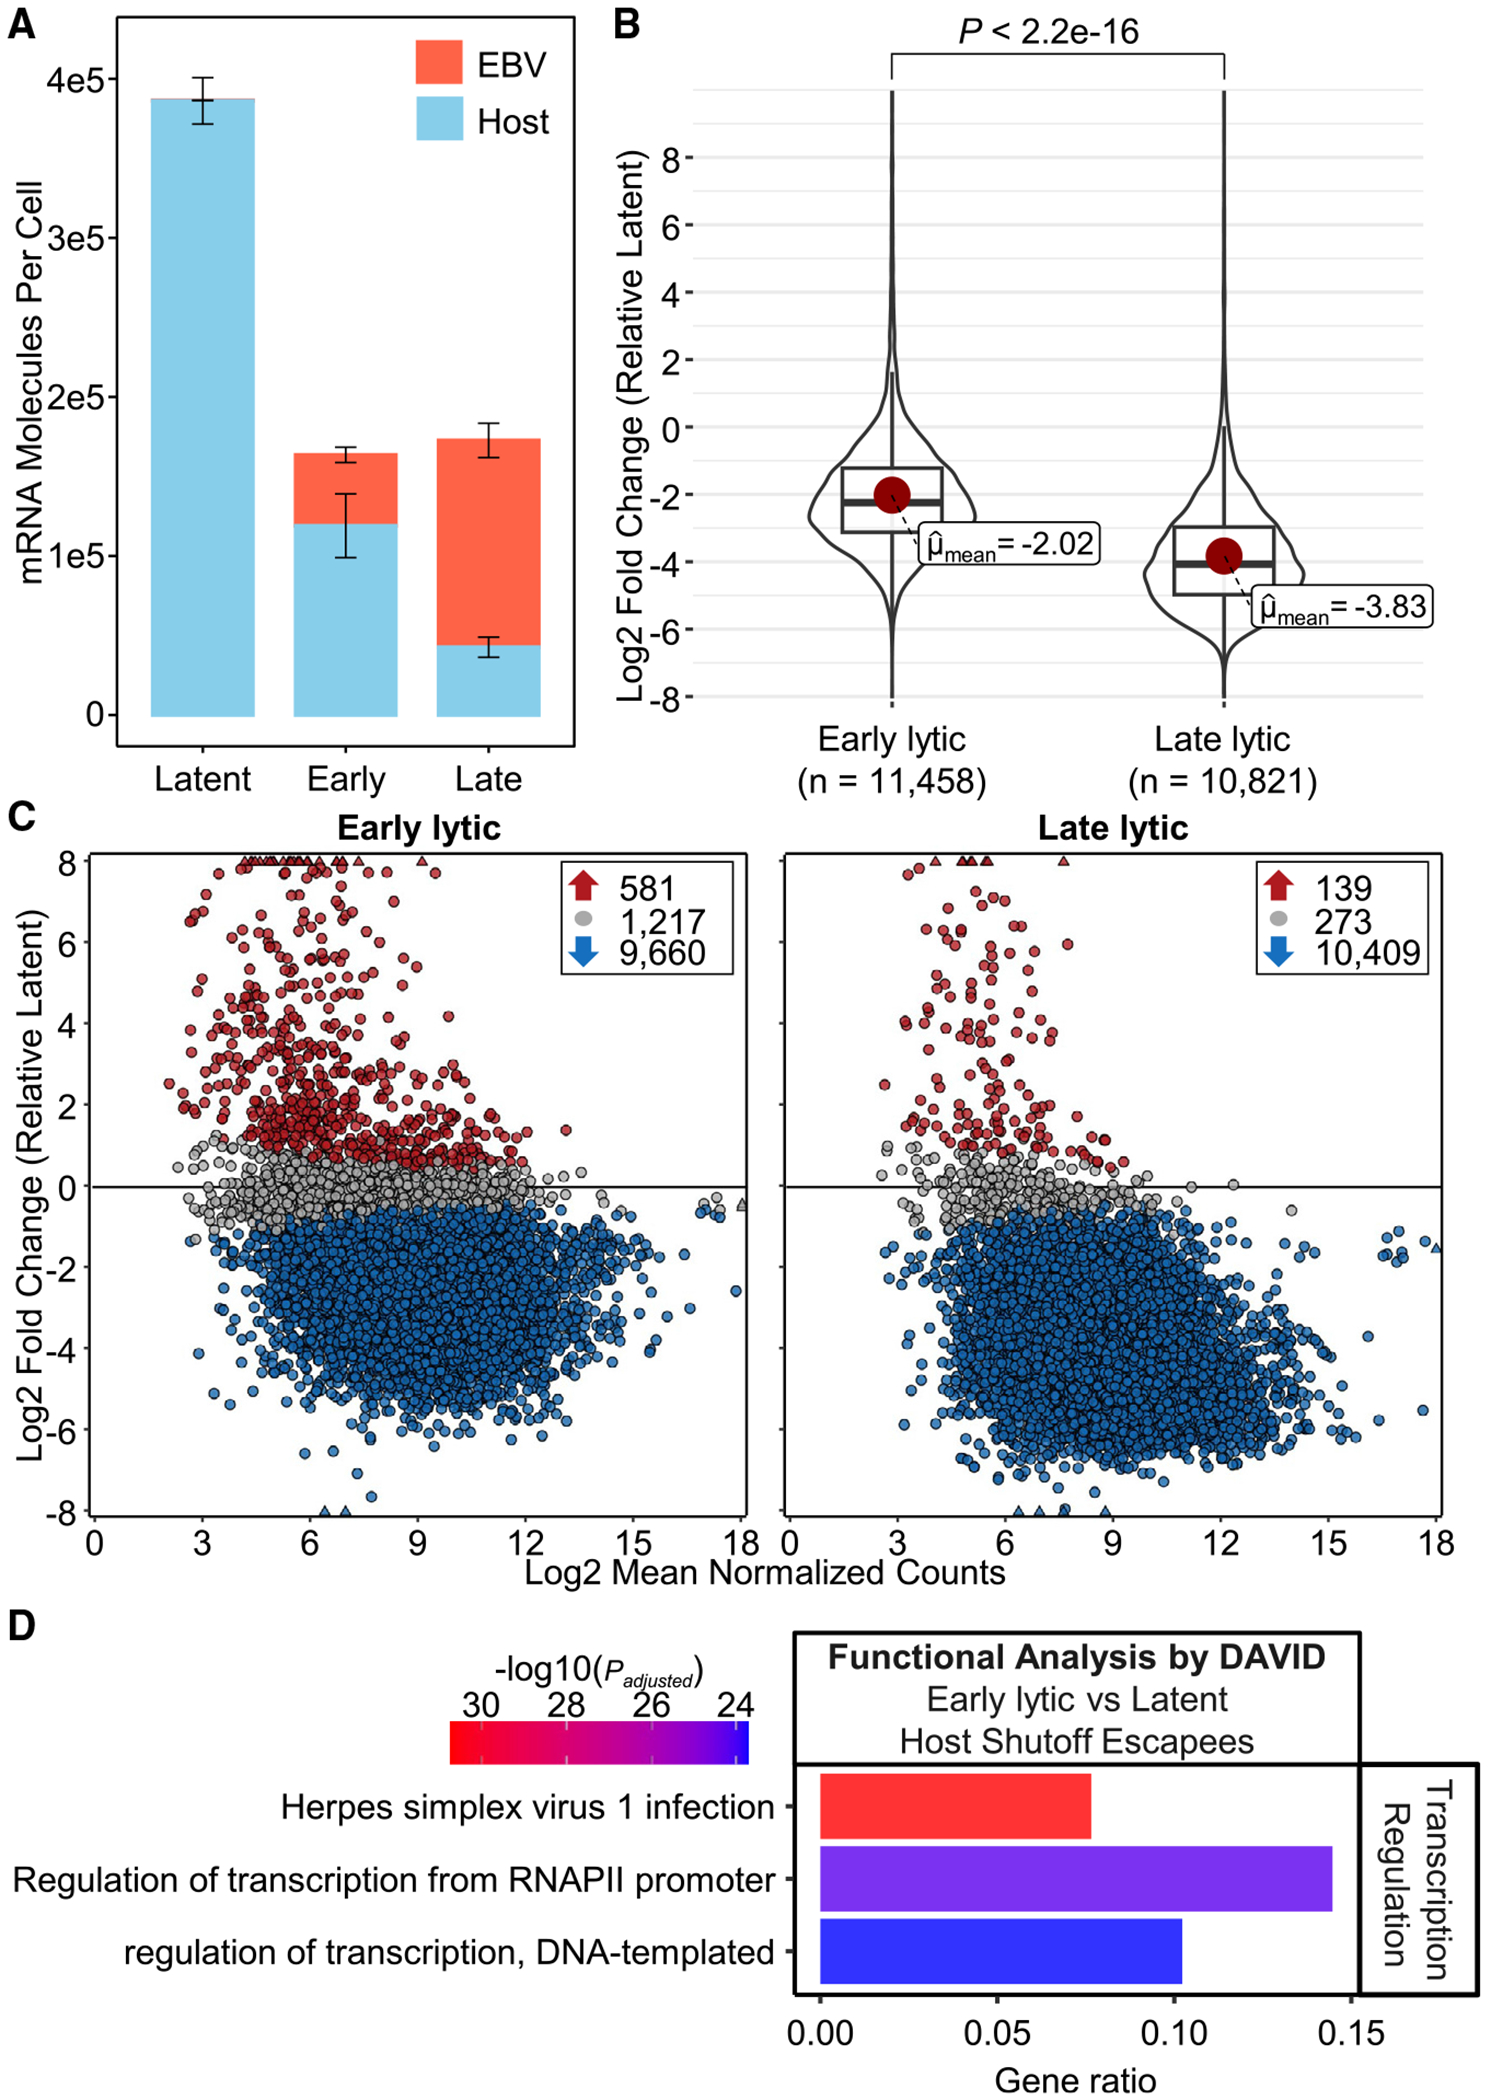
Epstein-Barr virus (EBV) is a ubiquitous oncogenic virus associated with multiple cancers and autoimmune diseases. Unlike most herpesviruses, EBV reactivation from latency occurs asymptomatically, allowing it to spread efficiently to other hosts. However, available models are limited by the inefficient and asynchronous reactivation from latency into lytic replication. To address this problem, we develop a dual-fluorescent lytic reporter (DFLR) EBV that specifically labels cells in the early and late stages of replication. Using lymphoblastoid cell lines transformed by DFLR EBV as a model for EBV reactivation in B cells, we observe extensive reprogramming of the host cell transcriptome during lytic cycle progression. This includes widespread shutoff of host gene expression and disruption of mRNA processing. Unexpectedly, host shutoff remains extensive even in cells infected with DFLR EBV deleted for the BGLF5 nuclease. These findings implicate BGLF5-independent mechanisms as the primary drivers of host transcriptome remodeling during EBV lytic replication.

Keywords: CP: Immunology; CP: Microbiology; EBV; herpesvirus; host shutoff; lytic reactivation; splicing; transcriptomics; tumor virus.


Conflict of interest statement

Declaration of interests The authors declare no competing interests.

Figures

Figure 1.
Figure 1.. Establishment and validation of a dual-fluorescent lytic reporter Epstein-Barr virus (DFLR EBV)
(A) Schematic of EBV M81 strain BACmid detailing the insertion of fluorescent reporter genes. The non-essential BXLF1 early ORF was replaced for the mGreenLantern (mGL) protein. Additionally, the mScarlet-I (mSI) was fused to the BILF2 late ORF using the synthetic tPT2A “self-cleaving” peptides. The resulting virus expresses mGL during early lytic replication and mGL + mSI during late lytic replication. The BACmid map was generated using SnapGene software (from Dotmatics; available at snapgene.com). (B) Merged microscopic images of LCLs transformed with WT EBV (left) or with DFLR EBV without BCR stimulation (middle left), 72 h after pan-immunoglobulin (Ig) treatment (middle right) and 72 h after combined pan-Ig and ganciclovir (GCV) treatment (right). Scale bar, 200 μm. (C) Corresponding flow data for each of the four conditions from (B).
Figure 2.
Figure 2.. Early lytic and late lytic populations can be purified from DFLR LCLs induced for EBV replication
(A) Experimental workflow used to characterize transcriptomes of early and late lytic populations. 72 h after induction of EBV replication via BCR stimulation with pan-Ig, DFLR LCLs were subjected to FACS to isolate latent (mGL/mSI), early lytic (mGL+/mSI), and late lytic (mGL+/mSI+) fractions. An equal number of cells was sorted for each condition into TRIzol containing equimolar amounts of ERCC spike-in RNAs. Strand-specific polyA-enriched libraries were constructed for each subpopulation and from bulk DFLR LCLs and sequenced as detailed in STAR Methods. (B) Boxplots quantifying representative mRNAs from each EBV kinetic class (latent, early, leaky late, late) within each fraction (n = 5 LCL biological replicates). The central line within each box marks the median, the box boundaries represent the 25th and 75th percentiles, and the whiskers extend to the minimum and maximum values. (C) Stacked bar graphs quantifying total EBV mRNAs (latent and three lytic kinetic classes) within each fraction. Data are presented as mean ± SEM for each kinetic class (n = 5 LCL biological replicates).
Figure 3.
Figure 3.. Extensive host shutoff during EBV replication
(A) Stacked bar graphs contrasting quantities of host (sky blue) vs. EBV (tomato) mRNAs in latent, early lytic, and late lytic fractions. Data are presented as mean ± SEM for each kinetic class (n = 5 LCL biological replicates). (B) Distribution of fold change in host gene-expression levels in early and late lytic fractions relative to the latent fraction visualized through superimposed box and violin plots (n = 5 LCL biological replicates). The mean log2 fold change in gene expression for each plot is denoted by red dots. The central line within each box marks the median, the box boundaries represent the 25th and 75th percentiles, and the whiskers extend to the minimum and maximum values. The number of analyzed genes passing filtering are presented under each fraction (n). The p value is derived from a two-sided Welch’s test. (C) Mean-abundance (MA) plots demonstrating host gene-expression fold changes in early (left panel) and late (right panel) lytic fractions relative to the latent fraction (n = 5 LCL biological replicates). The x axis depicts average levels of normalized expression for each gene between conditions being compared. Differential expressed genes (padjusted ≤ 0.05; false discovery rate [FDR]-adjusted Wald tests) are indicated in red (upregulated) or blue (downregulated); genes without significant expression change are colored gray. Triangles indicate data points exceeding the displayed range. (D) DAVID gene ontology (GO) and KEGG (Kyoto Encyclopedia of Genes and Genomes) pathway analyses performed on genes not significantly downregulated during early lytic replication relative to latency. Functional themes were identified by DAVID annotation clustering and manually designated as “transcription regulation” and “cellular signaling.” The p value is derived from an FDR-adjusted Fisher’s exact test.
Figure 4.
Figure 4.. Comprehensive analysis of EBV lytic-replication-induced splicing alterations reveals a systemic shift toward host shutoff programs
(A) Pie charts depicting distribution of reads mapping to exonic, intronic, or intergenic regions of host chromosomes in RNA-seq data from latent, early lytic, or late lytic fractions (n = 5 LCL biological replicates). (B and C) Volcano plots of differential (B) intron retention or (C) exon-skipping events (fold change ≥2 and padjusted ≤ 0.05; FDR-adjusted Wald tests) between early or late lytic fractions relative to latent fraction (n = 5 LCL biological replicates). Triangles indicate data points exceeding the displayed range. (D) Heatmap presenting the top differential exon-skipping events (fold change ≥2 and padjusted ≤ 0.05; FDR-adjusted Wald tests) of genes associated with the “defense response to virus” category identified through GO enrichment analysis of genes with at least one differential exon-skipping event in the early lytic vs. latent comparison. ES, exon skip; PSI, percentage spliced in. (E and F) (E) Mean coverage plots illustrating ILF3 gene exon-skipping events (red) identified in the preceding heatmap, accompanied by examples of intron retention (pink) in the latent and early lytic fractions (n = 5 LCL biological replicates). Schematics of expressed isoforms are shown with their coding potential and NMD sensitivity. Junction arcs are displayed in gray with their SpliceWiz-derived PSI values. (F) Isoform switching in the ILF3 gene. Data are presented as mean ± SEM with an isoform fraction cutoff of 7.5%. The FDR-adjusted p value is derived from a two-sided Welch’s test. ***padjusted < 0.001; ns, no significant difference. NMD, nonsense-mediated decay; Isoform 1, ENST00000588657.6; Isoform 2, ENST00000589998.6; Isoform 3, ENST00000586544.1; Isoform 4, ENST00000587928.5; Isoform 5, ENST00000589416.5. (G) Genome-wide enrichment of isoform-switch consequences in early or late lytic fractions relative to latent fraction (n = 5 LCL biological replicates). The opposing consequence of intron retention gain, intron retention loss, is significantly more likely during lytic replication relative to latency. Data are presented as fractions (with 95% confidence interval) resulting in the consequence indicated in the y axis. The FDR-adjusted p value is derived from a two-sided Welch’s test. ORF, open reading frame; IDR, intrinsically disordered regions; NMD, nonsense-mediated decay.
Figure 5.
Figure 5.. Global disruption of cellular transcription termination during EBV lytic replication
(A) RNA-seq read coverage showing example of TBC1D10A DoG transcript resulting in transcription read-in of the downstream CASTOR1 gene, and continued transcription readthrough into the farther downstream OSM gene. Gray coverage represents read mapping to intragenic regions, and orange coverage represents read mapping to intergenic regions. Note that the coordinates of this locus were flipped to depict rightward transcription of these negative-stranded genes. Data are presented as averaged coverage plots for each fraction (n = 5 LCL biological replicates). (B) Expression of the TBC1D10A DoG transcript and the downstream read-in genes, CASTOR1 and OSM. Data are presented as mean ± SEM (n = 5 LCL biological replicates). The FDR-adjusted p value is derived from a two-sided Welch’s test. *padjusted ≤ 0.05. (C and E) Stacked bar graphs illustrating the number of host genes exhibiting (C) DoG formation and (E) transcriptional read-in in each fraction. The blue segments represent DoGs and read-ins that are consistent across all replicates (n = 5 LCL biological replicates), while the gray segments denote those identified in only some replicates. (D and F) Venn diagrams comparing overlaps of host genes exhibiting (D) DoG formation and (F) transcriptional read-in for each fraction. These diagrams display only DoGs and read-ins consistently identified across all replicates (n = 5 LCL biological replicates).
Figure 6.
Figure 6.. BGLF5-KO schematic and validation
(A) The bottom panel shows a schematic of leftward transcripts in the BamHI G region of the inverted EBV M81 strain genome. The top panel displays average RNA-seq reads mapping to this region from lytic fractions of DFLR LCLs (n = 5 biological replicates) and DFLRΔBGLF5 LCLs (n = 3 biological replicates), confirming the absence of BGLF5 in the latter. (B) Flow data of LCLs transformed with DFLRΔBGLF5 EBV 72 h after pan-Ig treatment (left) and 72 h after combined pan-Ig and ganciclovir (GCV) treatment (right). (C) Stacked bar graphs quantifying total EBV mRNAs (latent and three lytic kinetic classes) within latent, early lytic, and late lytic fractions from DFLR LCLs (WT; n = 5 biological replicates) and DFLRΔBGLF5 LCLs (Δ; n = 3 biological replicates). Data are presented as mean ± SEM for each kinetic class. (D) Dotplot depicting differences in EBV-encoded mRNAs in early or late lytic fractions of DFLRΔBGLF5 LCLs (ΔBGLF5; n = 3 biological replicates) relative to DFLR LCLs (WT; n = 5 biological replicates). Dot size represents the mean MPC between conditions, and color represents the significance (FDR-adjusted Wald tests). Genes are grouped by EBV kinetics (latent, early, leaky late, and late). MPC, mRNA molecules per cell; NS, not significant.
Figure 7.
Figure 7.. Extensive BGLF5-independent host shutoff during EBV lytic replication
(A) MA plots demonstrating host gene-expression fold changes in early (left panel) and late (right panel) lytic fractions of DFLRΔBGLF5 LCLs (n = 3 biological replicates) relative to the latent fraction of DFLRΔBGLF5 LCLs (n = 5 biological replicates). The x axis depicts average levels of expression for each gene between conditions being compared. Differential expressed genes (padjusted ≤ 0.05; FDR-adjusted Wald tests) are indicated in red (upregulated) or blue (downregulated); genes without significant expression change are colored gray. Triangles indicate data points exceeding the displayed range. (B) Distribution of fold change in host gene-expression levels in early and late lytic fractions relative to the latent fraction for DFLR LCLs (WT; n = 5 biological replicates) and DFLRΔBGLF5 LCLs (ΔBGLF5; n = 3 biological replicates) visualized through superimposed box and violin plots. The mean log2 fold change in gene expression for each plot is denoted by red dots. The central line within each box marks the median, the box boundaries represent the 25th and 75th percentiles, and the whiskers extend to the minimum and maximum values. The number of analyzed genes passing filtering is presented under each fraction (n). The FDR-adjusted p values are derived from two-sided Welch’s tests. (C) Scatterplots comparing BGLF5-dependent (x axis) and BGLF5-independent (y axis) log2 fold changes (centered) in host gene expression in the early and late lytic fractions. BGLF5-dependent: DFLR LCLs vs. DFLRΔBGLF5 LCLs; BGLF5-independent: early or late lytic fraction relative to latent fraction in DFLRΔBGLF5 LCLs. Genes are colored based on their BGLF5 dependence: red (BGLF5-dependent, +), blue (BGLF5-independent, −), purple (both, ±), yellow (not significantly downregulated, Escapee). Data were filtered for non-differentially expressed genes between latent WT DFLR LCLs vs. latent DFLRΔBGLF5 LCLs (Figure S10B and Table S3). WT DFLR LCLs consist of five biological replicates and DFLRΔBGLF5 LCLs of three biological replicates. Triangles indicate data points exceeding the displayed range.

References

    1. Wong Y, Meehan MT, Burrows SR, Doolan DL, and Miles JJ (2022). Estimating the global burden of Epstein-Barr virus-related cancers. J. Cancer Res. Clin. Oncol 148, 31–46. 10.1007/s00432-021-03824-y. - DOI - PMC - PubMed
    1. Johannsen E, and Kaye K (2020). Epstein-Barr Virus (Infectious Mononucleosis, Epstein-Barr Virus-Associated Malignant Diseases, and Other Diseases). In Mandell, Douglas, and Bennett’s Principles and Practice of Infectious Diseases, Bennett J, Dolin R, and Blaser M, eds. (Elsevier; ), pp. 1872–1890.
    1. Bjornevik K, Cortese M, Healy BC, Kuhle J, Mina MJ, Leng Y, Elledge SJ, Niebuhr DW, Scher AI, Munger KL, and Ascherio A (2022). Longitudinal analysis reveals high prevalence of Epstein-Barr virus associated with multiple sclerosis. Science 375, 296–301. 10.1126/science.abj8222. - DOI - PubMed
    1. Damania B, Kenney SC, and Raab-Traub N (2022). Epstein-Barr Virus: Biology and clinical disease. Cell 185, 3652–3670. 10.1016/j.cell.2022.08.026. - DOI - PMC - PubMed
    1. Rosemarie Q, and Sugden B (2020). Epstein-Barr Virus: How Its Lytic Phase Contributes to Oncogenesis. Microorganisms 8, 1824. 10.3390/microorganisms8111824. - DOI - PMC - PubMed

Publication types

Substances