

A spatio-temporal methodology for greenhouse microclimatic mapping
- PMID: 39298381
- PMCID: PMC11412499
- DOI: 10.1371/journal.pone.0310454
A spatio-temporal methodology for greenhouse microclimatic mapping
Abstract
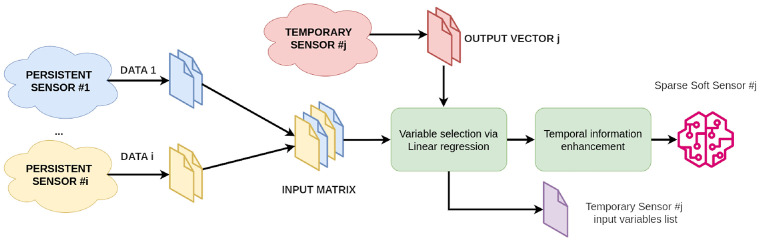
Greenhouse internal microclimate has been proven to be non-homogeneous in many aspects. However, this variability is only sometimes considered by greenhouse models, which often calculate climatic variables without any spatial reference. Farmers, on the other hand, may wish to have these differences highlighted as they could lead to aimed actions only for a specific area of the greenhouse, while at the same time, they are not willing to invest in sensors to be installed everywhere. This paper presents a data-driven methodology to generate a virtual 2D map of a greenhouse, which allows farmers to control any critical parameter they desire with minimum investment, as monitoring is done via soft sensing with only a few actual sensors. The proposed flow starts with a set of temporary sensors placed in the points of interest; then, a model for each of them is developed via linear regression and, finally, a map of the entire area can be derived by interpolating values from these models. This allows the generation of accurate models at a reduced cost as temporary sensors can be reused at other locations. The methodology has been tested on adjacent greenhouses and in two farms, where temperature and other climatic variables have been monitored. Experimental results show that the proposed methodology can reach an adjusted R2 value of 98% for predicting values in different greenhouse locations.
Copyright: © 2024 Brentarolli et al. This is an open access article distributed under the terms of the Creative Commons Attribution License, which permits unrestricted use, distribution, and reproduction in any medium, provided the original author and source are credited.
Conflict of interest statement
The authors have declared that no competing interests exist.
Figures


References
-
- Revathi S, Sivakumaran N, Radhakrishnan TK. Design of solar-powered forced ventilation system and energy-efficient thermal comfort operation of greenhouse. Materials Today: Proceedings. 2021;46:9893–9900. doi: 10.1016/j.matpr.2021.01.409 - DOI
-
- Bailey BJ. MICROCLIMATE, PHYSICAL PROCESSES AND GREENHOUSE TECHNOLOGY. Acta Hortic. 1985;174:35–42. doi: 10.17660/ActaHortic.1985.174.2 - DOI
-
- Bersani C, Ouammi A, Sacile R, Zero E. Model Predictive Control of Smart Greenhouses as the Path towards Near Zero Energy Consumption. Energies. 2020;13(14). doi: 10.3390/en13143647 - DOI
-
- Liao R, Zhang S, Zhang X, Wang M, Wu H, Zhangzhong L. Development of smart irrigation systems based on real-time soil moisture data in a greenhouse: Proof of concept. Agricultural Water Management. 2021;245:106632. doi: 10.1016/j.agwat.2020.106632 - DOI
-
- Saranya K, Uva Dharini P, Uva Darshni P, Monisha S. IoT Based Pest Controlling System for Smart Agriculture. In: 2019 International Conference on Communication and Electronics Systems (ICCES); 2019. p. 1548–1552.
MeSH terms
LinkOut - more resources
Full Text Sources
