. 2024 Sep 20;385(6715):eadd8947.
doi: 10.1126/science.add8947. Epub 2024 Sep 20.

Germline mutations in a G protein identify signaling cross-talk in T cells

Hyoungjun Ham #  1   2   3 Huie Jing #  1   2 Ian T Lamborn #  1   2   4 Megan M Kober #  1   2 Alexey Koval #  5 Yamina A Berchiche #  6 D Eric Anderson  7 Kirk M Druey  8 Judith N Mandl  9 Bertrand Isidor  10   11 Carlos R Ferreira  12 Alexandra F Freeman  13 Sundar Ganesan  14 Meliha Karsak  15   16 Peter J Mustillo  17   18 Juliana Teo  19 Zarazuela Zolkipli-Cunningham  20   21 Nicolas Chatron  22   23 François Lecoquierre  24 Andrew J Oler  25 Jana Pachlopnik Schmid  26   27 Douglas B Kuhns  28 Xuehua Xu  29 Fabian Hauck  30 Waleed Al-Herz  31   32 Matias Wagner  33   34   35 Paulien A Terhal  36 Mari Muurinen  37   38   39 Vincent Barlogis  40   41 Phillip Cruz  25 Jeffrey Danielson  1   2 Helen Stewart  42 Petra Loid  37   38   39 Sebastian Rading  15   16 Boris Keren  43   44 Rolph Pfundt  45 Kol A Zarember  13 Katharina Vill  46 Lorraine Potocki  47   48 Kenneth N Olivier  49 Gaetan Lesca  22   23 Laurence Faivre  50   51 Melanie Wong  52 Anne Puel  53   54   55 Janet Chou  56 Maud Tusseau  57   58 Niki M Moutsopoulos  59 Helen F Matthews  2   60 Cas Simons  61   62 Ryan J Taft  63   64 Ariane Soldatos  65 Etienne Masle-Farquhar  66   67 Stefania Pittaluga  68 Robert Brink  69   70 Danielle L Fink  28 Heidi H Kong  71 Juraj Kabat  14 Woo Sung Kim  29 Tatjana Bierhals  16 Kazuyuki Meguro  1   2 Amy P Hsu  13 Jingwen Gu  25 Jennifer Stoddard  72 Benito Banos-Pinero  73 Maria Slack  74 Giampaolo Trivellin  75 Benoît Mazel  51   76 Maarja Soomann  26 Samuel Li  25 Val J Watts  77 Constantine A Stratakis  75 Maria F Rodriguez-Quevedo  3 Ange-Line Bruel  50   78 Marita Lipsanen-Nyman  38 Paul Saultier  40   79 Rashmi Jain  80 Daphne Lehalle  81 Daniel Torres  1   2 Kathleen E Sullivan  82 Sébastien Barbarot  83 Axel Neu  84 Yannis Duffourd  50   78 Morgan Similuk  85 Kirsty McWalter  86 Pierre Blanc  44 Stéphane Bézieau  10   11 Tian Jin  29 Raif S Geha  56 Jean-Laurent Casanova  53   54   55   87   88 Outi M Makitie  37   38   39 Christian Kubisch  16   89 Patrick Edery  22   90 John Christodoulou  62   91   92 Ronald N Germain  9 Christopher C Goodnow  66   93 Thomas P Sakmar  6   94 Daniel D Billadeau  3 Sébastien Küry #  10   11 Vladimir L Katanaev #  5   95 Yu Zhang #  1   2 Michael J Lenardo  2   4   60 Helen C Su  1   2   4
Affiliations

Germline mutations in a G protein identify signaling cross-talk in T cells

Hyoungjun Ham et al. Science. .

Abstract

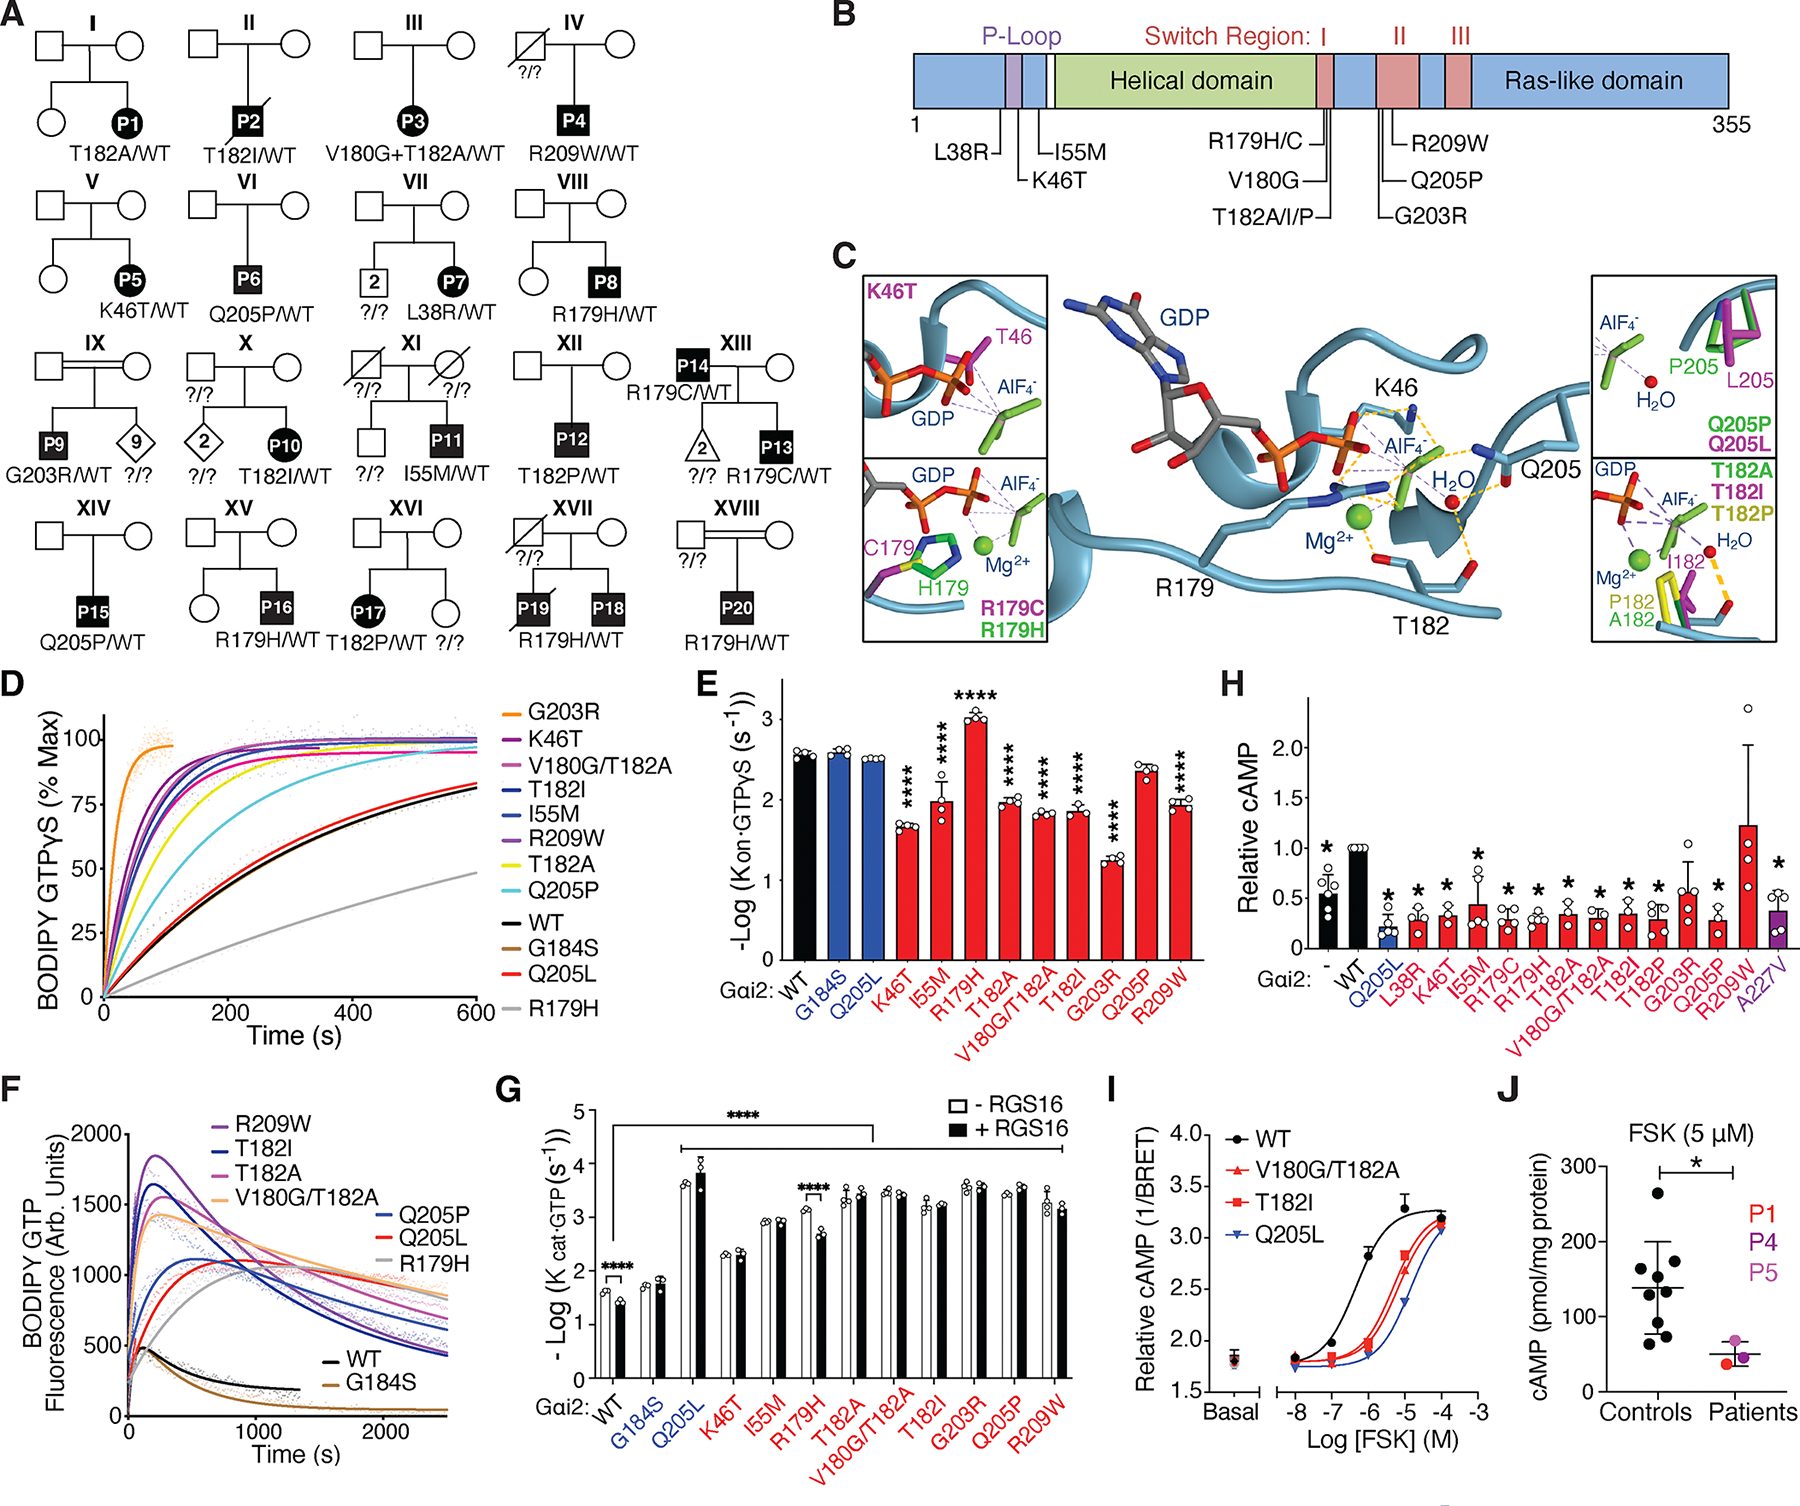
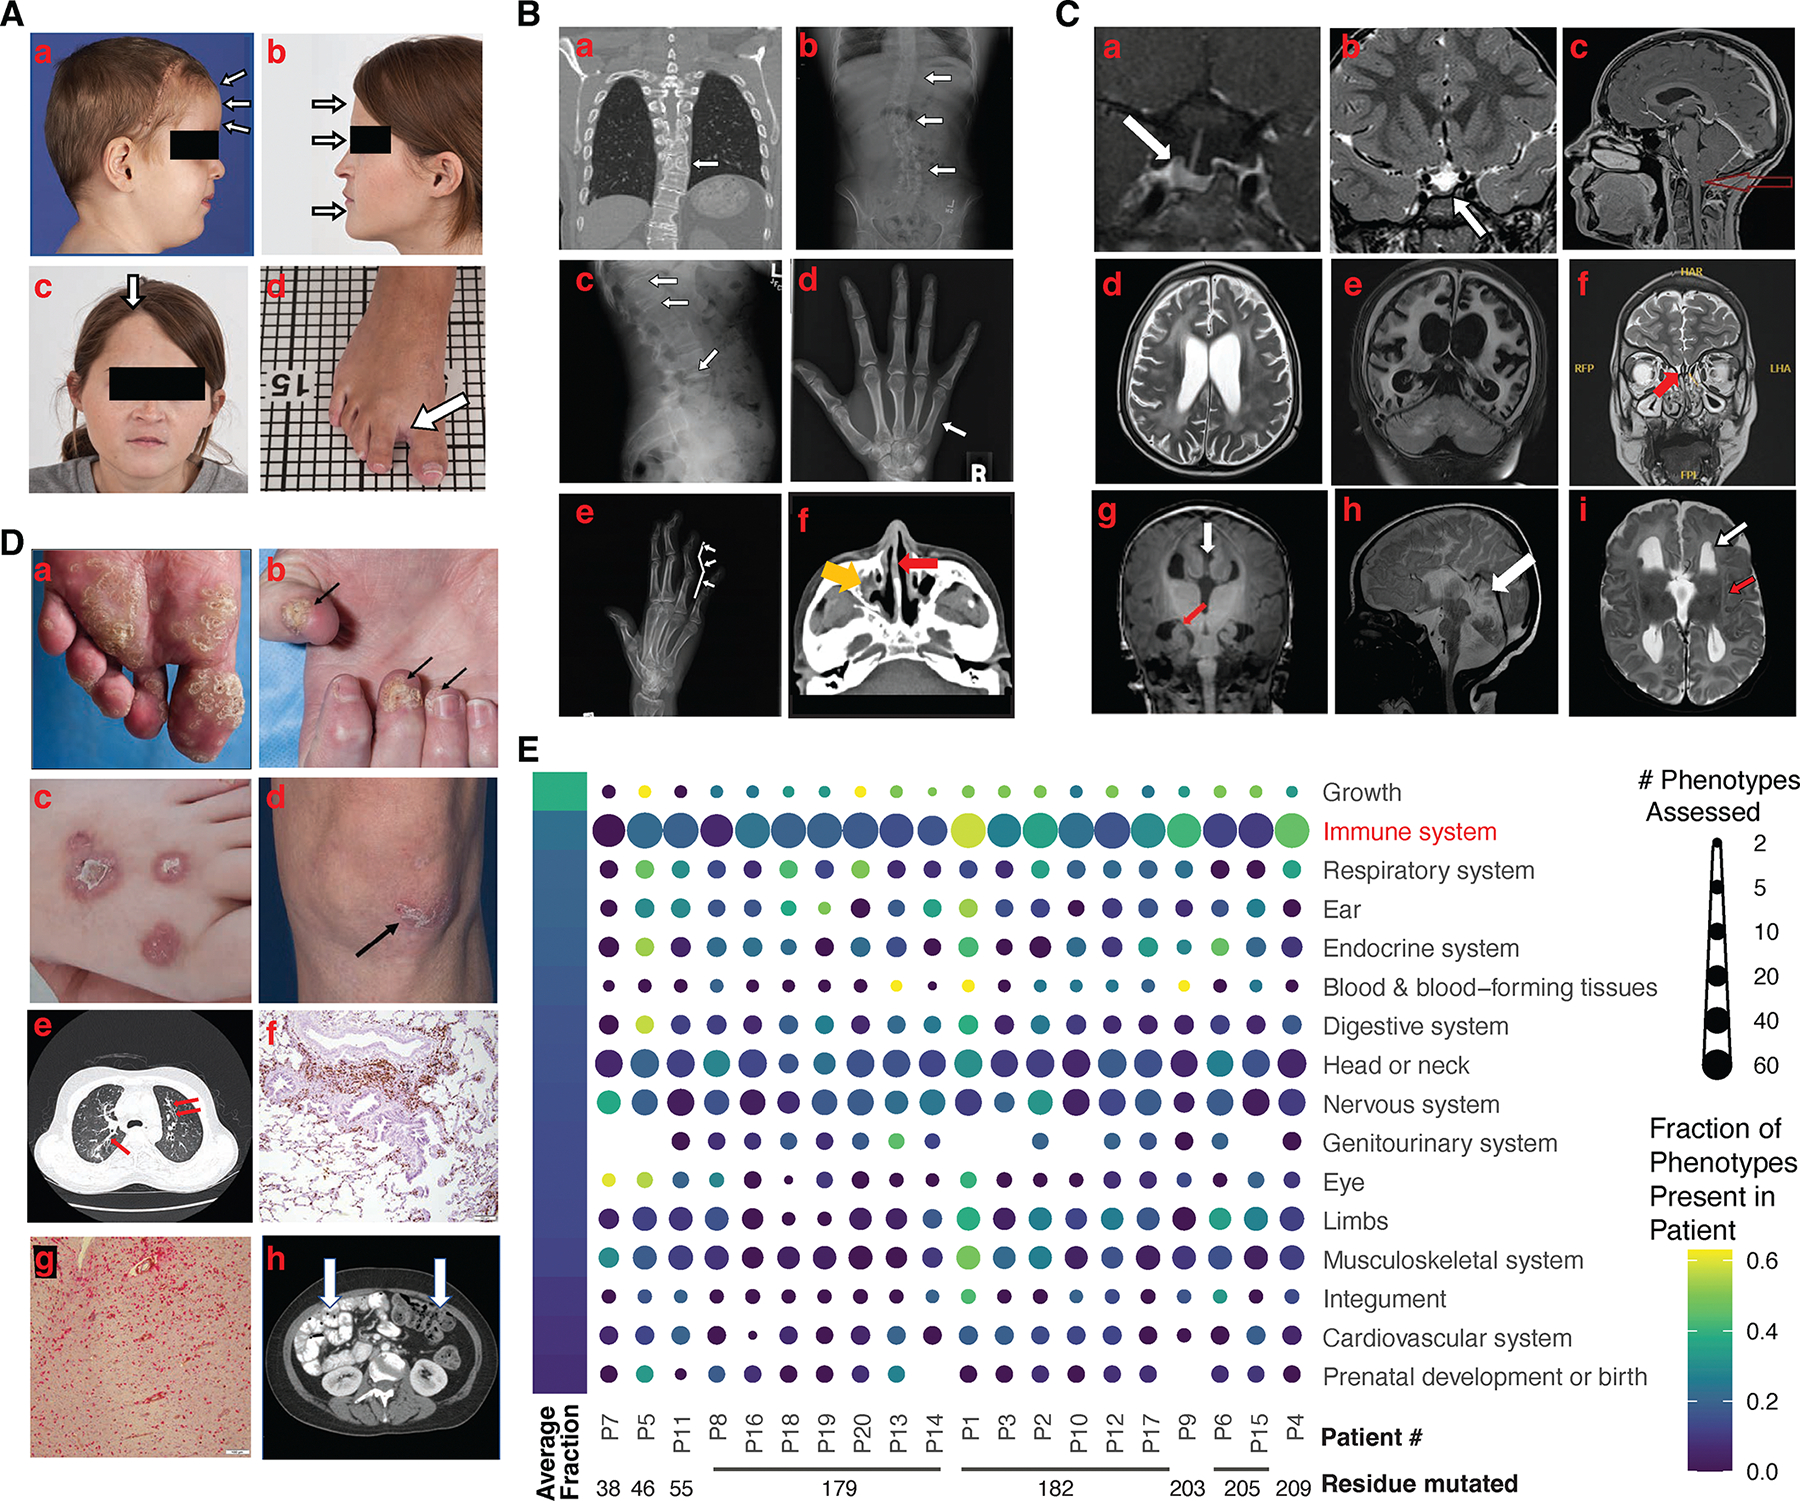
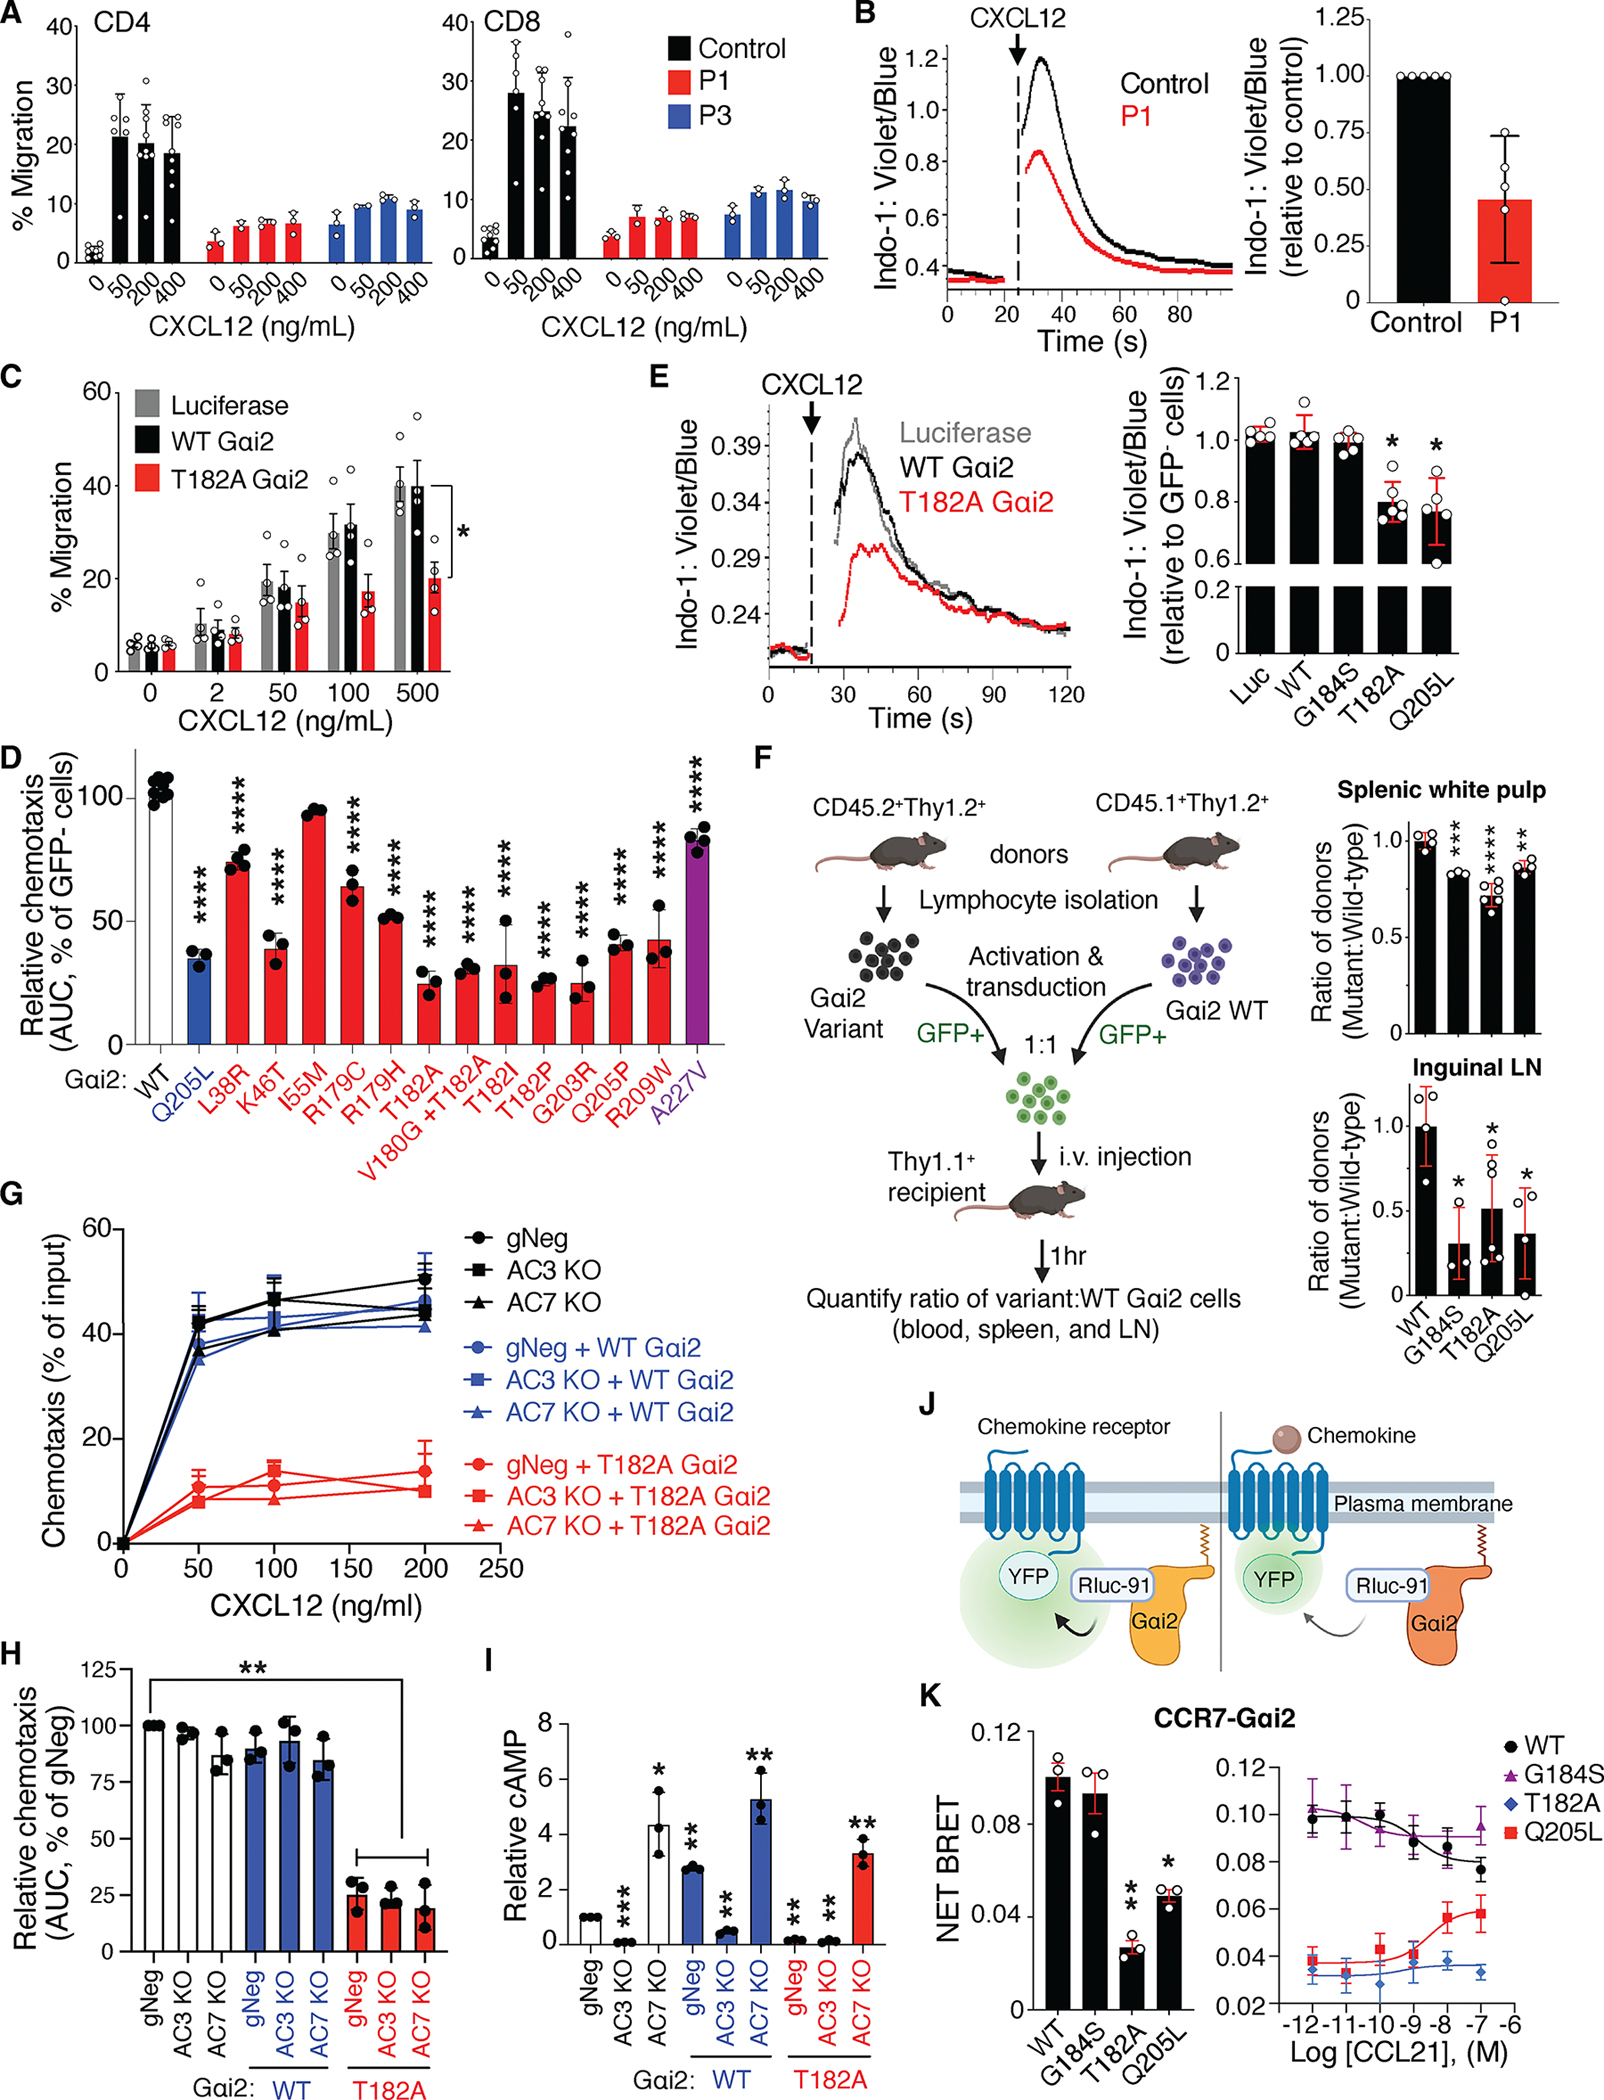
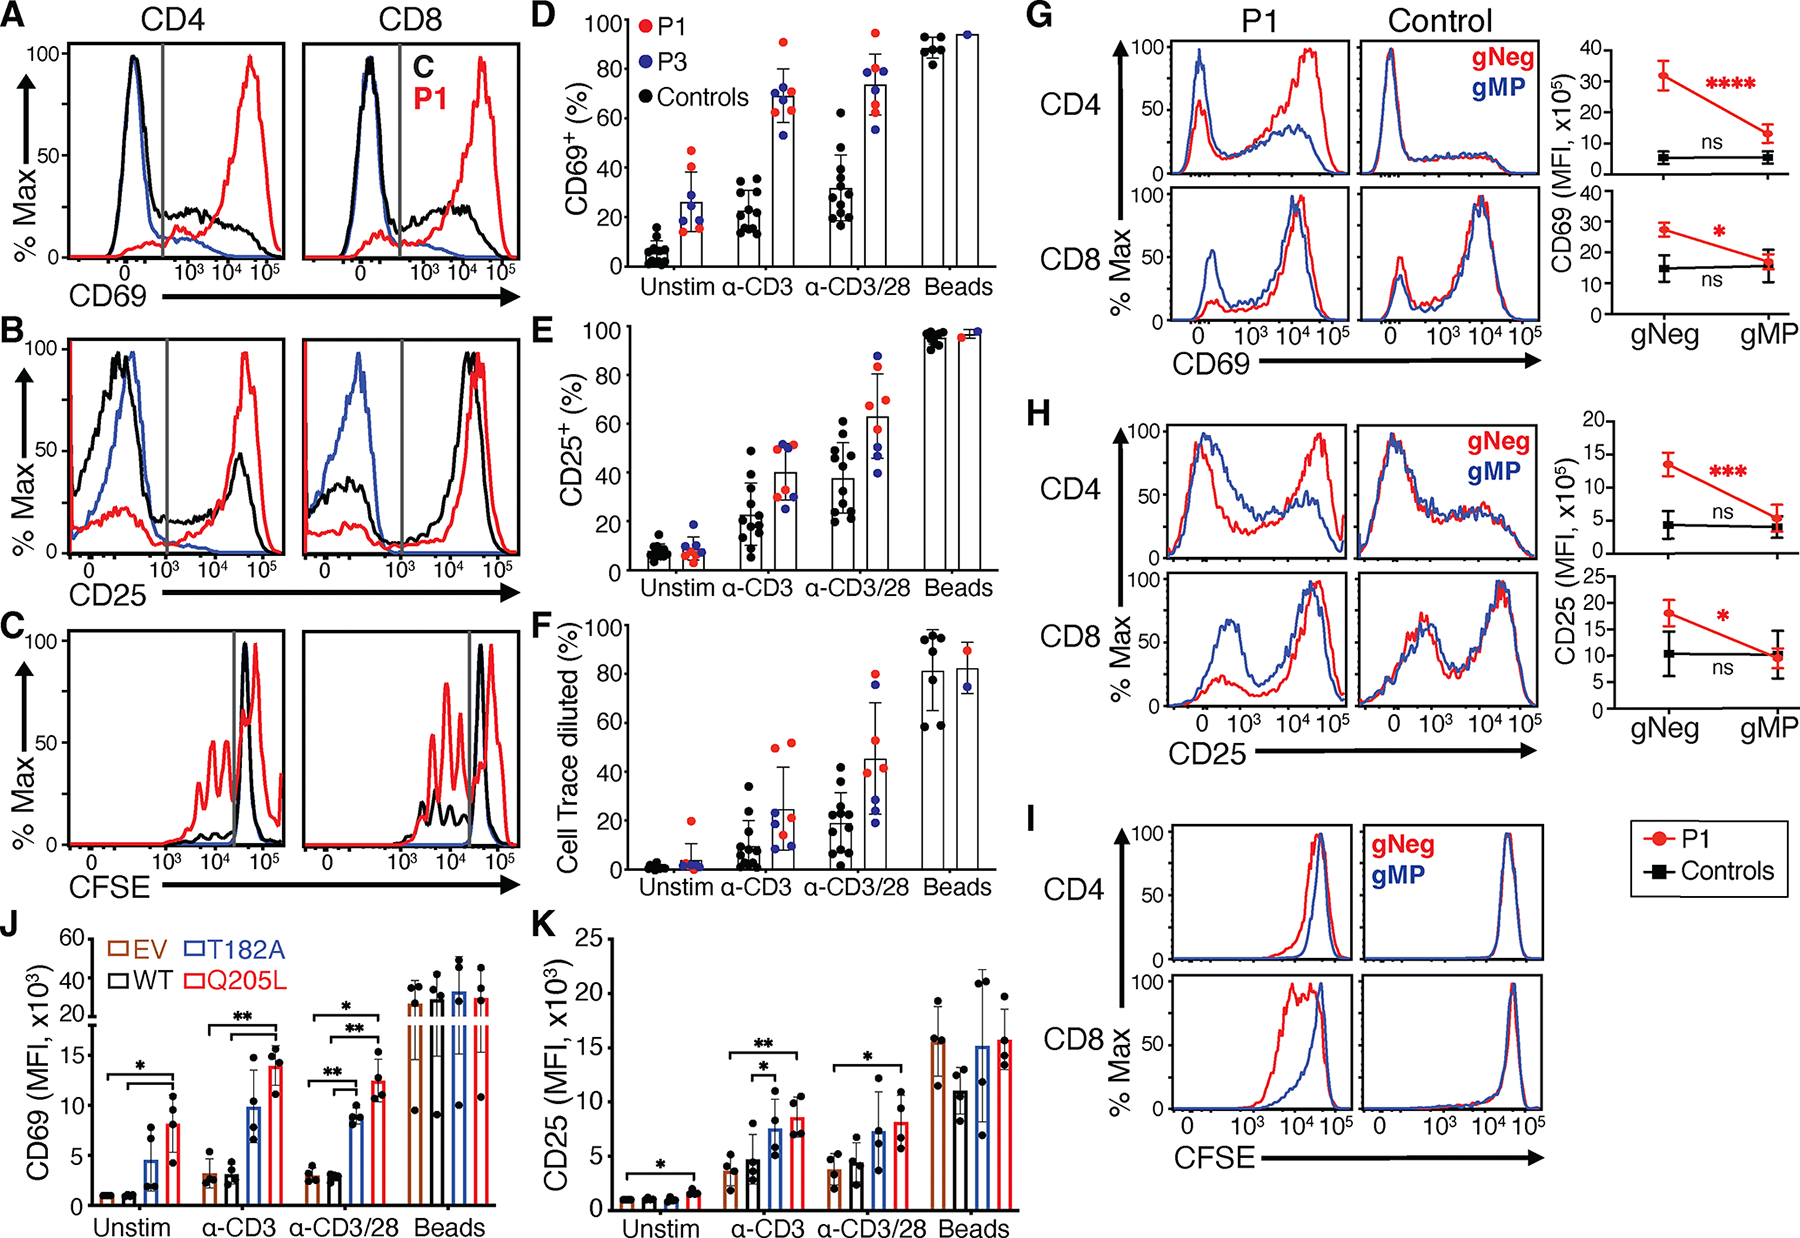
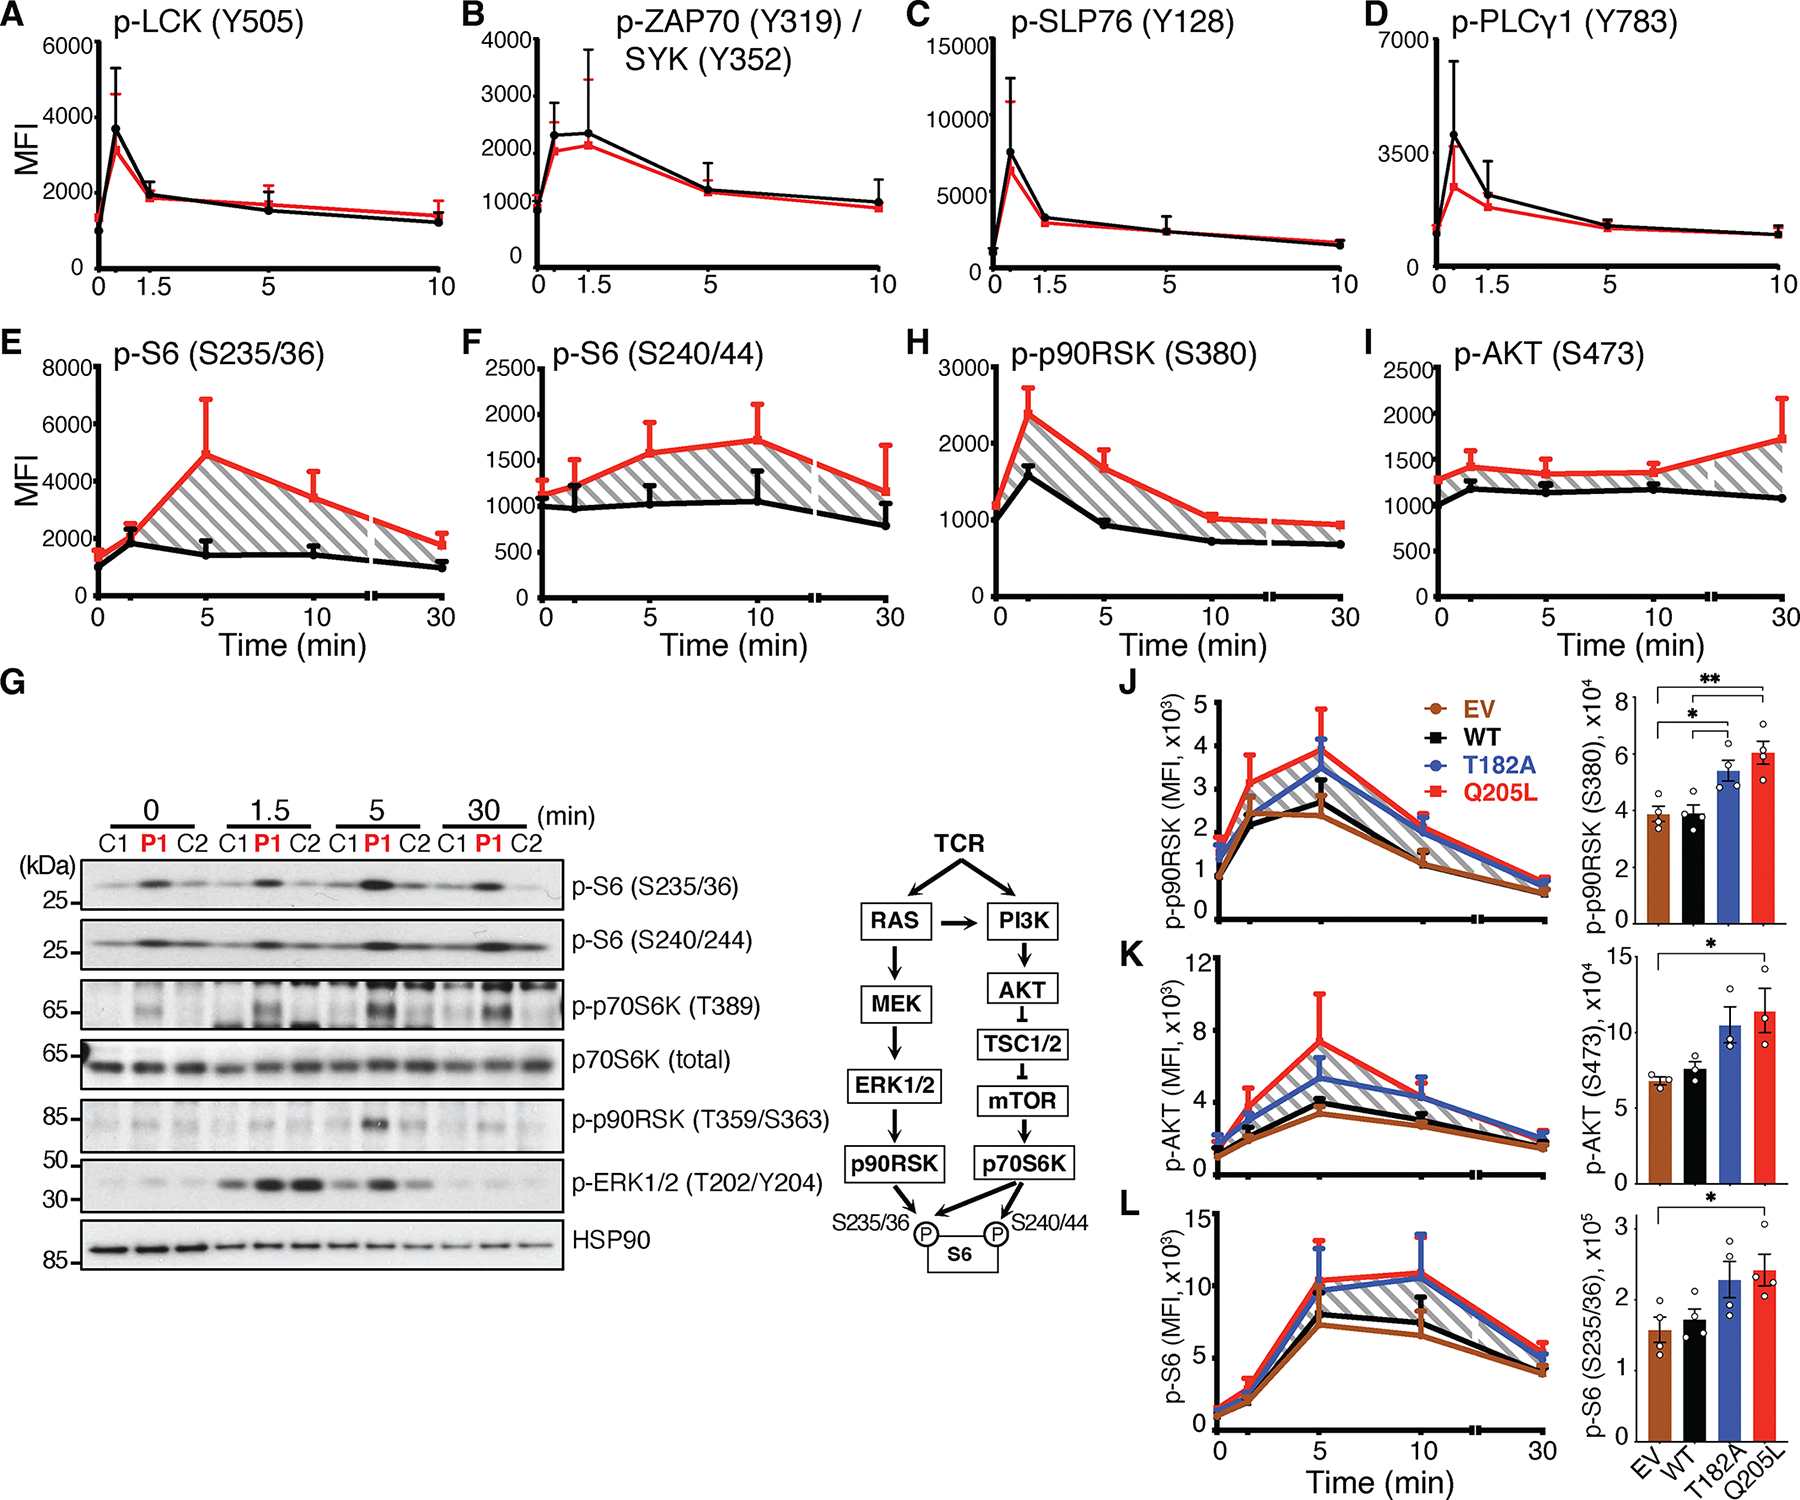
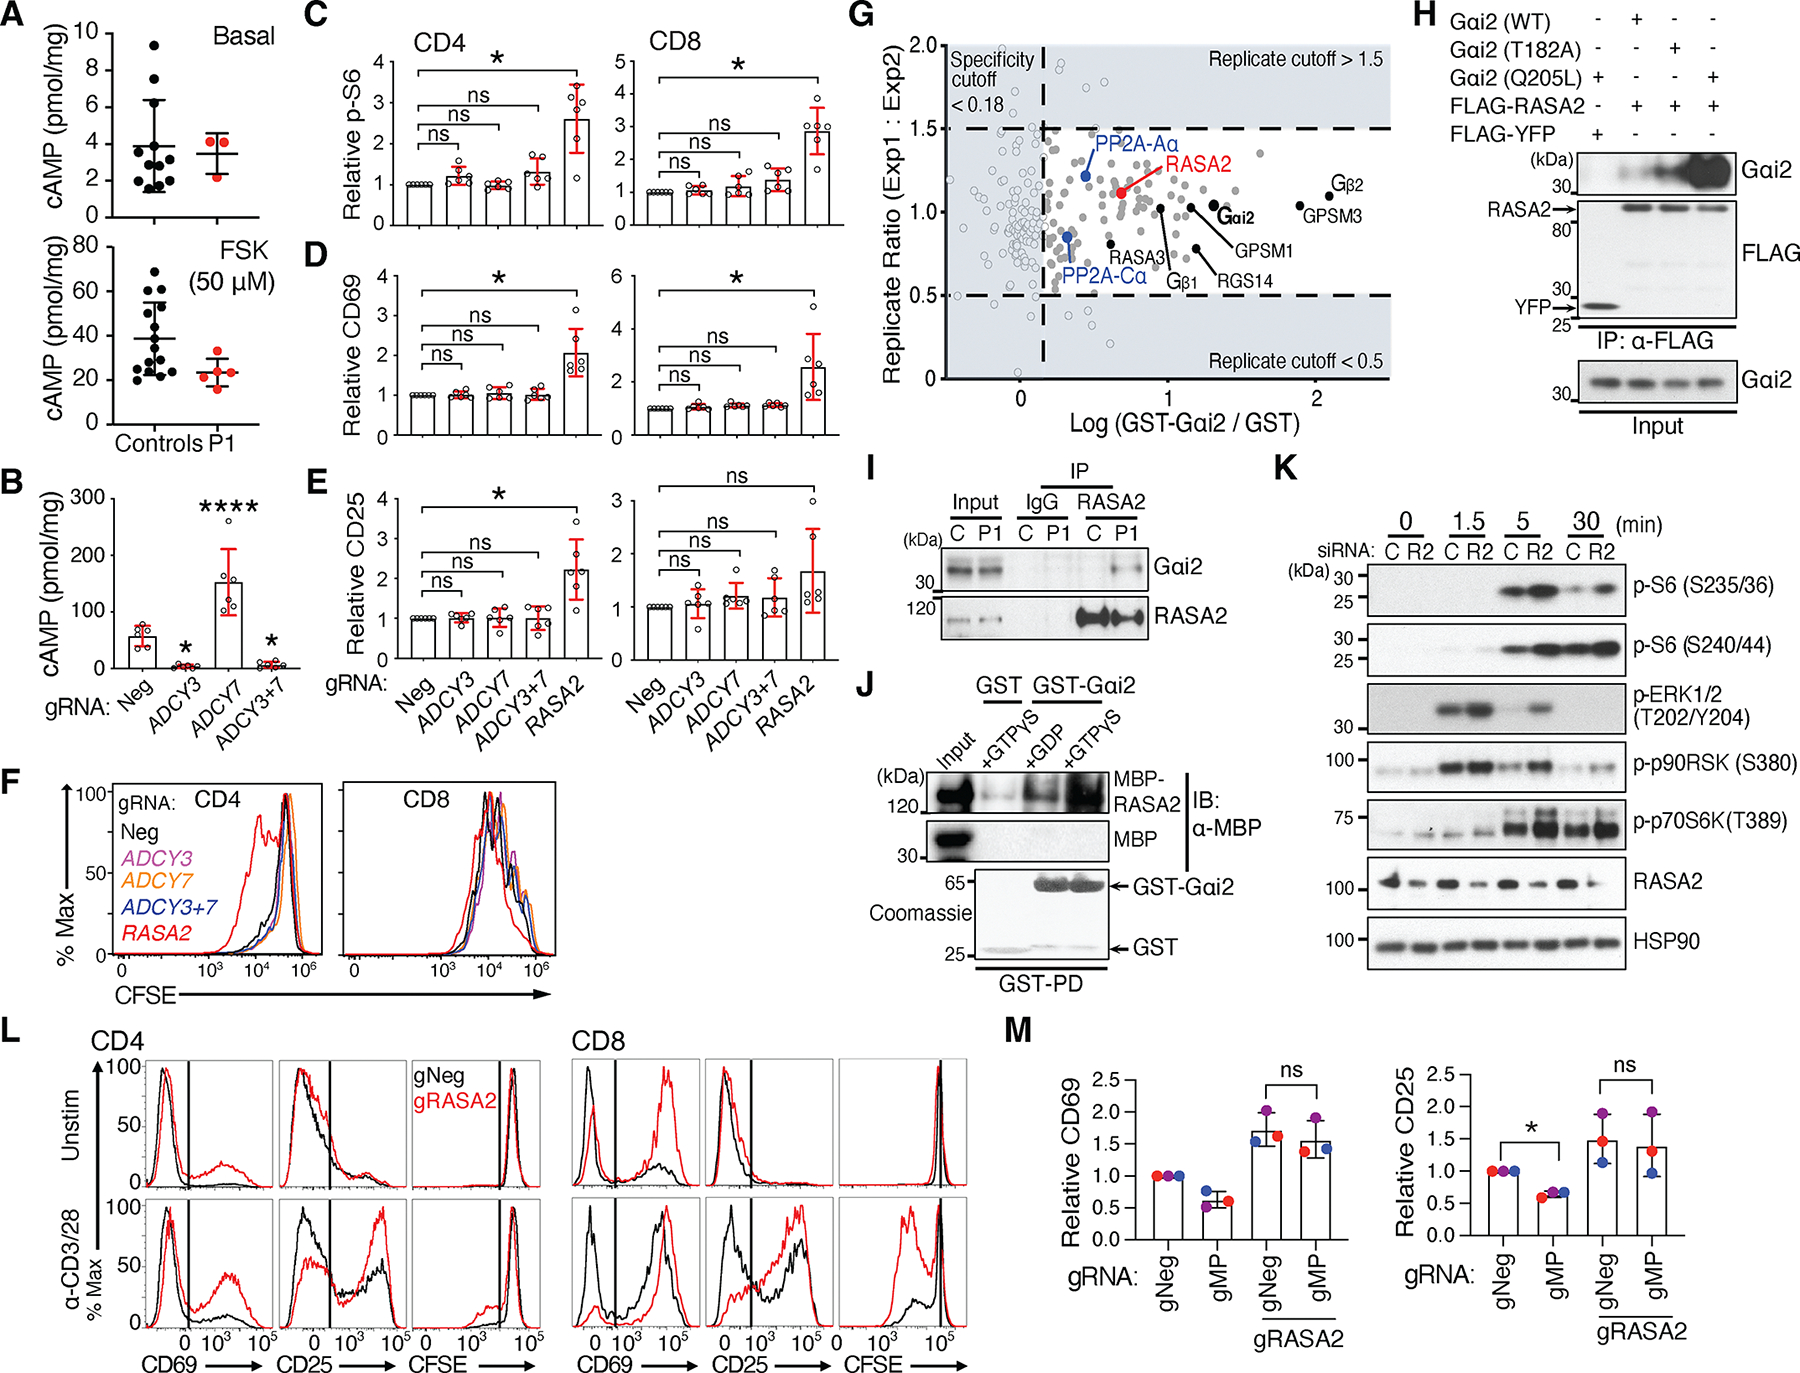
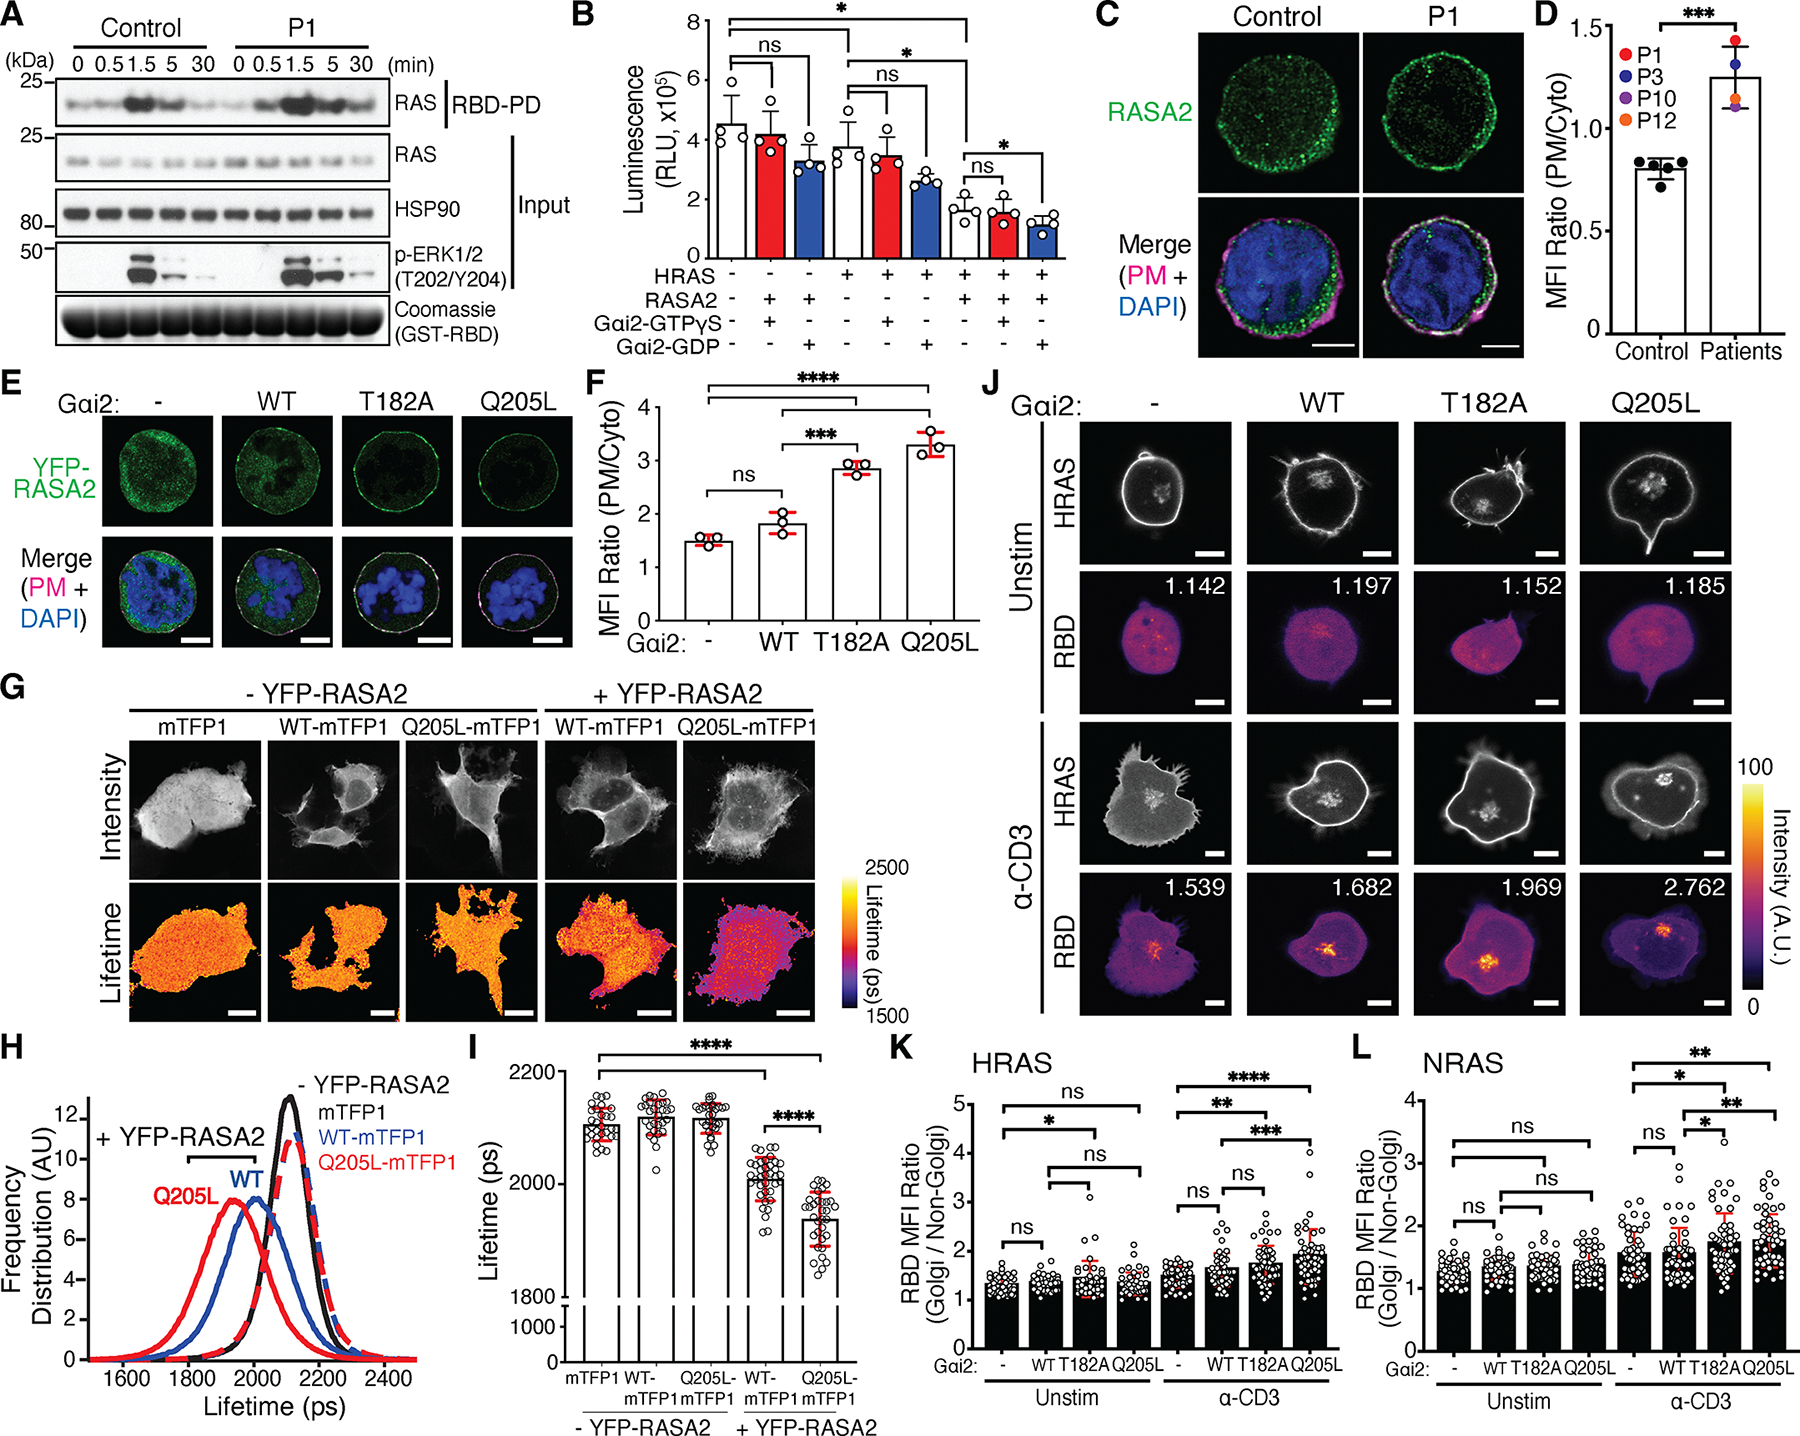
Humans with monogenic inborn errors responsible for extreme disease phenotypes can reveal essential physiological pathways. We investigated germline mutations in GNAI2, which encodes Gαi2, a key component in heterotrimeric G protein signal transduction usually thought to regulate adenylyl cyclase-mediated cyclic adenosine monophosphate (cAMP) production. Patients with activating Gαi2 mutations had clinical presentations that included impaired immunity. Mutant Gαi2 impaired cell migration and augmented responses to T cell receptor (TCR) stimulation. We found that mutant Gαi2 influenced TCR signaling by sequestering the guanosine triphosphatase (GTPase)-activating protein RASA2, thereby promoting RAS activation and increasing downstream extracellular signal-regulated kinase (ERK)/mitogen-activated protein kinase (MAPK) and phosphatidylinositol 3-kinase (PI3K)-AKT S6 signaling to drive cellular growth and proliferation.


Conflict of interest statement

Competing interests: H.C.S. holds stock in Amgen and Eli Lilly. K.M. is an employee of GeneDx, a genetic testing laboratory. R.J.T. is an Illumina Inc employee and shareholder. J.P.S. was a member of a data monitoring committee for Leniolisib for SOBI and Pharming within the last 3 years. C.A.S. was a paid consultant for Lundbeck pharmaceuticals. C.A.S. is an inventor on patent applications US-20030022180-A1 held by NIH that covers PRKAR1A and Carney complex, US-20090005337-A1 held by NIH that covers PDE11A and adrenal disease, US-20170304405-A1 held by NIH that covers treatment of hormonal disorders of growth, and US-20190314459-A1 held by NIH that covers GPR101 function. The other authors declare that they have no competing interests.

Figures

Figure 1.
Figure 1.. Humans with biochemically activating GNAI2 mutations.
(A) Patient pedigrees showing mutations and affected status. P8 was previously reported in a large cohort of individuals with developmental disorders (14). (B) Location of mutations in the Gαi2 protein, numbered according to the longest isoform that predominates across tissues including blood. (C) Structural model of Gαi2·GDP·Mg2+·AlF4 showing interactions in the GTPase catalytic site. AlF4 is a γ-phosphate mimic which acts as a transition state analog. Dashed lines, noncovalent bonds. Yellow, those mediated by Gαi2. Insets show patient variants disrupting the interactions. The noncovalent bond between amino acid 182 and the nucleophilic H2O is with the backbone amide oxygen on the residue. PDB: 1GFI. (D) GTP binding of non-hydrolyzable GTPγS by purified recombinant Gαi2 proteins. (E) Binding rate constants (konGTPγS) from (D). Red, patients’ variants. Blue, Q205L, GTPase-deficient positive control (18) and G184S, RGS-insensitive control (normal GDP/GTP exchange and intrinsic GTPase activity, but impaired RGS-mediated GTPase activity) (20). (F) GTPase assay. (G) Hydrolysis rate constants (kcatGTP), with (black) or without (white) RGS16, from (F). (H) Forskolin (FSK)-stimulated cAMP in 293T cells after transfection with Gαi2 variants, measured by ELISA. The increased cAMP in WT-transfected as compared to untransfected cells may reflect heterologous sensitization of AC (78). Purple, A227V, variant of unknown significance (15). (I) FSK-stimulated cAMP reporter activity in HEK293 cells transfected with Gαi2 variants and YFP-EPAC-RLuc reporter (and CXCR4). Relative cAMP was expressed as 1/BRET. (J) cAMP accumulation in primary fibroblasts from patients or healthy donors after FSK stimulation (see fig. S3I for basal levels). Data show representative (D, F, I) or mean ± SD (E, G, H, J) for 3–5 independent experiments (D-I), or for 3 patients (J). Individual points within graphs represent results from independent experiments (E, G, H, J). Statistical analyses were performed using one-way ANOVA with Tukey’s multiple comparisons for comparing individual variants to WT for (E) and (G, without RGS); multiple t-tests using the Holm-Sidak method for comparison between with or without RGS16 for each variant (G, white vs. black); one-sample t-test with Two-stage step-up method of Benjamini, Krieger and Yekutieli with hypothetical value of 1 for (H); and unpaired t-test for (J). *P<0.05; ****P<0.0001.
Figure 2.
Figure 2.. Selected clinical features of patients with activating GNAI2 mutations.
(A) Dysmorphism: frontal prominence (a), flat face (b), high anterior hairline (c), sandal gap deformity (d). (B) Skeletal abnormalities: sagittal cleft vertebra (a), scoliosis (b), irregular vertebral endplates (c), brachydactyly type E (d), swan-neck deformity (e), deviated nasal septum (red arrow) with chronic sinusitis (yellow arrow) (f). (C) Neurological and associated midline defects: misshapen sella turcica (a), hypoplastic pituitary gland (b), Chiari I malformation (c), diffuse leukodystrophy (d) progressing to end-stage neurodegeneration (e), absence of olfactory bulbs (arrow shown for one side) (f), agenesis of the corpus callosum (white arrow) and hippocampus malrotation (red arrow) (g), cerebellar dysplasia (h), and polymicrogyria as well as subependymal (white arrow) and band (red arrow) heterotopia (i). (D) Infectious and inflammatory complications: persistent warts (a, b), rubella-vaccine induced skin granulomas (c), psoriasiform rash (d), bronchiectasis (e), T cell infiltrates in lung (brown) (f) or brain (red) (g) in absence of infection. Intestinal malrotation (h). (E) Human phenotype ontology (HPO) summarized at top-level categories for each patient. Size of circle, number of phenotypes assessed for a patient within each category. No circle, fewer than 2 phenotypes assessed. Color scale, fraction of those phenotypes confirmed in a patient. Top-level categories were sorted from top to bottom based on the average fraction across patients. The proportion of immune phenotypes present was tested in patients having T182 mutations ([N = 6, sample median m = 0.315, SD = 0.145] compared to those without [N = 12, m = 0.194, SD = 0.131]; t(16) = 1.788, p-value = 0.046) by a one-tailed two-sample t-test. Patients 14 and 19 were removed from this analysis since patients 13 and 14 were related and patients 18 and 19 were related.
Figure 3.
Figure 3.. Gαi2 mutants impair chemokine receptor signaling by decoupling from chemokine receptors.
(A) Transwell migration to chemokines of T cells from patients or healthy donors. (B) CXCL12-stimulated Ca2+ fluxes from a patient or healthy donor T cells (left), quantified as area under the curve (AUC) and normalized to healthy donors (right). (C) Same as (A) using healthy donor T cells stably expressing Gαi2 variants or luciferase. (D) Same as (C) but quantified by normalizing AUC of transduced (GFP+) cells to untransduced (GFP) cells. (E) Same as (B) using healthy donor T cells stably expressing Gαi2 variants or luciferase, but quantified by normalizing AUC of transduced (GFP+) cells to untransduced (GFP) cells. (F) Migration after adoptive transfer of mouse T cells stably expressing Gαi2. Normalized ratio of variant to WT Gαi2 transduced donor cells recovered from splenic white pulp or inguinal lymph node. (G) Transwell migration of AC3 or AC7 KO human T cells also stably expressing Gαi2 variants or not. (H) AUC quantification of (G), normalized to gNeg-treated cells. (I) FSK-induced cAMP in cells from (G). (J) Schematized BRET reaction between Gαi2-RLuc91 and GPCR-YFP. Ligand binding (right) results in a reduction of pre-ligand (left) BRET signal (green). (K) Net BRET signal between Gαi2-RLuc91 and CCR7-YFP at basal conditions (left) or upon treatment with indicated chemokines (right). Gating strategies can be found in fig. S26A (for B), fig. S26B (for E), and fig. S26C (for F), and representative flow plots are presented in fig. S27A (for F). Data show representative (B, E left), means ± SEM (C, K) or means ± SD (A, B, E) for 3–6 (A-C, E) or 3 (K) experiments, or means ± SD of 2 independent experiments (F, total 3–5 mice/group), or means ± SD of 3 experiments from one of two different donor cell transductions (D, G-I). Combined results from multiple experiments are shown, with each individual point representing a different blood draw obtained longitudinally from a given patient (for A and B), or an individual recipient mouse (for F), or an independent experiment (C-E, H, I, K [left]). Statistical analyses were performed using Kruskal-Wallis test with Dunn’s multiple comparisons for (C) and (E), or one-way ANOVA with Dunnett’s multiple comparisons for (D), (F) and (K), or one-sample t-test with Two-stage step-up method of Benjamini, Krieger and Yekutieli for (H) and (I). *P<0.05; **P<0.01; ***P<0.001; ****P<0.0001.
Figure 4.
Figure 4.. Activating Gαi2 protein enhances T cell responses.
(A-F) TCR-induced surface expression of CD69 (A, D) and CD25 (B, E), and CFSE dilution (C, F) of naïve T cells purified from patient (P) or control (C) healthy donors. (A-C) Representative histograms of gated CD4+ (left) and CD8+ (right) T cells from P1 (red) and C (black) stimulated with soluble anti-CD3 and -CD28 antibodies (1 μg/mL). Unstimulated C (blue). (D-F) Quantification of CD69+ or CD25+ cells as % of gated CD4+ T cells from 2 patients and 12 controls. Each dot represents a different experiment using a different blood draw collected longitudinally over a span of 6 years. Unstim: unstimulated. α-CD3 or α-CD3/28: soluble anti-CD3 or anti-CD3 and -CD28 antibodies (1 μg/mL), Beads: bead-immobilized anti-CD2, -CD3, and -CD28 antibodies. (G-I) Same as (A-F) using P1 or control T cells treated with indicated Cas9/RNP and stimulated with anti-CD3 and anti-CD28 antibodies (0–1000 ng/mL; 100 ng/mL for representative histogram), except that Mean Fluorescence Intensity (MFI) was measured. MFI were plotted against doses of anti-CD3/28 (fig. S14D) to calculate AUC for each condition (G and H, right). gNeg is a non-specific guide RNA, and gMP targets the mutant GNAI2 allele of P1. (J and K) Same as (A, B, D, E) using CD4+ T cells stably expressing Gαi2 variants. EV: empty vector. Gating strategies can be found in fig. S26D (for A-I) and fig. S26E (for J and K). Data show representative flow plots alongside combined results with means ± SD for 4 (A-F, J and K), or 3 (G-I) experiments. Two-way ANOVA was performed with Sidak’s multiple comparisons using cell type (Control or P1) and gRNA target (gNeg or gMP) as factors for (G) and (H), or one-way ANOVA with Tukey’s multiple comparisons for (J) and (K). *P<0.05; **P<0.01; ***P<0.001; ****P<0.0001; ns = not significant. See also fig. S13 and S14 for related data.
Figure 5.
Figure 5.. Active Gαi2 enhances TCR-induced S6-regulatory pathways.
(A-I) Purified control (C) or P1 T cells were activated with anti-CD3 antibodies for the indicated times and samples subjected to flow-cytometry or immunoblot (G, left). (A-F, H, and I) Among the gated CD4+ T cells, MFI was measured. (G, right) Simplified diagram of TCR-induced signaling pathways. (J-L) Similar to (A-I) using CD4+ T cells from a healthy donor stably expressing Gαi2 variants and calculating AUC. EV: empty vector. Gating strategies can be found in fig. S26F (for A-F, H, I) and fig. S26G (for J-L). Individual data points and representative flow plots are presented in fig. S27B (for A-F, H, I) and in fig. S27C (for J-L). Data show representative (G), means ± SEM (J-L, right), or means ± SD (rest), based upon 3 (A-H, K), 2 (I), or 4 (rest) experiments. One-way ANOVA was performed with Dunnett’s multiple comparisons for (J), (K), and (L). *P<0.05; **P<0.01.
Figure 6.
Figure 6.. RASA2, a Gαi2 effector target, constrains T cell responses.
(A) cAMP accumulation in control or P1 T cells at baseline (top), or upon stimulation with FSK (bottom). (B-F) T cells were transfected with indicated Cas9/RNP. (B) cAMP accumulation upon FSK treatment. (C-F) AUC quantification of TCR-induced S6 (S235/36) phosphorylation (C), surface expression of CD69 (D) or CD25 (E), and CFSE dilution (F), on gated CD4+ or CD8+ T cells, relative to gNeg control, after flow cytometric measurements of MFI. Cells were stimulated with anti-CD3 and anti-CD28 antibodies in (D and E; 0–1000 ng/mL) and in (F; 100 ng/mL). (G) Graphical representation of Gαi2-interacting proteins. Black: known interactors. Red and blue: candidate interactors. (H) 293T cells were transfected as indicated. FLAG was immunoprecipitated (IP) and immunoblotted (right-adjacent labels designate the specificity of antibodies used). (I) Immunoblot of RASA2 IP with T cell lysates from P1 or control (C). (J) Interaction between purified glutathione-S-transferase (GST)-Gαi2 (loaded with either GDP or GTPγS) and maltose binding protein (MBP) or MBP-RASA2 fusion proteins via GST pulldown (PD). Coomassie stain: GST-fusion proteins used in PD. (K) Healthy donor T cells transfected with control (C) or RASA2-targeting (R2) siRNAs were stimulated with anti-CD3 antibodies for varying times, and lysates immunoblotted for indicated proteins. (L) TCR-induced surface expression of CD69 or CD25, and CFSE dilution of CD4+ or CD8+ T cells treated with gNeg (black) or gRASA2 (red) Cas9/RNP. Cells were stimulated with anti-CD3 and anti-CD28 antibodies (100 ng/mL). (M) AUC quantification of CD69 (left) or CD25 (right) expression on gated CD4+ T cells, relative to gNeg control, after flow cytometric measurements of MFI. Purified T cells from P1 were stimulated with increasing amounts of anti-CD3 and -CD28 antibodies (0–1000 ng/mL) after transfecting with the indicated Cas9/RNP9s (gNeg, gMP targeting mutant GNAI2 allele of P1, gRASA2). Each colored dot indicates an experiment from a different blood draw. Gating strategies can be found in fig. S26F (for C), fig. S26D (for D-F), fig. S26H (for L and M). Representative flow plots are presented in fig. S27D (for C), fig. S27E (for D), fig. S27F (for E), and fig. S27P (for M). Combined results from multiple experiments are shown with each individual point representing an independent experiment (A-E, M). Data show representative (F, H-L) or means ± SD (rest), based upon 3 (A [top], H-K, M), 5 (L), 5 (A [bottom]), or 6 (B-F) experiments. (G) shows the analysis combined from two independent PD experiments. One-way ANOVA was performed with Dunnett’s multiple comparisons for (B); one-sample t-test with Two-stage step-up method of Benjamini, Krieger and Yekutieli correction for multiple comparisons was performed with hypothetical value of 1 for (C-E); one-way ANOVA with Sidak’s multiple comparisons was performed to compare gNeg vs. gMP, gNeg vs. gRASA2, gNeg vs. gRASA2+gMP, or gRASA2 vs. gRASA2+gMP in (M). *P<0.05; ****P<0.0001; ns (not significant).
Figure 7.
Figure 7.. Active Gαi2 promotes RAS activity by redirecting RASA2 to plasma membrane.
(A) Control or P1 T cells were stimulated with anti-CD3 antibodies for varying times. Lysates were prepared for RBD pull down (PD) to detect active-RAS or for immunoblot for indicated proteins. Coomassie staining shows GST-RBD used in PD. (B) Purified HRAS, RASA2, and Gαi2 proteins (preloaded with GTPγS [non-hydrolyzable GTP analog that locks Gαi2 in active state] or GDP) were incubated as indicated with an excess of GTP. GTP consumption was determined by measuring remaining GTP level (represented by relative light units [RLU]). (C) RASA2 distribution in CD4+ T cells from P1 or healthy donor control. PM: plasma membrane. (D) MFI of RASA2 ratio, at the PM relative to cytoplasm region (Cyto) in (C) and fig. S22D from 4 patients and 5 controls. (E) Distribution of YFP-RASA2 in Gαi2 KO Jurkats co-expressing indicated Gαi2 variants. (F) Quantification of (E) as done in (D). (G-I) Fluorescence lifetime imaging (FLIM) of mTFP1 or Gαi2-mTFP1 (WT, Q205L) with or without YFP-RASA2 expression in 293T cells. (G) Fluorescence intensity (top), and lifetime (bottom) of mTFP1. (H) mTFP1 Fluorescence lifetime distribution. (I) Quantification of mTFP1 mean fluorescence lifetime. (J-L) Confocal microscopy colocalization analysis of unstimulated or TCR-induced active RAS distribution in Gαi2 KO Jurkats transfected with EGFP-HRAS (J and K) or NRAS (L), mCherry-RBD, and Cerulean-GalT along with Gαi2 variants as indicated. Unstim: unstimulated. (J) Number on RBD image represents MFI ratio of RBD at Golgi (defined by GalT stain) relative to non-Golgi region. (K and L) Quantification of RBD MFI ratio as in (J). Scale bar = 3 μm (C), 5 μm (E, J) or 10 μm (G). Data show representative or means ± SD for 3 (A, C-I, L) or 4 (B, J, K) experiments. Combined results from multiple experiments are shown (for B, D, and F), with each individual point representing an independent experiment (or a different patient for D). Each individual circle (for I, K, and L) corresponds to the value from a different cell, but with superimposed means ± SD from across multiple independent experiments. One-way ANOVA was performed with Tukey’s multiple comparisons for (B) and (F); unpaired t-test for (D); two-way ANOVA was performed using mutant type and experiment as factors for (I); three-way ANOVA was performed using transfectant, stimulation, and experimental repeat as factors for (K) and (L) and Tukey multiple comparison conditional on the stimulation status. *P<0.05; **P<0.01; ***P<0.001; ****P<0.0001; ns = not significant.

References

    1. Gilman AG, G proteins: transducers of receptor-generated signals. Annu Rev Biochem 56, 615–649 (1987). - PubMed
    1. Wettschureck N, Offermanns S, Mammalian G proteins and their cell type specific functions. Physiol Rev 85, 1159–1204 (2005). - PubMed
    1. Oldham WM, Hamm HE, Structural basis of function in heterotrimeric G proteins. Q Rev Biophys 39, 117–166 (2006). - PubMed
    1. Syrovatkina V, Alegre KO, Dey R, Huang XY, Regulation, Signaling, and Physiological Functions of G-Proteins. J Mol Biol 428, 3850–3868 (2016). - PMC - PubMed
    1. Taussig R, Iniguez-Lluhi JA, Gilman AG, Inhibition of adenylyl cyclase by Gi alpha. Science 261, 218–221 (1993). - PubMed

Publication types

MeSH terms

Substances