Multicenter Study
. 2024 Oct 3;26(10):euae244.
doi: 10.1093/europace/euae244.

Novel systematic processing of cardiac magnetic resonance imaging identifies target regions associated with infarct-related ventricular tachycardia

Affiliations
Multicenter Study

Novel systematic processing of cardiac magnetic resonance imaging identifies target regions associated with infarct-related ventricular tachycardia

Alba Ramos-Prada et al. Europace. .

Abstract

Aims: There is lack of agreement on late gadolinium enhancement cardiac magnetic resonance (LGE-CMR) imaging processing for guiding ventricular tachycardia (VT) ablation. We aim at developing and validating a systematic processing approach on LGE-CMR images to identify VT corridors that contain critical VT isthmus sites.

Methods and results: This is a translational study including 18 pigs with established myocardial infarction and inducible VT undergoing in vivo characterization of the anatomical and functional myocardial substrate associated with VT maintenance. Clinical validation was conducted in a multicentre series of 33 patients with ischaemic cardiomyopathy undergoing VT ablation. Three-dimensional LGE-CMR images were processed using systematic scanning of 15 signal intensity (SI) cut-off ranges to obtain surface visualization of all potential VT corridors. Analysis and comparisons of imaging and electrophysiological data were performed in individuals with full electrophysiological characterization of the isthmus sites of at least one VT morphology. In both the experimental pig model and patients undergoing VT ablation, all the electrophysiologically defined isthmus sites (n = 11 and n = 19, respectively) showed overlapping regions with CMR-based potential VT corridors. Such imaging-based VT corridors were less specific than electrophysiologically guided ablation lesions at critical isthmus sites. However, an optimized strategy using the 7 most relevant SI cut-off ranges among patients showed an increase in specificity compared to using 15 SI cut-off ranges (70 vs. 62%, respectively), without diminishing the capability to detect VT isthmus sites (sensitivity 100%).

Conclusion: Systematic imaging processing of LGE-CMR sequences using several SI cut-off ranges may improve and standardize procedure planning to identify VT isthmus sites.

Keywords: Imaging processing; Magnetic resonance imaging; Radiofrequency ablation; Ventricular tachycardia.


Conflict of interest statement

Conflict of interest: none declared.

Figures

Graphical Abstract
Graphical Abstract
Figure 1
Figure 1
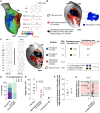
Imaging processing for identification of imaging-based potential subendocardial ventricular tachycardia (VT) corridors. (A) Representative workflow for imaging processing using the ADAS 3D software after semiautomatic segmentation of the left ventricle (LV). All VT corridors [using 15 sequential SI cut-off ranges] from 10 to 50% of the myocardial wall thickness were exported for further imaging processing using MATLAB. (B and C) Computed subendocardial VT corridors from all SI cut-off ranges were projected on the endocardial surface. Overlapping corridor areas from different subendocardial layers (i.e. 10 to 50% of myocardial wall thickness) or SI cut-off ranges were represented on the same area (C). SI, signal intensity.
Figure 2
Figure 2
Electrophysiological identification and segmentation of ventricular tachycardia regions of interest. (A) Sample electrophysiological characterization of a reentrant ventricular tachycardia (VT) circuit in the pig model. The activation map and entrainment manoeuvres were used to identify the VT isthmus. (B and C) Segmentation of the electrophysiologically (EP)-defined VT region of interest (ROI) on a sample activation map. The VT ROI is registered onto the left ventricular (LV) cardiac magnetic resonance (CMR) geometry for further comparisons with imaging-based potential VT corridors (C). CL, cycle length; EGM, electrogram; MV, mitral valve; PPI, post-pacing interval.
Figure 3
Figure 3
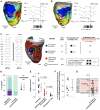
Imaging-based corridors contain isthmus sites for ventricular tachycardia (VT) maintenance in pigs. (A) Sample activation map and representative electrograms for reentry characterization of one VT morphology in a pig with infarct-related substrate. (B) Simultaneous visualization of cardiac magnetic resonance (CMR)-based potential VT corridors and the electrophysiologically (EP)-defined VT region of interest (ROI) of the VT shown in A. (C) Left: 12-lead ECG tracings of two fully characterized VT morphologies in the same heart as in A and B. Centre: visualization of the two EP-defined VT ROIs on the CMR geometry of the left ventricle (LV). Right: quantifications of the EP-defined VT ROIs, CMR-based potential VT corridors, and total scar area for the same heart. (D) Percentage of pigs with a specific number of inducible VT morphologies during the EP study and those with full characterization of the reentrant VT circuit. (E) Quantification of the areas of total scar, CMR-based potential VT corridors, and EP-defined VT ROIs in the eight pigs included in the analysis. The boundaries of the total scar area were defined using the first cut-off range of signal intensity (SI) values (33% for heterogeneous scar and 53% for dense scar). (F) Percentage of the area of EP-defined VT ROIs within the CMR-based potential VT corridors area. (G) Electrophysiological characterization of electrograms within overlapping regions. CL, cycle length; MV, mitral valve.
Figure 4
Figure 4
Imaging-based corridors contain isthmus sites for ventricular tachycardia (VT) maintenance in patients. (A and B) Sample activation maps and representative electrograms for reentry characterization of two VT morphologies in a patient with ischaemic cardiomyopathy. (C) Left: 12-lead ECG tracings of two fully characterized VT morphologies in the same heart as in A and B. Centre: visualization of the two electrophysiologically (EP)-defined VT regions of interest (ROIs) on the cardiac magnetic resonance (CMR) geometry of the left ventricle (LV). The areas of imaging-based potential VT corridors are shown in red. Right: quantifications of the EP-defined VT ROIs, CMR-based potential VT corridors, and total scar area for the same heart. (D) Percentage of patients with a specific number of inducible VT morphologies during the electrophysiological study and those with full characterization of the reentrant VT circuit. (E) Quantification of the areas of total scar, CMR-based potential VT corridors, and EP-defined VT ROIs in the 17 patients included in the analysis. (F) Percentage of the area of EP-defined VT ROIs within the CMR-based potential VT corridors area. (G) Electrophysiological characterization of electrograms within overlapping regions. CL, cycle length; MV, mitral valve.
Figure 5
Figure 5
Ablation results and ventricular tachycardia (VT) recurrences during the follow-up. (A) Sample activation map and entrainment manoeuvres to identify the VT isthmus site in a patient with electrophysiologically (EP) characterization of a reentrant VT circuit. (B) Upper panel: sample ablation lesions (in black) and estimated ablated area (in dark grey) for each lesion (diameter: 6 mm) in the sample case shown in A. Bottom panel: VT termination during radiofrequency delivery at the anatomical site indicated on the upper panel (white circle with black border). (C) Comparison of cardiac magnetic resonance (CMR)-based potential VT corridors with the ablated area. (D) Percentage of ablation lesions located within CMR-based potential VT corridors. (E) Pie chart showing the percentage of CMR-based potential VT corridors ablated for each patient of the series. Dots in the chart indicate individual patients. Black dots indicate patients without VT recurrences of any morphology at 1 year of follow-up. The brown dot in the chart indicates the only patient with documented VT recurrence at 1 year of follow-up (also the sample case shown in A and B. LV, left ventricle; PPI, post-pacing interval; ROI, region of interest; TCL, tachycardia cycle length.
Figure 6
Figure 6
Sensitivity and specificity of imaging-based ventricular tachycardia (VT) corridors to detect isthmus sites. (A) Left: sample tracings during VT with colour-coded dots that indicate intracardiac electrograms (EGMs) at different activation times relative (%) to the tachycardia cycle length (CL). The QRS onset was the reference to assign activation times. Colour-coded dots indicate different EGM-QRS times and their relative (%) activation time respect to the tachycardia CL. Middle and right: spatial positioning of colour-coded EGMs on the endocardial surface of the left ventricle (LV) with the corresponding imaging-derived potential VT corridors using 15 (middle) and 7 (right) signal intensity (SI) cut-off ranges. (B) Heart scheme showing healthy and infarct-related regions with their respective labels. Sensitivity and specificity values were calculated as indicated. (C) Sensitivity and specificity values of systematic imaging processing using 15 and 7 SI cut-off ranges to detect functionally relevant VT regions of interest (ROIs) containing VT isthmus sites. Cumulative data are shown as median and interquartile range. CMR, cardiac magnetic resonance; FN, false negative; FN, false positive; TN, true negative; TP, true positives. #Ishtmus EGMs outside CMR-based potential VT corridors were considered ‘0’ if interdependent isthmus EGMs (in other position of isthmus sites) were also detected on CMR-based potential VT corridors.

Similar articles

Cited by

References

    1. Tung R, Raiman M, Liao H, Zhan X, Chung FP, Nagel R et al. Simultaneous endocardial and epicardial delineation of 3D reentrant ventricular tachycardia. J Am Coll Cardiol 2020;75:884–97. - PubMed
    1. Anter E, Tschabrunn CM, Buxton AE, Josephson ME. High-resolution mapping of postinfarction reentrant ventricular tachycardia: electrophysiological characterization of the circuit. Circulation 2016;134:314–27. - PMC - PubMed
    1. Nishimura T, Shatz N, Weiss P, Zawaneh M, Bai R, Beaser AD et al. Identification of human ventricular tachycardia demarcated by fixed lines of conduction block in a 3-dimensional hyperboloid circuit. Circulation 2023;148:1354–67. - PubMed
    1. de Chillou C, Groben L, Magnin-Poull I, Andronache M, MagdiAbbas M, Zhang N et al. Localizing the critical isthmus of postinfarct ventricular tachycardia: the value of pace-mapping during sinus rhythm. Heart Rhythm 2014;11:175–81. - PubMed
    1. Di Biase L, Santangeli P, Burkhardt DJ, Bai R, Mohanty P, Carbucicchio C et al. Endo-epicardial homogenization of the scar versus limited substrate ablation for the treatment of electrical storms in patients with ischemic cardiomyopathy. J Am Coll Cardiol 2012;60:132–41. - PubMed

MeSH terms