. 2024 Oct 3;187(20):5719-5734.e19.
doi: 10.1016/j.cell.2024.08.039. Epub 2024 Sep 18.

High-resolution functional mapping of RAD51C by saturation genome editing

Affiliations

High-resolution functional mapping of RAD51C by saturation genome editing

Rebeca Olvera-León et al. Cell. .

Abstract

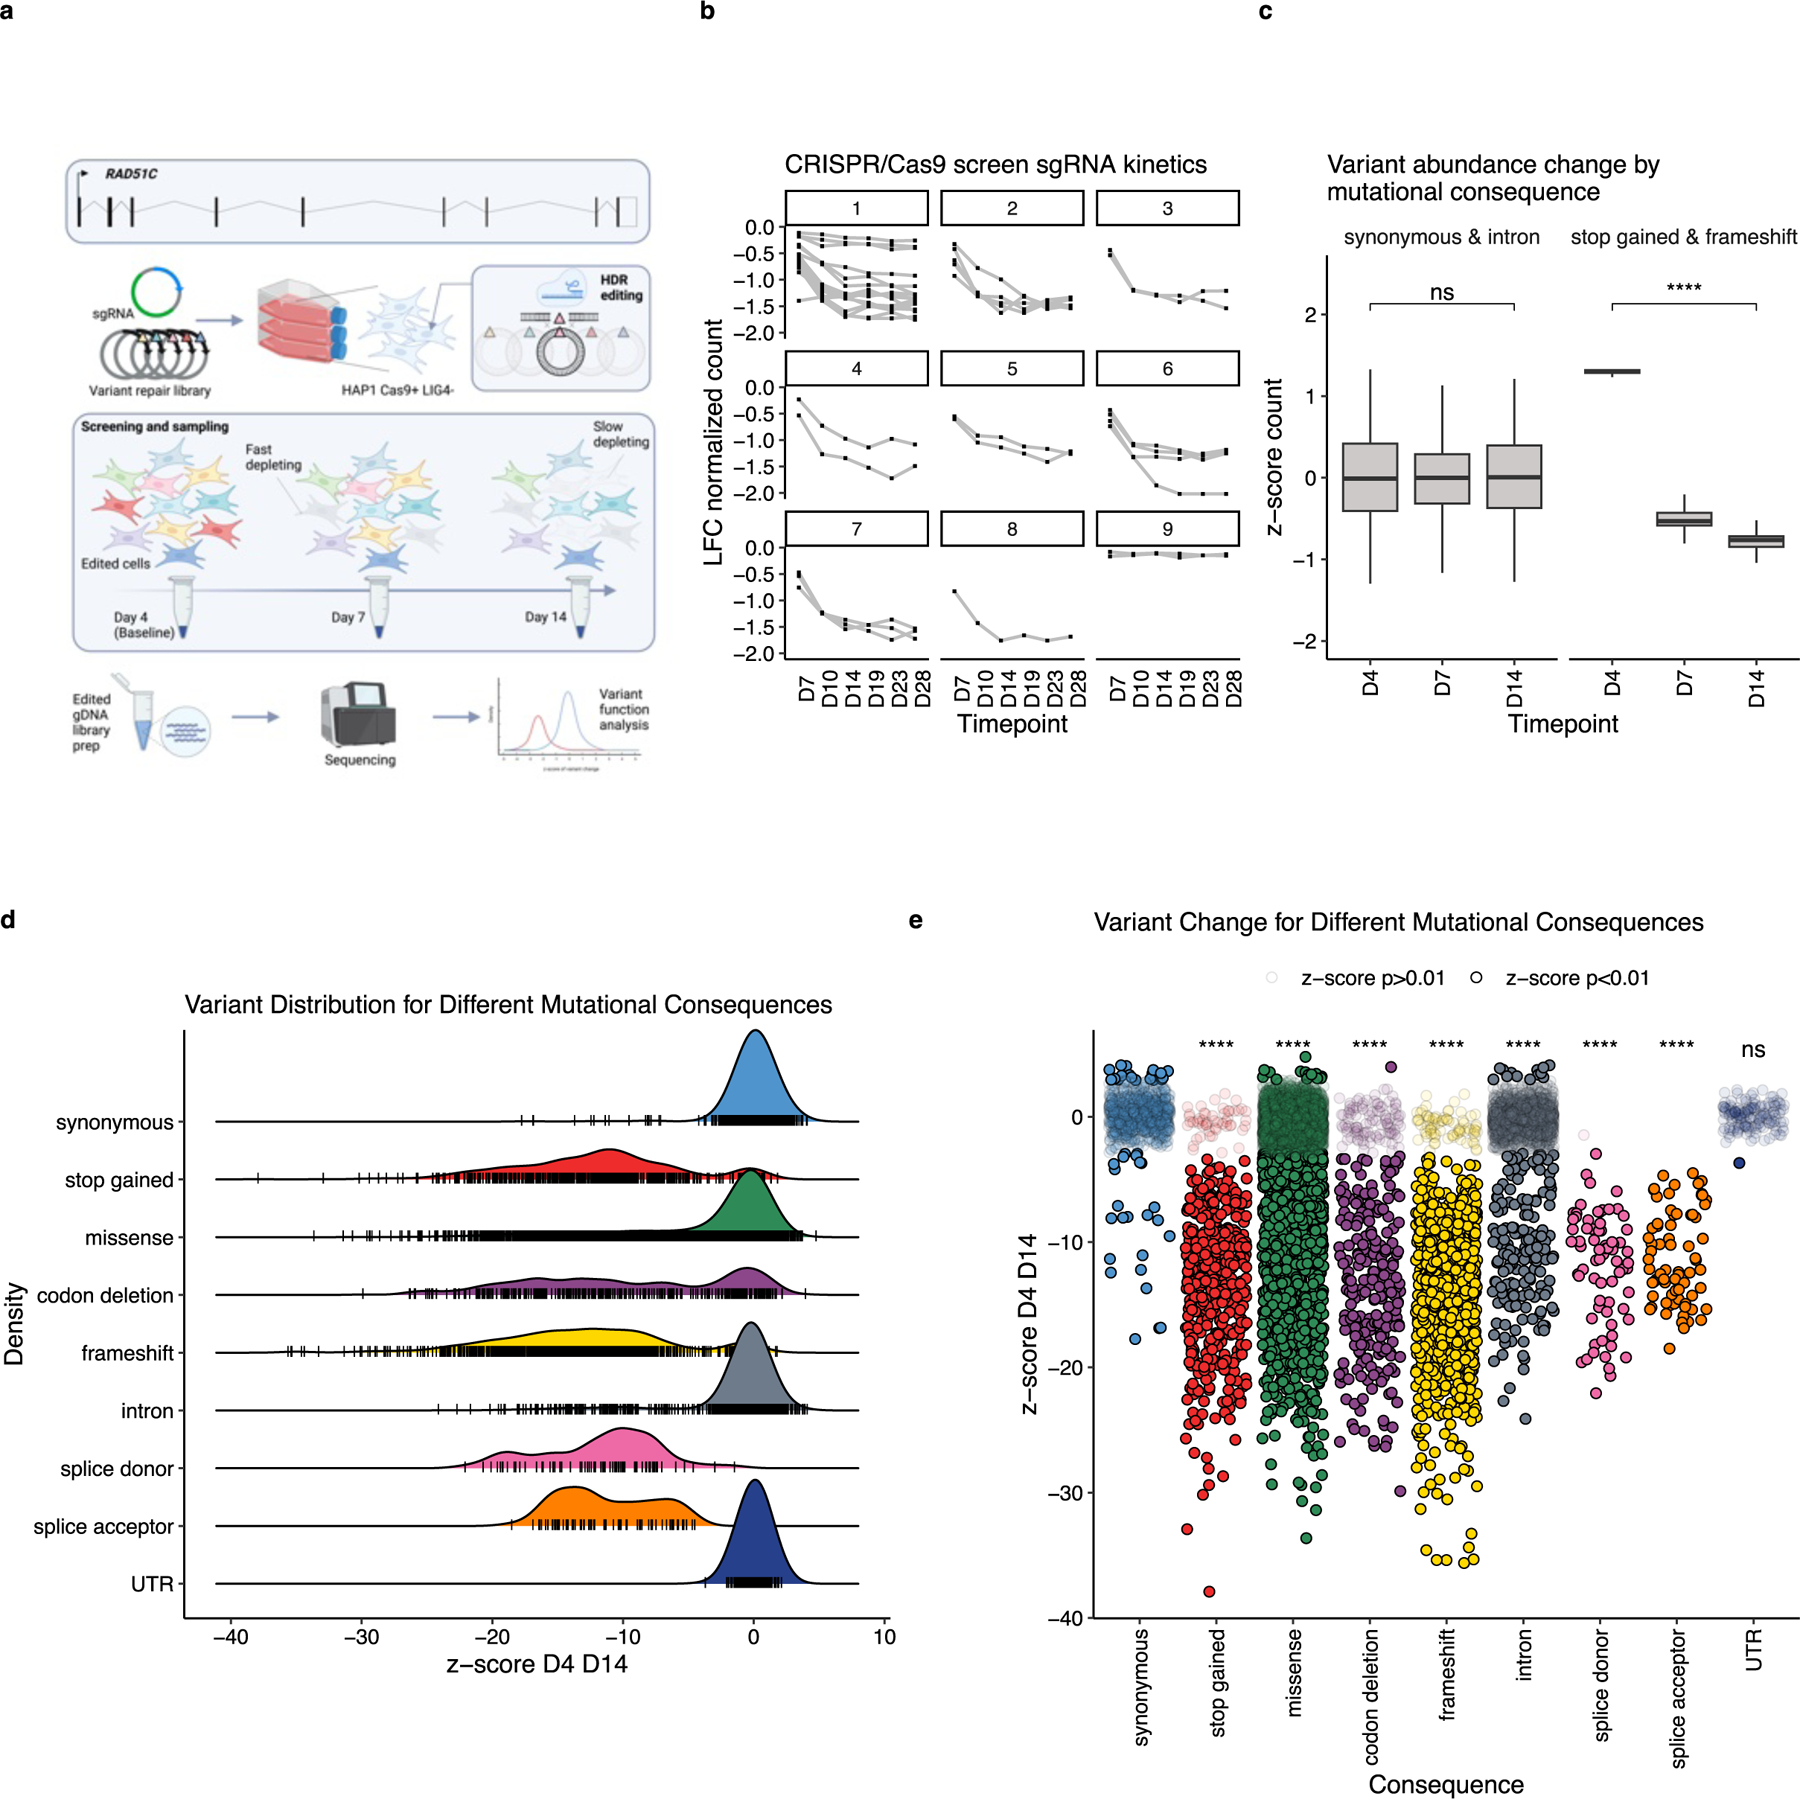
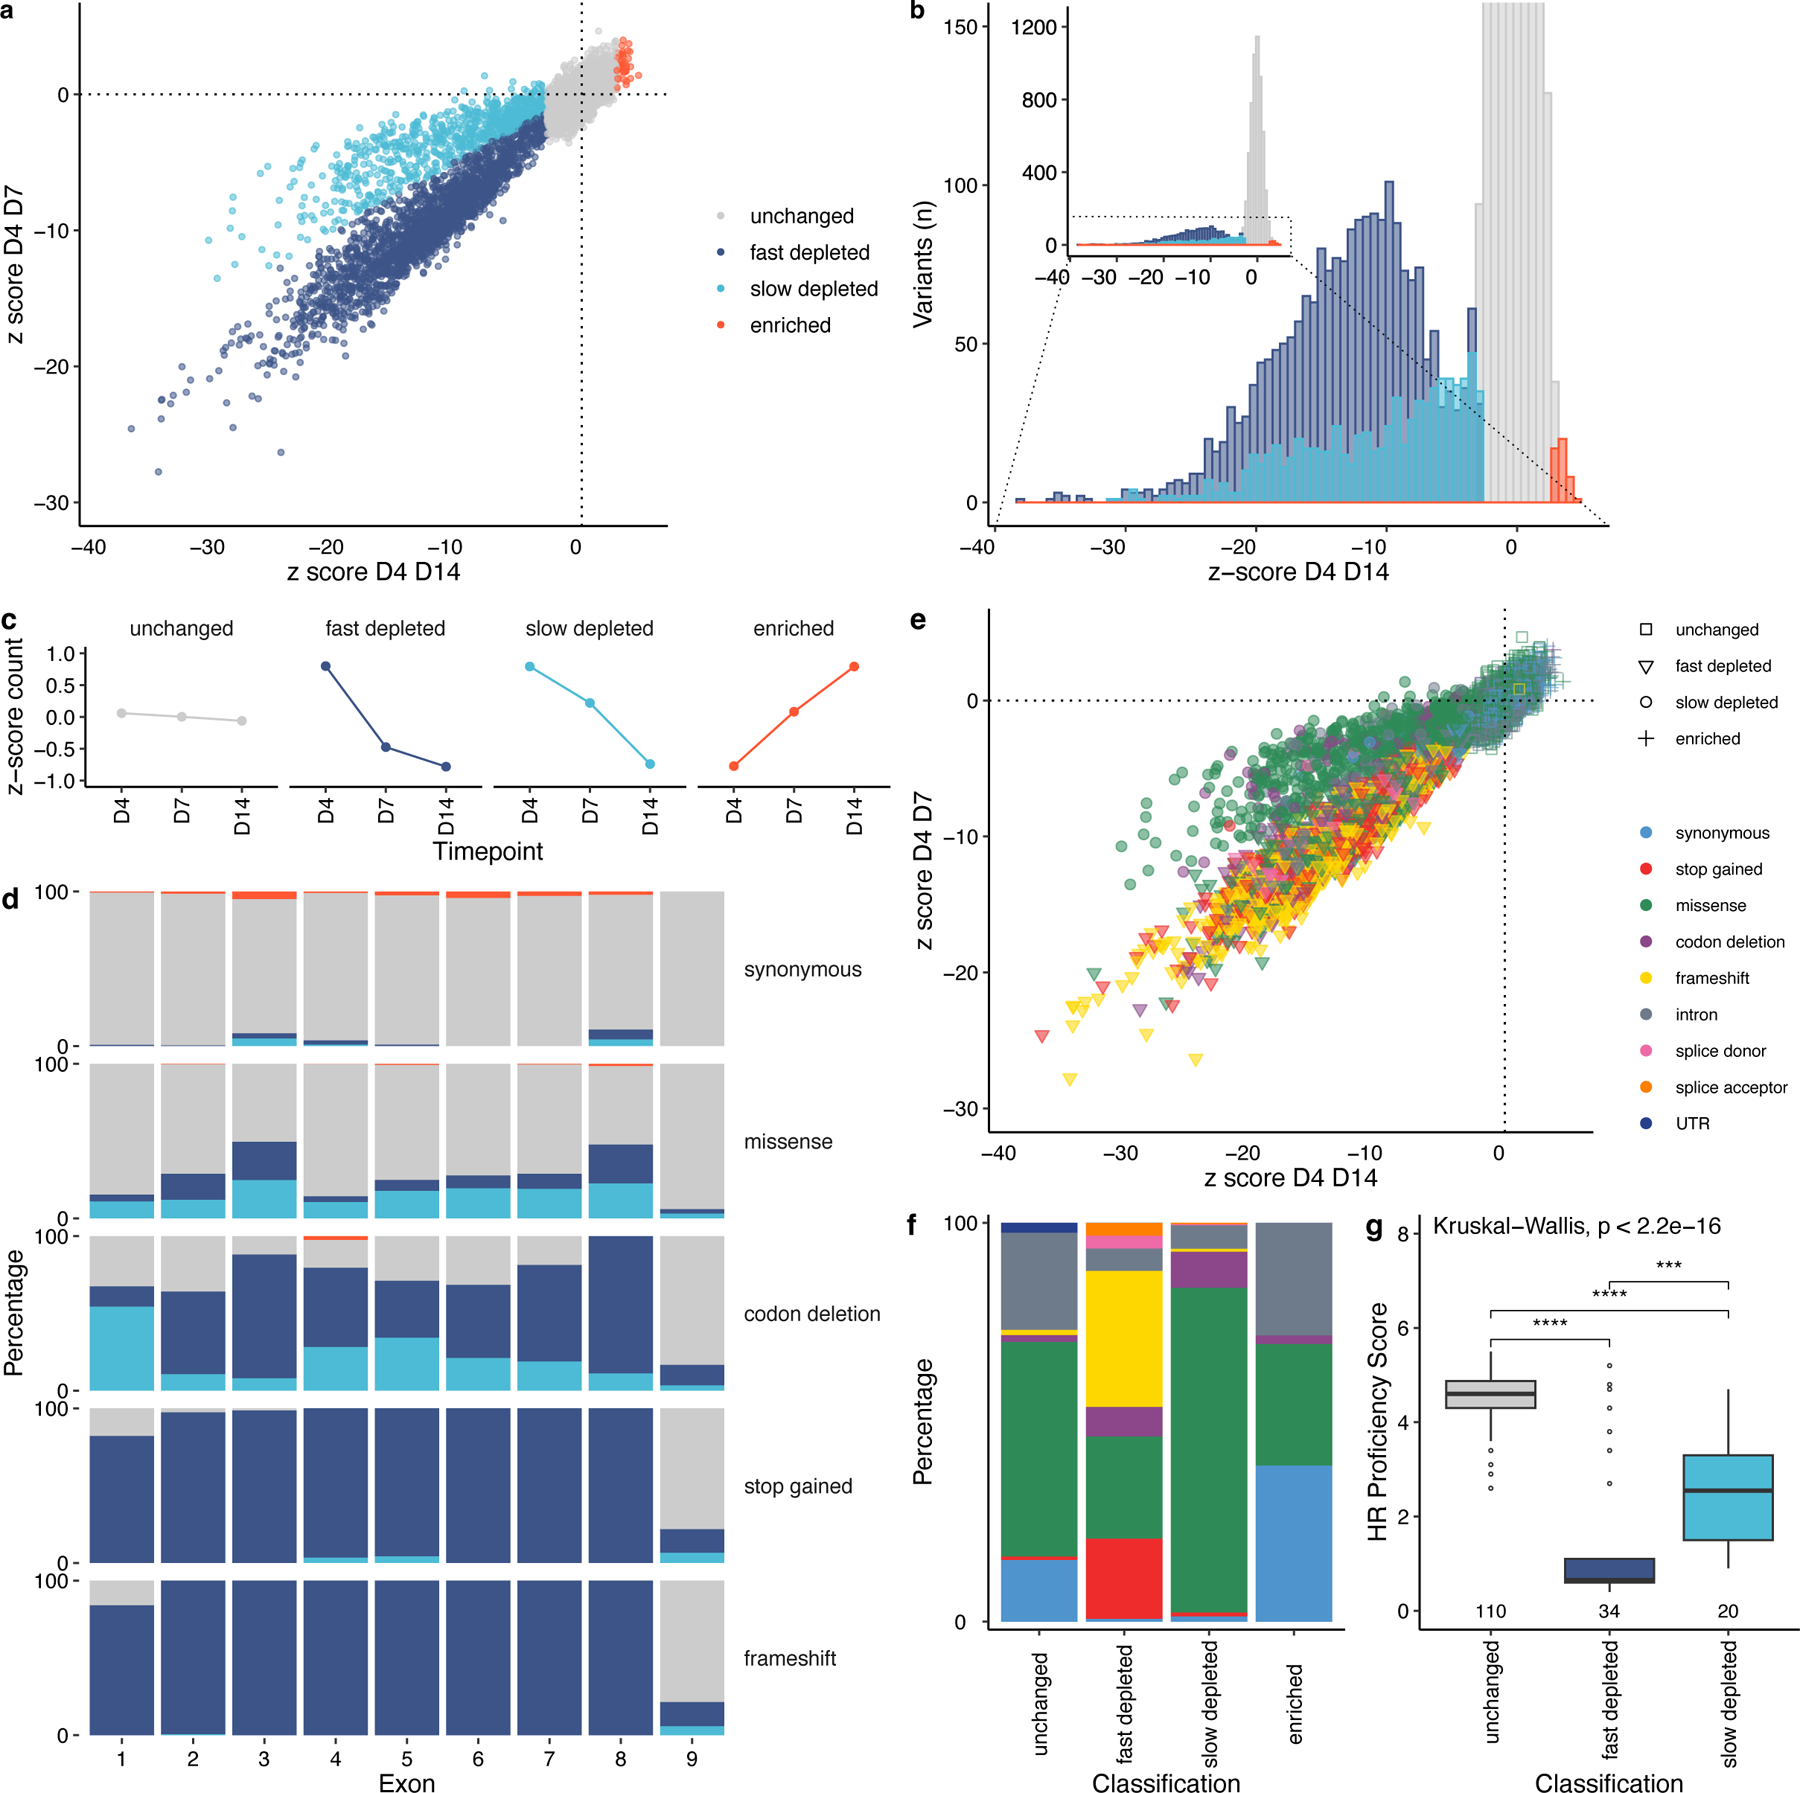
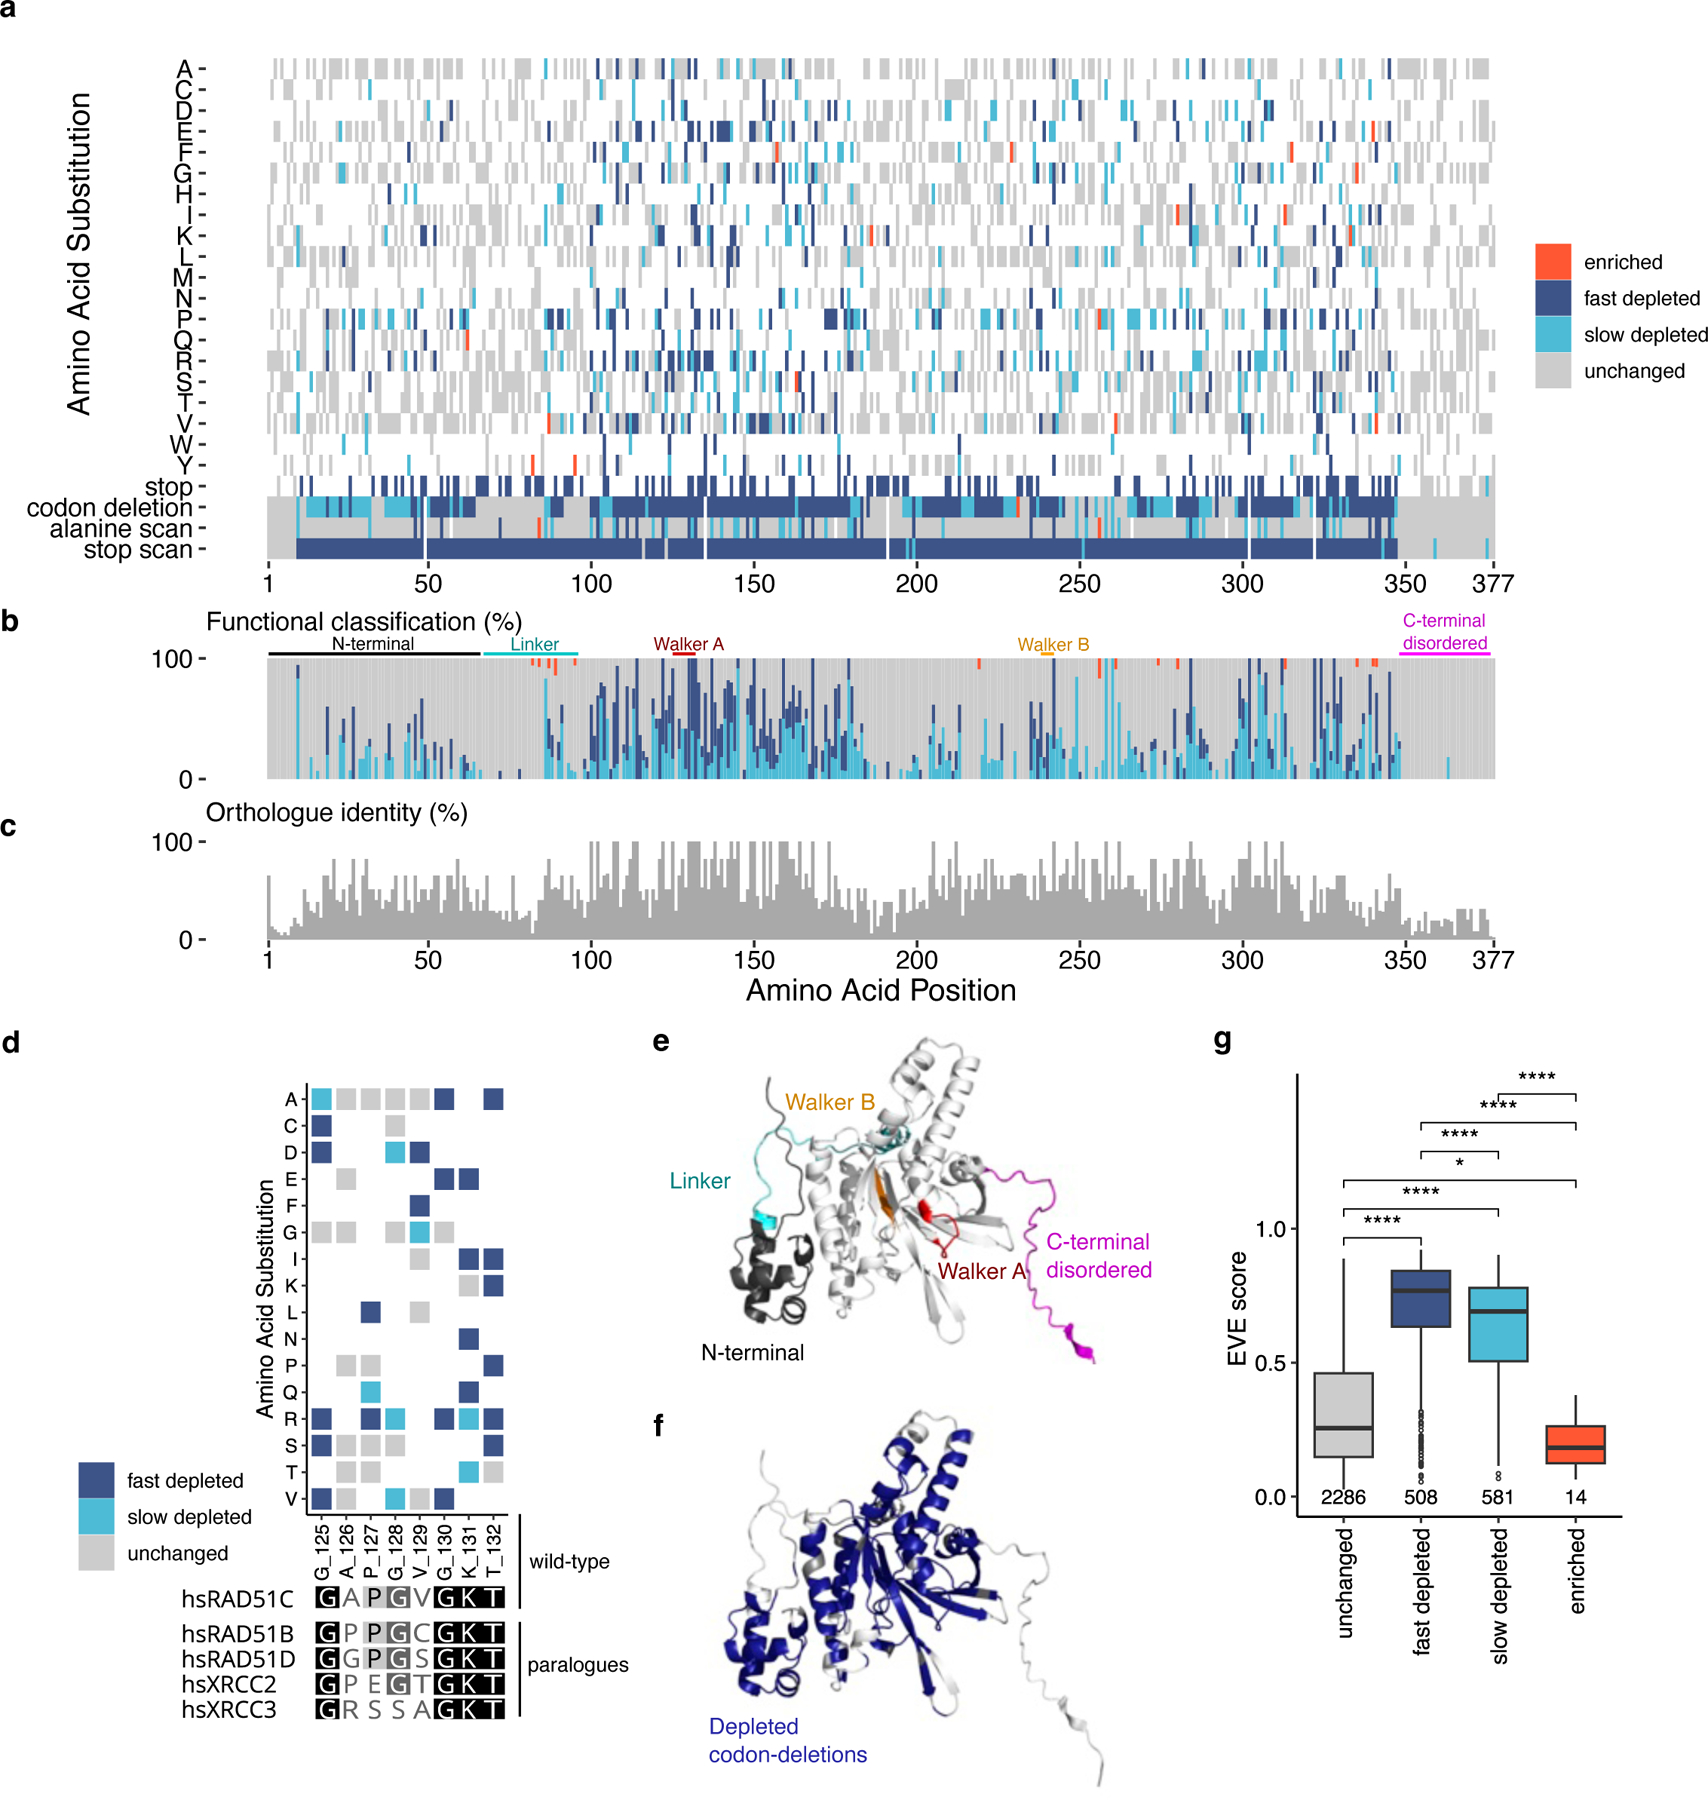
Pathogenic variants in RAD51C confer an elevated risk of breast and ovarian cancer, while individuals homozygous for specific RAD51C alleles may develop Fanconi anemia. Using saturation genome editing (SGE), we functionally assess 9,188 unique variants, including >99.5% of all possible coding sequence single-nucleotide alterations. By computing changes in variant abundance and Gaussian mixture modeling (GMM), we functionally classify 3,094 variants to be disruptive and use clinical truth sets to reveal an accuracy/concordance of variant classification >99.9%. Cell fitness was the primary assay readout allowing us to observe a phenomenon where specific missense variants exhibit distinct depletion kinetics potentially suggesting that they represent hypomorphic alleles. We further explored our exhaustive functional map, revealing critical residues on the RAD51C structure and resolving variants found in cancer-segregating kindred. Furthermore, through interrogation of UK Biobank and a large multi-center ovarian cancer cohort, we find significant associations between SGE-depleted variants and cancer diagnoses.

Keywords: RAD51C; cancer predisposition; homologous recombination; saturation genome editing.


Conflict of interest statement

Declaration of interests The authors declare no competing interests.

Figures

Figure 1:
Figure 1:. RAD51C is amenable to SGE, and variant abundance differs between mutational consequences:
a) RAD51C MANE transcript ENST00000337432.9 was targeted with sgRNA and HDR repair libraries at all 9 exons, in HAP1 cells null for LIG4 with endogenous Cas9 expression, known as the HAP1-A5 cell line. Transfections were performed in triplicate, with cells sampled for edited genomic DNA (gDNA) by sequencing at Days 4, 7 and 14. LFC; log-fold change between the baseline and each timepoint. b) A targeted CRISPR/Cas9 screen was performed in HAP1-A5 cells, with sgRNA depletion observed, indicating RAD51C essentiality in the cell model, consistent with a previous study. c) All ‘synonymous and intron’, and ‘stop gained and frameshift’ variant counts (regularized log transformed counts scaled across all variants in a target region) were scaled separately across timepoints Day (D) 4, 7 and 14. As expected, synonymous and intronic variant abundance change is not significant (ns) overtime (p=0.6), whereas stop gained and frameshift is (****, p<0.0001), as measured by two-sided Mann-Whitney-Wilcoxon Test. Box shows interquartile range, horizontal line the median z-score of variant abundance, whiskers show maximum and minimum values. d) Density plot showing z-scores for variant change between D4 and D14 for all unique variants assayed for shown mutational consequences (n=8,799), coloured by Ensembl variant effect predictor (VEP) mutational consequence. Black tick marks represent single variant values. e) Jitter plot showing z-scores for all variants assayed for selected VEP mutational consequence categories (n=8,799), median z-scores are different between categories as measured by Kruskal-Wallis test (p<0.0001). Data points which have a z-score with an FDR≥0.01 are semi-transparent, the median synonymous z-score differs significantly to all other categories (Dunn’s FDR, **** p<2.2e-16), except UTR variants (not significant, ns, p=0.63). For all Dunn’s non-parametric pairwise multiple comparisons procedure values, see Supplementary Table 1.
Figure 2:
Figure 2:. Analysis of variant kinetics reveals a novel classification of effect:
a) comparison of z-score D4 D7 and z-score D4 D14 values, followed by Gaussian Mixture Modelling, identifies two distinct classes of depletion, slow and fast. Slow-depleted variants are less depleted by D7, but become significantly depleted by D14, fast-depleted variants are depleted by D7. 8,836/9,188 variants (n=352 PPE codons removed) b) Same variants as in ‘a’ distributed across 75 x-axis intervals of z-score D4 D14. Most variants are classed as unchanged, with those that are depleted exhibiting a unimodal negative z-score for fast-depleted and a spectrum of negative z-score D4 D14 for slow-depleted variants. c) The kinetics of change at D7 describes the difference between the two classifications. Unchanged variants do not change in abundance, enriched variants increase between the three timepoints. d) The proportion of functional classifications differs between exons and between mutational consequences, a Chi-Squared test of frequency of fast depleted variants by exon reveals the frequencies are significantly different (χ2 = 507.28, p<2.2e-16). Synonymous variants are mostly unchanged across all exons, stop gained and frameshift variants deplete in all exons, with some variants classed as unchanged in exons 1 and 9, explained through an alternative translation initiation codon at M10 (see Supplementary Fig.4), and escape of NMD, respectively. Missense and codon deletion mutational consequence categories have proportionally more slow-depleted variants, compared with other categories. e) A scatterplot of z-score D4 D7 against z-score D4 D14, coloured by mutational consequence highlights that fast-depleted variants (triangle) are predominantly stop gained (red) and frameshift variants (yellow), whilst slow-depleted variants (circle) are predominantly missense (green). n=8,799. f) Slow-depleted variants are mostly composed of missense variants, the fast-depleted classification has proportionally more stop gained and frameshift variants, with some missense. Unchanged and enriched classifications are composed of missense, synonymous and intronic variants. Colours as in ‘e’. g) A boxplot showing the comparison between an orthogonal HR assay and SGE-based functional classification for missense variants tested in Hu et al., A low HR Proficiency Score indicates defective HR; consistent with this, unchanged variants have a high score, fast depleted a low score, and slow depleted a significantly higher score than fast depleted and a significantly lower score than unchanged variant classifications (***p<0.001, ****p<0.0001, two-sided Mann-Whitney-Wilcoxon Test). Box shows interquartile range, horizontal line the median HR Proficiency Score, whiskers show maximum and minimum values that are not outliers. Outlier points are shown.
Figure 3:
Figure 3:. Functional classification correlates with evolutionary conservation and mutability:
a) Protein-level heatmap of functional classification for 3,756 variants shows distinct areas are more intolerant to variation, it is noteworthy that codon deletions delineate such regions, missense changes produced through SNVs alone (n=2,493) are shown (the few variants with differing classifications between redundant alleles were excluded, n=25). b) Distinct regions with a have a greater number of fast/slow depletion classifications, the Walker A motif which is part of the ATPase catalytic core of the protein is within a region of greater mutational intolerance. Stacked bar chart showing composition of functional classifications at each protein position for missense changes only. c) Regions of intolerance seen in ‘a’ and ‘b’ are observed to align with conserved regions between 10 RAD51C orthologues (see Supplementary Fig.4a for global alignment and orthologues aligned). d) Critical residues of the Walker A motif, ‘G-X1-X2-X3-X4-G-K-T’, conserved between paralogues are completely intolerant to change, some variants in the X2-X3-X4 (any change) range are intolerant in HAP1 cells (for Walker B motif see Supplementary Fig.5a). e) Alpha-fold model of RAD51C, highlighting key domains/regions as in ‘b’. f) Alpha-fold model coloured by depleted (both fast and slow) codon deletions, shows that the linker and the C-terminal disordered region of the protein are tolerant to in-frame codon deletions, whereas the ATPase core and alpha-helix interfacing section of the N-terminal domain are intolerant (Supplementary Fig.4d for distinction between fast and slow depleted codons). g) EVE scores were available for 3,389 missense variants out of a total of 4,558 missense nucleotide variants assayed, 224 variants in PPE codons were excluded. A higher EVE score denotes higher conservation across evolution. Functional classifications have significantly different EVE scores (Kruskal-Wallis p<0.0001). Unchanged variants are less conserved than fast depleted variants. Slow depleted variants are less conserved than fast depleted variants. Interestingly, enriched variants are less conserved than unchanged variants, suggesting that they may be more mutable across evolution. (*p<0.05, ****p<0.0001, two-sided Mann-Whitney-Wilcoxon Test). Box shows interquartile range, horizontal line the median EVE score, whiskers show maximum and minimum values that are not outliers, outliers shown as points.
Figure 4:
Figure 4:. Functional scores are highly accurate and can be used to evaluate clinical classifications:
a) A histogram of functional score, z-score D4 D14, across 75 intervals on the x-axis, coloured by observation status/ClinVar classification. 8,836/9,188 variants assayed are shown (PPE codons removed, n=352), with a magnified section to highlight the relatively smaller contribution of variants observed in ClinVar. ClinVar variants ascribed a Pathogenic/Likely pathogenic classification have a unimodal negative functional score. Benign/Likely benign variants are centred around 0. Uncertain and conflicting ClinVar classifications show a bimodal distribution and spectrum of change, respectively, consistent with ambiguity for variants with these classifications. The z-score D4 D14 threshold calculated in ‘b’ (below which maximum specificity and sensitivity is achieved) is shown by the vertical dashed line. b) A ROC curve calculated using functional scores (z-score D4 D14) in comparison to 92 and 271 variants designated pathogenic or benign, respectively, which for the purposes of this comparison were used as true positive and true negative variants (See Supplementary Table 2). We observe 100% sensitivity, 98.15% specificity, with an Area Under the Curve (AUC) value of 0.9974. The threshold of maximum specificity and sensitivity is achieved at z-score D4 D14 –3.5926 (red point). c) Functional classification proportions for 1,099/1,143 variants observed in ClinVar (PPE variants n=44 removed) with clinical classifications and assayed by SGE. Most variants classified as Pathogenic/Likely pathogenic are depleted and most Benign/Likely benign are classed as unchanged by SGE. Conflicting interpretation and Uncertain significance classifications have similar proportions of unchanged and depleted classifications. d) Variants seen in ClinVar only have proportionally more depleted variants than variants seen in gnomAD only. 8,836/9,188 variants shown (PPE variants removed n=352). e) Associations between variant subsets (masks) and UKBB cancer diagnoses in all cancers combined and in female hormone sensitive cancers. Fast depleted non-synonymous variants (missense and PTVs fast depleted in SGE, grey) are significantly associated with a cancer diagnosis in both phenotypic classes. All fast depleted variants (purple), regardless of mutational consequence are significantly associated with female, hormone sensitive cancers.
Figure 5:
Figure 5:. SGE functional classification resolves cancer kindred:
a) Pedigree showing the segregation of disease over multiple generations in a family of French Huguenot/Scottish and German descent. The proband (arrow, variant in red text), presented with breast cancer at age 62 and was found to have an intronic VUS, c.145+2_145+3insTT. Of note, individuals within this pedigree also carry a pathogenic BRCA2 allele (BRCA2+) that segregates independently. “+” and “-” indicate the results of genotyping of this pathogenic BRCA2 allele. b) c.145+2_145+3insTT significantly depletes between D4 and D14 and is classed as a fast depleted variant. c) Pedigree showing segregation of disease over 2 generations, the proband (arrow, variant in red text), presented with triple negative breast cancer (TNBC) at age 43 and was found to have a missense variant in exon 5 of RAD51C c.835G>C (p.A279P). d) c.835G>C is classified as fast depleted variant by SGE.

References

    1. Dorling L et al. Breast Cancer Risk Genes — Association Analysis in More than 113,000 Women. New England Journal of Medicine 384, 428–439 (2021). - PMC - PubMed
    1. Chang TC, Xu K, Cheng Z & Wu G Somatic and Germline Variant Calling from Next-Generation Sequencing Data. in Advances in Experimental Medicine and Biology vol. 1361 37–54 (Springer, 2022). - PubMed
    1. Iancu I-F et al. Prioritizing variants of uncertain significance for reclassification using a rule-based algorithm in inherited retinal dystrophies. NPJ Genom Med 6, 18 (2021). - PMC - PubMed
    1. Sanoguera-Miralles L et al. Comprehensive Functional Characterization and Clinical Interpretation of 20 Splice-Site Variants of the RAD51C Gene. Cancers (Basel) 12, 3771 (2020). - PMC - PubMed
    1. Gasperini M, Starita L & Shendure J The power of multiplexed functional analysis of genetic variants. Nat Protoc 11, 1782–1787 (2016). - PMC - PubMed