. 2024 Oct 8;57(10):2280-2295.e6.
doi: 10.1016/j.immuni.2024.08.013. Epub 2024 Sep 18.

Intestinal immunity in C. elegans is activated by pathogen effector-triggered aggregation of the guard protein TIR-1 on lysosome-related organelles

Affiliations

Intestinal immunity in C. elegans is activated by pathogen effector-triggered aggregation of the guard protein TIR-1 on lysosome-related organelles

Samantha Y Tse-Kang et al. Immunity. .

Abstract

Toll/interleukin-1/resistance (TIR)-domain proteins with enzymatic activity are essential for immunity in plants, animals, and bacteria. However, it is not known how these proteins function in pathogen sensing in animals. We discovered that the lone enzymatic TIR-domain protein in the nematode C. elegans (TIR-1, homolog of mammalian sterile alpha and TIR motif-containing 1 [SARM1]) was strategically expressed on the membranes of a specific intracellular compartment called lysosome-related organelles. The positioning of TIR-1 on lysosome-related organelles enables intestinal epithelial cells in the nematode C. elegans to survey for pathogen effector-triggered host damage. A virulence effector secreted by the bacterial pathogen Pseudomonas aeruginosa alkalinized and condensed lysosome-related organelles. This pathogen-induced morphological change in lysosome-related organelles triggered TIR-1 multimerization, which engaged its intrinsic NAD+ hydrolase (NADase) activity to activate the p38 innate immune pathway and protect the host against microbial intoxication. Thus, TIR-1 is a guard protein in an effector-triggered immune response, which enables intestinal epithelial cells to survey for pathogen-induced host damage.

Keywords: Caenorhabditis elegans; Pseudomonas aeruginosa; SARM1; TIR-1; effector-triggered immunity; intestinal immunity; lysosome-related organelles; phenazines.


Conflict of interest statement

Declaration of interests The authors declare no competing interests.

Figures

Figure 1.
Figure 1.. TIR-1 is expressed on lysosome-related organelles in C. elegans intestinal epithelial cells.
(A) Representative images of three fixed C. elegans TIR-1::3xFLAG animals at the L4 larval stage immunostained with an anti-FLAG antibody (for TIR-1) and DAPI. Insets in the left panel represent corresponding DIC images. Dotted boxes indicate higher magnifications. Dashed arrows in the middle panel indicate multiple vesicular structures. Dotted circles in the right panel highlight the lumen of vesicular structures. (B) Vector- and tir-1(RNAi)-treated TIR-1::3xFLAG animals were immunostained with an anti-FLAG antibody (for TIR-1) and DAPI. Insets in the left panel represent corresponding DIC images. Dotted boxes indicate higher magnifications. (C) Representative images of three C. elegans TIR-1::3xFLAG animals co-immunostained with antibodies against FLAG (for TIR-1) or PGP-2 (for lysosome-related organelles). Images are three-dimensional reconstructions of Z-stacks. The last column shows TIR-1 (magenta) co-localized with PGP-2+ lysosome-related organelles (green). (D) Quantification of TIR-1 co-localization on PGP-2+ lysosome-related organelles (LRO) in animals stained only with anti-PGP-2 (control, n=5 animals) or co-immunostained with both anti-FLAG and anti-PGP-2 by Aivia (n=10 animals) (Leica). *equals p<0.05 (unpaired t-test). (A-D) are representative of two independent experiments. Co-localization was quantified in (D) for animals that were intact after immunostaining. Scale bars as indicated. Source data for this figure is in Table S2. See also Figure S1.
Figure 2.
Figure 2.. TIR-1 co-localization with lysosome-related organelles can be visualized in live C. elegans.
(A) Images of C. elegans TIR-1::wrmScarlet animals crossed into a PGP-2::GFP translational reporter and treated with either vector control, vhp-1(RNAi), or tir-1(RNAi). Scale bars as indicated. Insets in the left panel represent corresponding DIC images of boxed areas. Dotted boxes indicate higher magnifications. Filled arrowheads indicate TIR-1::wrmScarlet puncta on the membranes of vesicles expressing PGP-2::GFP and dotted arrowheads indicate TIR-1::wrmScarlet puncta that do not co-localize with PGP-2. Asterisks (*) indicate autofluorescence. Quantification of TIR-1 co-localization with (B) lysosome-related organelles (PGP-2, n=10–12 animals per condition) and (C) lysosomes (LMP-1, n=8–11 animals per condition). (B and C) Pearson’s correlation coefficient (r) was calculated in each image using Fiji and the JACoP plug-in. Before analysis, non-specific autofluorescence (blue) was first subtracted from the red channel. Any remaining fluorescence was then assessed for co-localization with the green channel. Error bars represent SEM. *equals p<0.05 (one-way ANOVA with Dunnett’s multiple comparisons test). (B) and (C) are representative of two independent experiments. Source data for this figure are in Table S2. See also Figure S2.
Figure 3.
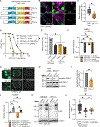
Figure 3.. A hydrophobic domain in the TIR-1 ARM domain is required for its localization on the membranes of lysosome-related organelles and p38 PMK-1 activation.
(A) Schematics of the C. elegans TIR-1 isoforms with a predicted hydrophobic domain as determined by Phobius and DAS. (B) Representative images of C. elegans TIR-1::3xFLAG animals co-immunostained with both anti-FLAG (for TIR-1) and anti-PGP-2 antibodies. Images are three-dimensional reconstructions of Z-stacks. White boxes indicate higher magnifications. The last column shows only TIR-1 (magenta) co-localized with PGP-2+ lysosome-related organelles (green). Representative of two independent experiments. (C) Quantification of TIR-1 co-localization on PGP-2+ lysosome-related organelles in wild-type and TIR-1ΔHD mutants stained with both anti-FLAG and anti-PGP-2 by Aivia (Leica). n=10 animals per condition. *equals p<0.05 (unpaired t-test). Representative of two independent experiments. (D) Representative P. aeruginosa pathogenesis assay of wild-type and TIR-1ΔHD mutants treated with vector control or tir-1(RNAi). The difference between the wild-type and the other genotypes is significant (p<0.05, log-rank test) (n=3). The assay is representative of three independent trials. (E) Mean lifespans and SEM for three independent trials of (D). *equals p<0.05, log-rank test. Mean lifespans, sample number, and statistics for all replicates are in Table S1. (F) qRT-PCR of the p38 PMK-1-dependent gene T24B8.5 in uninfected wild-type and TIR-1ΔHD mutants treated with vector control or tir-1(RNAi) (n=3). *equals p<0.05 (two-way ANOVA with Tukey’s multiple comparisons test). ns=not significant. (G) Representative images of wild-type and TIR-1ΔHD mutants in the T24B8.5p::gfp transcriptional reporter background treated with either vector control or tir-1(RNAi). (H) Representative immunoblot using anti-phospho PMK-1 and anti-total PMK-1 antibodies in wild-type and TIR-1ΔHD mutants treated with vector control or tir-1(RNAi). (I) Densitometric quantification of (H) (n=3). Error bars represent SEM. *equals p<0.05 (unpaired t-test). (J) qRT-PCR of the p38 PMK-1-dependent gene T24B8.5 in P. aeruginosa-infected wild-type and TIR-1ΔHD mutants treated with vector control or tir-1(RNAi) (n=3). *equals p<0.05 (two-way ANOVA with Tukey’s multiple comparisons test). ns=not significant. (K) Immunoblot using the anti-FLAG antibody (for TIR-1) on whole-cell lysates from wild-type and TIR-1ΔHD mutants within the TIR-1::3xFLAG background treated with vector control, tir-1(RNAi), or vhp-1(RNAi). See also Figure S3D for the predicted molecular weights of specific TIR-1 isoforms. (L) Maximum hydrophobicity scores calculated for the homologous TIR-1 HD regions in selected species using ProtScale on ExPASy. Scale bars as indicated. Source data for this figure are in Table S2. See also Figure S3.
Figure 4.
Figure 4.. Infection with P. aeruginosa alkalinizes and condenses lysosome-related organelles in intestinal epithelial cells.
(A) Representative images of C. elegans PGP-2::GFP translational reporters that were stained with LysoTracker Red (LTR, 1 μM) and then transferred to the indicated P. aeruginosa strains for 4–6 hrs. (B) Quantification of LTR intensity of animals in (A). Each data point represents the fluorescence intensity in an individual animal (n=5–8). *equals p<0.05 (one-way ANOVA with Dunnett’s multiple comparisons test). (C) Representative extended depth of field images of wild-type animals stained with LTR (1 μM) that were uninfected or infected with the indicated pathogens for 4–6 hrs. (D) Quantification of LTR intensities of animals in (C). Fluorescence intensities of infected animals were normalized to the respective uninfected E. coli conditions. Each data point represents an individual animal (n=19–20). *equals p<0.05 (two-way ANOVA with Šídák’s multiple comparisons test). ns=not significant. (E) Quantification of PGP-2+ vesicle size using the LasX three-dimensional analysis software (Leica). Each data point represents the average volume of PGP-2(+) vesicles in an individual animal. *equals p<0.05 (one-way ANOVA with Dunnett’s multiple comparisons test). ns=not significant. All experiments are representative of two independent trials. Scale bars as indicated. Source data for this figure are in Table S2. See also Figure S4.
Figure 5.
Figure 5.. The pathogen-derived virulence effector pyocyanin is a bacterial metabolite pattern of pathogenesis that alkalinizes and condenses lysosome-related organelles in intestinal epithelial cells.
(A) Representative images of wild-type LysoTracker Red-stained C. elegans uninfected or infected with the indicated P. aeruginosa mutants for 4 hrs. (B) Representative images of uninfected wild-type LysoTracker Red-stained animals supplemented with PCA (200 μM), PCN (200 μM), 1-HP (20 μM) or PYO (200 μM) for 4 hrs. (C) Representative images of P. aeruginosa Δphz-infected wild-type PGP-2::GFP animals stained with LysoTracker Red in the presence or absence of phenazine supplementation (same concentrations as in B). (D) Images of wild-type animals treated with solvent control or PYO (200 μM) and stained with both LysoTracker Red (LTR, 1 μM) and LysoSensor Green (LSG, 1 μM). (E) Quantification of fluorescence intensity in (D). n=14 animals, two independent trials. *equals p<0.05 (two-way ANOVA with Šídák’s multiple comparisons test). (F-G) Wild-type C. elegans PGP-2::GFP animals treated with solvent or PYO (200 μM) for 4 hrs. (F) Representative images and (G) quantification of PGP-2::GFP vesicle volume. n=19 animals, one trial. *equals p<0.05 (unpaired t-test). (H-I) Wild-type C. elegans treated with solvent or PYO (200 μM) for 4 hrs and immunostained with the anti-PGP-2 antibody. (H) Representative images and (I) quantification of PGP-2+ vesicle volume. n=7–9 animals, one trial. *equals p<0.05 (unpaired t-test). (J) High-performance liquid chromatography-ultraviolet (HPLC-UV) spectroscopy was used to quantify pyocyanin in the indicated P. aeruginosa strains and compared to the pathogenicity of P. aeruginosa against C. elegans in a fast-kill toxicity assay at 4 hpi (n=3). (K) Representative images of wild-type PGP-2::GFP animals pre-treated with solvent control or N-acetylcysteine (NAC, 5 mM) for 2 hrs followed by exposure to either solvent control or PYO (200 μM) for 4 hrs. (L) Quantification of LysoTracker Red fluorescence intensity in (K). Data are normalized to untreated animals. n=10–16 animals, two independent trials. *equals p<0.05 (one-way ANOVA with Tukey’s multiple comparisons test). (M) Representative images of animals stained with LysoTracker Red (1 μM) and treated with solvent, paraquat (1 mM) or tert-Butyl hydroperoxide (tBuOOH, 1 mM) for 4 hrs. Scale bars as indicated. (N) Quantification of LysoTracker Red fluorescence intensity in (M). n=10 animals, two independent trials. *equals p<0.05 (one-way ANOVA with Dunnett’s multiple comparisons test). ns=not significant. Source data for this figure are in Table S2. See also Figure S5.
Figure 6.
Figure 6.. Pyocyanin triggers aggregation of TIR-1 on lysosome-related organelles and activates p38 PMK-1 intestinal immunity.
(A) Representative immunoblot of whole-cell lysates isolated from wild-type and TIR-1ΔHD mutants treated with the indicated phenazines for 4–6 hrs and probed with anti-phospho PMK-1, anti-total PMK-1, and anti-⍺-tubulin antibodies. (B) Densitometric quantification of conditions in (A) (n=2). *equals p<0.05 (two-way ANOVA with Tukey’s multiple comparisons test). (C) Representative immunoblot of whole-cell lysates isolated from wild-type and pgp-2(kx48) mutants treated with or without PYO (200 μM) for 2–4 hrs and probed with anti-phospho PMK-1, anti-total PMK-1, and anti-⍺-tubulin antibodies. (D) Densitometric quantification of conditions in (C) (n=3). *equals p<0.05 (two-way ANOVA with Šídák’s multiple comparisons test). (E) Representative pyocyanin toxicity “fast-kill” assay of wild-type, TIR-1ΔHD, and pgp-2(kx48) mutants. The difference between the wild-type and the other genotypes is significant (*equals p<0.05, log-rank test) (n=3). (F) Mean lifespans with SEM for (E). *equals p<0.05, log-rank test. (G) Representative images of animals treated with solvent control or PYO (200 μM) co-immunostained with anti-FLAG (for TIR-1) and anti-PGP-2. The last column represents the Aivia (Leica) render of TIR-1 and PGP-2 co-localization. (H) Quantification of TIR-1 puncta size on PGP-2+ vesicles in co-immunostained animals in the presence or absence of PYO. Each data point represents the average TIR-1 puncta size co-localized with a single PGP-2+ vesicle. Five vesicles were randomly identified per animal in five animals across two independent trials (n=25). *equals p<0.05 (unpaired t-test). All phenazines were used at 200 μM except for 1-HP (20 μM). Scale bars as indicated. Mean lifespans and statistics for all replicates are in Table S1. Source data for this figure are in Table S2. See also Figure S6.

Update of

References

    1. Jones JD, Vance RE, and Dangl JL (2016). Intracellular innate immune surveillance devices in plants and animals. Science 354. 10.1126/science.aaf6395. - DOI - PubMed
    1. Van de Weyer AL, Monteiro F, Furzer OJ, Nishimura MT, Cevik V, Witek K, Jones JDG, Dangl JL, Weigel D, and Bemm F (2019). A Species-Wide Inventory of NLR Genes and Alleles in Arabidopsis thaliana. Cell 178, 1260–1272.e1214. 10.1016/j.cell.2019.07.038. - DOI - PMC - PubMed
    1. Fitzgerald KA, and Kagan JC (2020). Toll-like Receptors and the Control of Immunity. Cell 180, 1044–1066. 10.1016/j.cell.2020.02.041. - DOI - PMC - PubMed
    1. Wan L, Essuman K, Anderson RG, Sasaki Y, Monteiro F, Chung EH, Osborne Nishimura E, DiAntonio A, Milbrandt J, Dangl JL, and Nishimura MT (2019). TIR domains of plant immune receptors are NAD(+)-cleaving enzymes that promote cell death. Science 365, 799–803. 10.1126/science.aax1771. - DOI - PMC - PubMed
    1. Essuman K, Milbrandt J, Dangl JL, and Nishimura MT (2022). Shared TIR enzymatic functions regulate cell death and immunity across the tree of life. Science 377, eabo0001. 10.1126/science.abo0001. - DOI - PubMed

Publication types

MeSH terms

Substances

LinkOut - more resources