. 2024 Oct 15:201:106674.
doi: 10.1016/j.nbd.2024.106674. Epub 2024 Sep 18.

Prion protein pathology in Ubiquilin 2 models of ALS

Affiliations

Prion protein pathology in Ubiquilin 2 models of ALS

Nhat T Le et al. Neurobiol Dis. .

Abstract

Mutations in UBQLN2 cause ALS and frontotemporal dementia (FTD). The pathological signature in UBQLN2 cases is deposition of highly unusual types of inclusions in the brain and spinal cord that stain positive for UBQLN2. However, what role these inclusions play in pathogenesis remains unclear. Here we show cellular prion protein (PrPC) is found in UBQLN2 inclusions in both mouse and human neuronal induced pluripotent (IPSC) models of UBQLN2 mutations, evidenced by the presence of aggregated forms of PrPC with UBQLN2 inclusions. Turnover studies indicated that the P497H UBQLN2 mutation slows PrPC protein degradation and leads to mislocalization of PrPC in the cytoplasm. Immunoprecipitation studies indicated UBQLN2 and PrPC bind together in a complex. The abnormalities in PrPC caused by UBQLN2 mutations may be relevant in disease pathogenesis.

Keywords: Amyotrophic lateral sclerosis; Human neuronal induced pluripotent models; Mouse models; Prion protein; Ubiquilin 2.


Conflict of interest statement

Declaration of competing interest The authors declare that they have no known competing financial interests or personal relationships that could have appeared to influence the work reported in this paper.

Figures
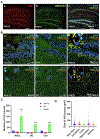
Fig. 1.
Fig. 1.
PrP is found in UBQLN2 inclusions deposited in the brain of P497S UBQLN2 mice. (A) Staining of the hippocampus area of a brain section from an 8-month-old P497S UBQLN2 tg mouse for PrP (a), UBQLN2 (B) and the result of merging of the two images together with DAPI staining (c). Scale bars = 100 μm. (B) Similar triple staining showing different magnifications of the hippocampus (a to c) and cortex (d to f) of the brain from age-matched 8-month-old non-Tg, WT UBQLN2, and P497S tg mice. The stippled boxes indicate the region whose enlargement is shown on the top left-hand side of each panel. Scale bars = 20 μm. (C) Quantification of PrP positive-staining compared among 8-month-old non-Tg, WT, and P497S Tg animals found in the MoCX, DG, and CA1 regions for the number of PrP puncta. (D) Quantification of the size of PrP inclusions in different brain regions, including brain stem, cerebellum, cortex, hippocampus and striatum in P497S animals (n = 2–3). Measurements from 3 to 13 random fields per section sample were averaged for each independent experiment. Statistical comparisons were performed using one-way ANOVA. Data are presented as mean ± SEM, with *** indicating P < 0.001.
Fig. 2.
Fig. 2.
PrP pathology in the spinal cords (Sc) of P497S mutant UBQLN2 mice. (A) Staining showing the ventral horn portion of the Sc from an 8-month-old P497S mouse quadruple stained for PrP, UBQLN2, TDP-43, and DAPI. A MN with TDP-43, UBQLN2, and PrP pathology is marked with a stippled box, and the enlargements of the images are shown in B (top panel). Scale bars = 100 μm. (B) Similar quadruple-stained images showing MN staining for the three mouse genotypes. White arrow heads indicate protein inclusions and there cytoplasmic colocalization of PrP, UBQLN2 and TDP-43. Empty arrow heads indicate extracellular protein inclusions of PrP and UBQLN2. Scale bars = 10 μm. (C) Quantification of the size of PrP positive-inclusions in the SC of 8-month-old non-Tg, WT, and P497S Tg mice (n = 2–3). Pool measurements from 3 to 5 random fields per section sample were averaged for each independent experiment. Statistical comparisons were performed using one-way ANOVA. Data are presented as mean ± SEM, with *** indicating P < 0.0001. (D) Immunoblots of Sc lysates of 5- and 8-month-old Non-tg, UBQLN2 WT and P497S Tg (three independent mice, n = 3) blotted for PrP and actin, which was used as a loading control. (E) Quantification of PrP levels in the blots shown in D. Statistical comparisons were performed using one-way ANOVA. Data are presented as mean ± SEM, with ns. indicating not significant (p ≥ 0.05).
Fig. 3.
Fig. 3.
Alterations in the dendritic spine structure and number in P497S mutant mice. (A) YFP fluorescence of 3 representative dendritic branches from the CA1 and cortex regions seen in the two different mouse genotypes in 24- and 48-week-old animals. (B) Quantification of spine length and density, corresponding to the ages shown above. *P < 0.05, **P < 0.01, ***P < 0.001, ****P < 0.0001.
Fig. 4.
Fig. 4.
Differentiation of IPSC to cortical neurons and MNs. (A) Schematic representation of IPSC differentiation into neuronal progenitors and neurons. Morphological change of cells in the cultures during neuronal induction (a-d). (a) A representative of homogenous transgenic IPSC line selected by puromycin and expressing blue fluorescent protein (BFP). (b) iPSC-derived progenitor cells after neuronal induction at day 4 (D4), (c) neurogenesis stage, neurons at day 14 (D14), (d) neurons at D14 was stained for F-actin (phalloidin, green) visualizes dendritic spine morphology (white arrowheads). IF staining for neuronal markers (e-h) including, vesicular glutamate transporter 1 (Vglut1), neuron specific tubulin (Tuj1), dendritic marker (Map2) and cortical upper-layer neuron marker (Satb2) and MN marker, Choline Acetyltransferase (ChAT). Nuclei in e to h are stained with DAPI. Scale bars = 10 μm. (B) Representative confocal images of dendritic spines in iPSC-derived neuron cultures reveal various shapes, which can be categorized based on phalloidin staining. (C) Representative immunoblots of cortical neuron lysates at 14, 21 and 28 days of differentiation of P497H, P506T mutant and WT cells (parental line, KOLF 2.1) lines blotted for the antibodies shown. (D) Quantification of UBQLN2, TDP-43, and PrP immunoreactive in the blots shown in B (n = 3). Statistical comparisons were performed using one-way ANOVA. Data shown is the mean ± SEM. (For interpretation of the references to colour in this figure legend, the reader is referred to the web version of this article.)
Fig. 5.
Fig. 5.
Formation and properties of PrP inclusions in cultured human IPSC neurons. Representative confocal images of cell staining for UBQLN2, PrP, and DAPI in motor neuron cultures derived from IPSCs at day 60 (A) and day 35 (B) of differentiation, for the WT, P497H and P506T lines. Scale bars = 20 μm. The enlargement of the area outlined with dashes (a, b and c) in the first panel is shown to the right for each of them. White arrow heads indicate protein inclusions and the cytoplasmic colocalization of PrP and UBQLN2. (B) Triple staining of neurons for thioflavin S (green), PrP (red) and DAPI (blue). The area outlined with dashes (a, b and c) is enlarged to easily see the colocalization (arrows). White arrow heads indicate PrP stained positive for ThS. Scale bars = 10 μm. (C) Representative images of the immunofluorescence staining of ubiquitin (green) show decoration of puncta in MN expressing mutant UBQLN2 proteins (white arrowheads). Scale bars = 20 μm. (D) Immunoblots of cortical and MN lysates (two independent clones) from IPSC cultures expressing WT, P497H and P506T UBQLN2 proteins blotted for p-TDP-43,409/410 ubiquitin or actin, which was used as a loading control. Note stronger reaction of bands with the p-TDP-43409/410 and ubiquitin antibodies in the mutant lines. (For interpretation of the references to colour in this figure legend, the reader is referred to the web version of this article.)
Fig. 6.
Fig. 6.
TDP-43 pathology in IPSCs-derived neurons expressing UBQLN2 mutations. (A) Representative images of immunofluorescent staining of TDP-43 (green), phospho TDP-43409/410 (red), and DAPI (blue), and the result of the merged images, in cortical neurons and MN cells from WT or ALS mutant UBQLN2 IPSCs cultures after 35 days of differentiation. White arrowheads point to abnormal puncta in the cytoplasm that were positive for TDP-43, which were mostly in neurons expressing the mutant UBQLN2 proteins. The circumference of the nucleus is marked with a dotted line. (B) Similar to A, but of MN stained after 60 days of differentiation and stained for UBQLN2, TDP-43 and DAPI. Note the large UBQLN2 puncta in the mutant neurons that show weak colocalization with TDP-43 (white arrowheads). Scale bars = 5 μm. (For interpretation of the references to colour in this figure legend, the reader is referred to the web version of this article.)
Fig. 7.
Fig. 7.
Synaptic abnormalities in cultured human IPSC-derived neurons expressing UBQLN2 mutations. (A) Representative images of immunofluorescence staining of N-methyl-d-aspartate (NMDA) receptor 1a subunit in IPSC-derived MN cells expressing WT or ALS mutant UBQLN2 after 35 days of differentiation. An enlargement of the area outlined with dashes (a-c) is shown in the bottom panels. Scale bars = 20 μm. (B) Immunoblots of neuron lysates made from IPSC MN cultures expressing P497H, WT, or P506T UBQLN2 proteins, blotted for the antibodies shown. (C) Quantification of NMDAR1b, NMDAR2b, GluN2a and PSD95 protein levels in the lysates shown in B. Data was collected from 2 to 3 independent experiments. (D) Staining of MN IPSC cultures are 35 days of differentiation with fluorescent phalloidin to visualize dendritic spines. An enlargement of the area outlined with dashes (a-c) is shown in the bottom panels. Scale bars = 30 μm. (E) Quantitation of spine number shows number of dendritic spines per 10 μM. Pooled measurements were collected from 15 to 20 neurons from 3 independent experiments. Data are presented as mean ± SEM. Statistical comparisons were performed using an unpaired t-test. Significance levels are indicated as follows: “ns” for non-significant, *P < 0.05, **P < 0.01, ***P < 0.001, and ****P < 0.0001.
Fig. 8.
Fig. 8.
UBQLN2 interaction and regulation of PrP protein turnover. (A) Immunoblots of total lysates and of the corresponding UBQLN2 immunoprecipitates from HeLa cells that were cotransfected with PrP and different HA-tagged UBQLN2 expression constructs (either WT UBQLN2, P497H, P497S, P506T, P509S or P525S) and probed for the proteins shown. Mock-HA refers to cells transfected with the empty UBQLN2 expression vector. (B) Immunoblot assays of PrP and UBQLN2 in MN from IPSC-differentiated cultures and probed with UBQLN2 and PrP antibodies. (C) Immunoblots of N2a cells cotransfected with PrP and either WT or P497H UBQLN2 expression constructs and treated for different times with cycloheximide (CHX) to analyze protein turnover. (D) Graphs showing the turnover of PrP from 3 separate experiments like shown in C. Statistical comparisons were carried out using one-way ANOVA. (E) Immunofluorescence of HeLa cells cotransfected with PrP and either WT or P497H UBQLN2 expression constructs and stained for the proteins shown. Dotted lines in the PrP panel shows the plasma-membrane outline of the transfected cells. Boxes outlined with dashes (a and b, Merge panels) are enlarged to easily see the differences in PrP internalization (arrows). Scale bars = 20 μm. (F) Quantification of the amount of PrP staining seen in the cytoplasm in HeLe cells transfected with the constructs shown. Pooled measurements of the integrate densities of PrP staining collected from 4 to 5 cytoplasmic regions from 2 to 3 independent experiments. Statistical comparisons were performed using an unpaired t-test. Data shown is the mean ± SEM. *P < 0.05, **P < 0.01, ***P < 0.001.

References

    1. Aitio O, Hellman M, Kazlauskas A, Vingadassalom DF, Leong JM, Saksela K, Permi P, 2010. Recognition of tandem PxxP motifs as a unique Src homology 3-binding mode triggers pathogen-driven actin assembly. Proc. Natl. Acad. Sci. USA 107, 21743–21748. - PMC - PubMed
    1. Black SA, Stys PK, Zamponi GW, Tsutsui S, 2014. Cellular prion protein and NMDA receptor modulation: protecting against excitotoxicity. Front. Cell Dev. Biol 2, 45. - PMC - PubMed
    1. Chang L, Monteiro MJ, 2015. Defective proteasome delivery of Polyubiquitinated proteins by Ubiquilin-2 proteins containing ALS mutations. PLoS One 10, e0130162. - PMC - PubMed
    1. Chen S, Yadav SP, Surewicz WK, 2010. Interaction between human prion protein and amyloid-beta (Abeta) oligomers: role OF N-terminal residues. J. Biol. Chem 285, 26377–26383. - PMC - PubMed
    1. Deng HX, Chen W, Hong ST, Boycott KM, Gorrie GH, Siddique N, Yang Y, Fecto F, Shi Y, Zhai H, et al., 2011. Mutations in UBQLN2 cause dominant X-linked juvenile and adult onset ALS and ALS/dementia. Nature 477, 211–215. - PMC - PubMed

Publication types

MeSH terms