. 2024 Oct 30;44(44):e0364242024.
doi: 10.1523/JNEUROSCI.0364-24.2024.

Differential Encoding of Two-Tone Harmonics in the Male and Female Mouse Auditory Cortex

Affiliations

Differential Encoding of Two-Tone Harmonics in the Male and Female Mouse Auditory Cortex

Amiyangshu De et al. J Neurosci. .

Abstract

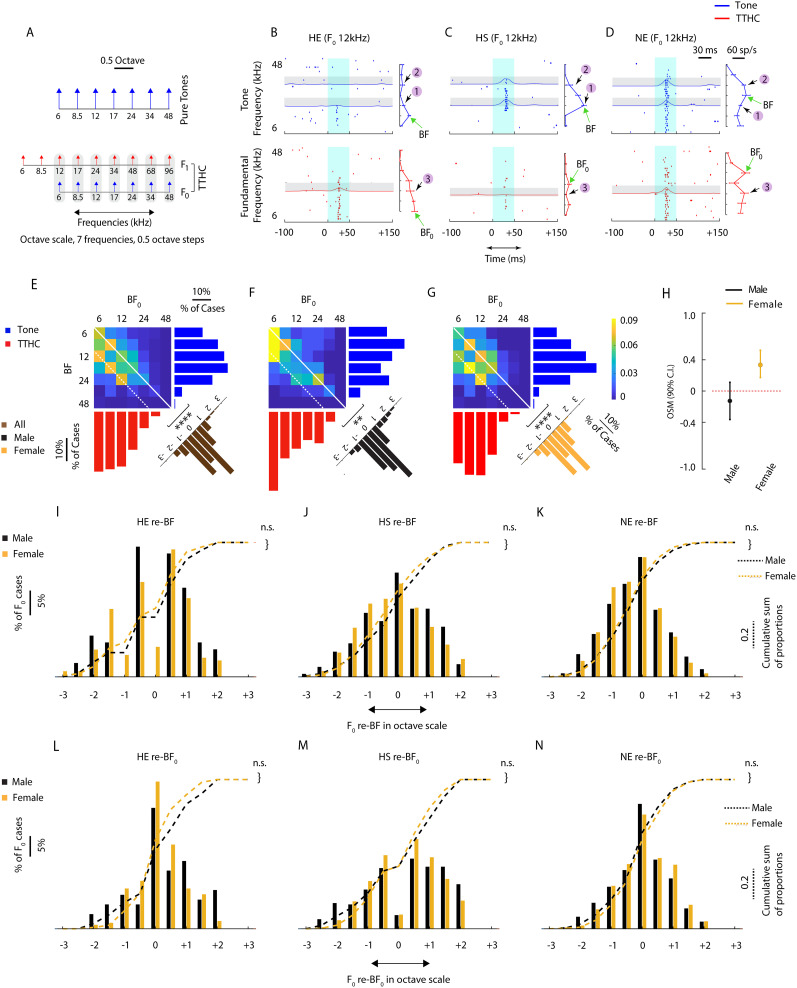
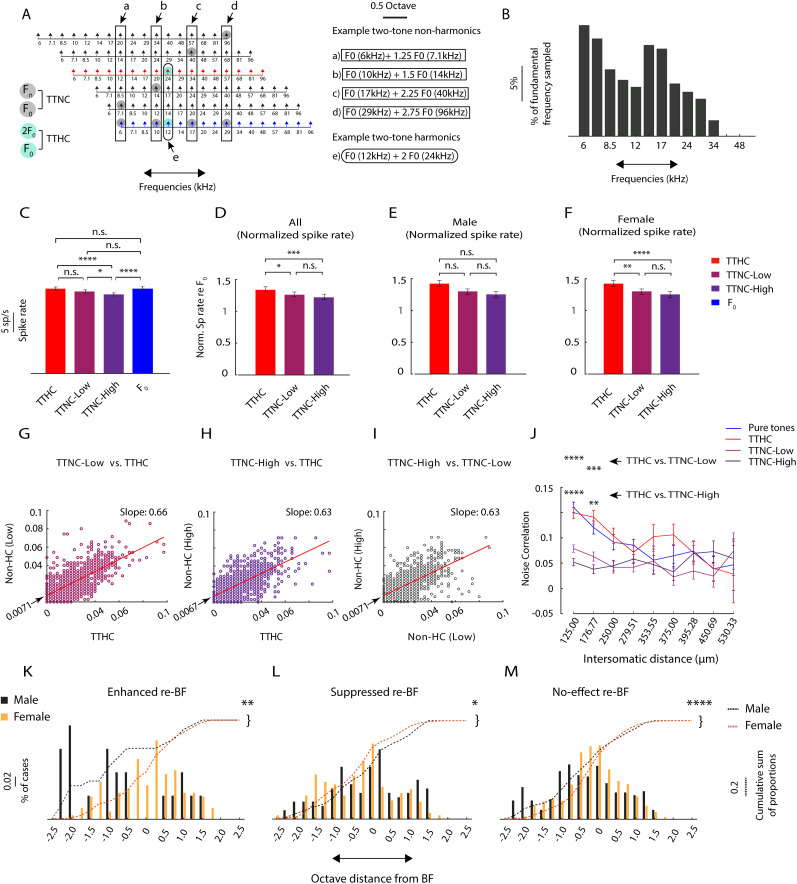
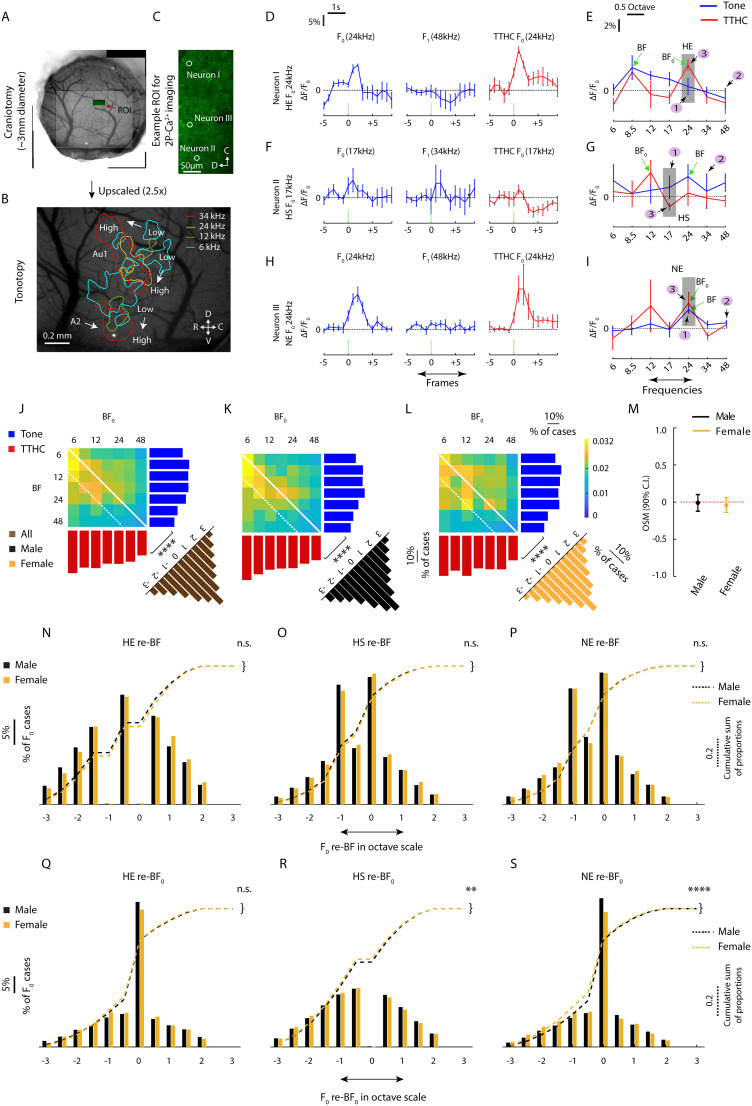
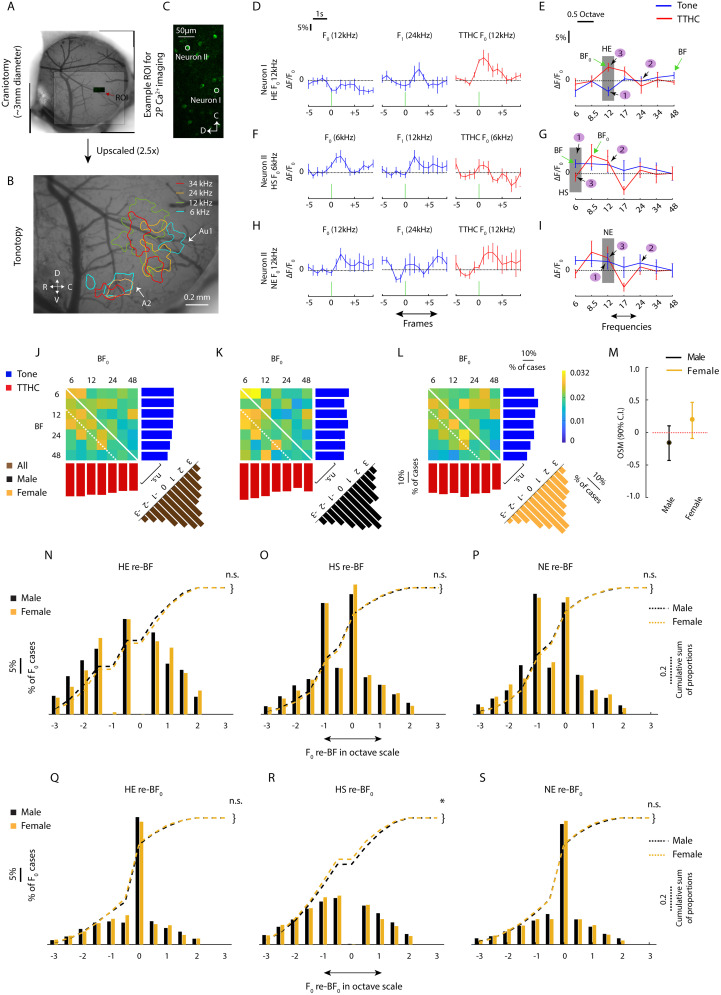
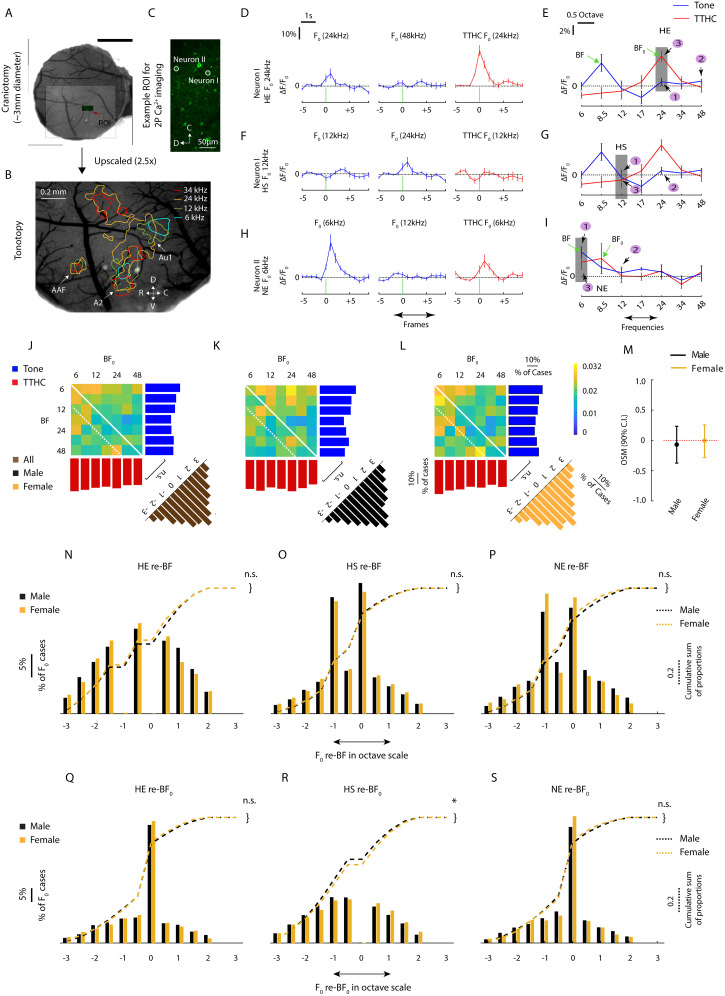
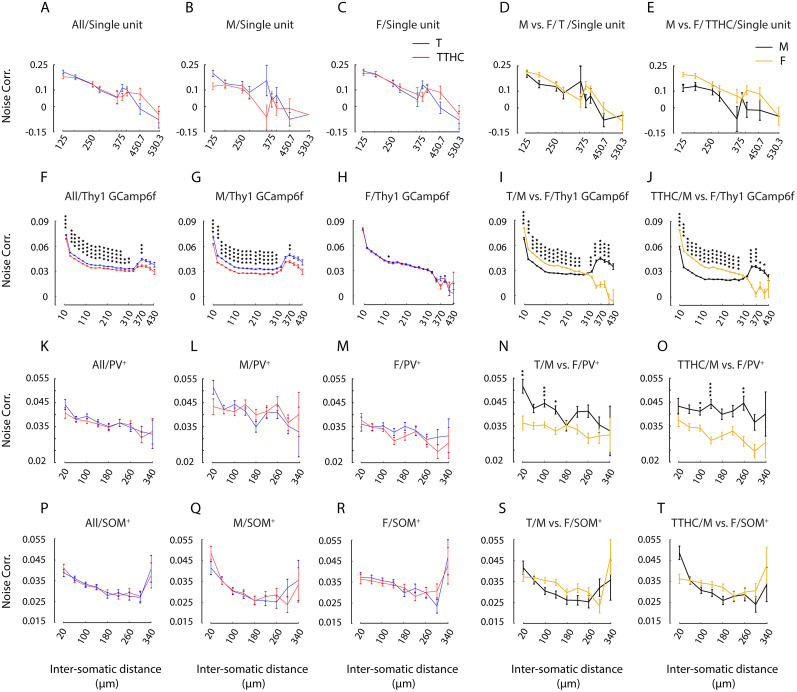
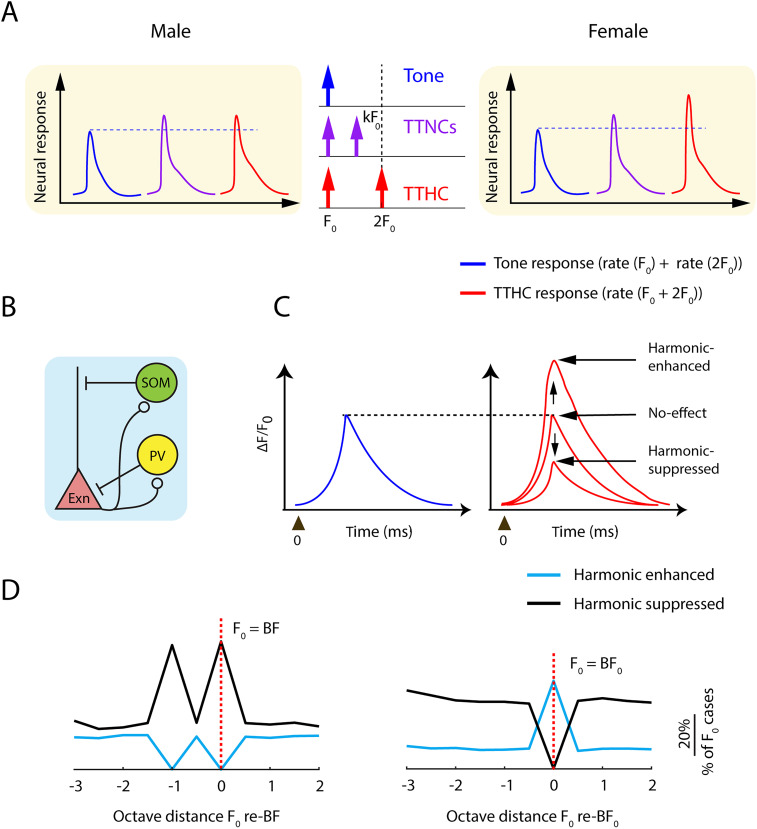
Harmonics are an integral part of music, speech, and vocalizations of animals. Since the rest of the auditory environment is primarily made up of nonharmonic sounds, the auditory system needs to perceptually separate the above two kinds of sounds. In mice, harmonics, generally with two-tone components (two-tone harmonic complexes, TTHCs), form an important component of vocal communication. Communication by pups during isolation from the mother and by adult males during courtship elicits typical behaviors in female mice-dams and adult courting females, respectively. Our study shows that the processing of TTHC is specialized in mice providing neural basis for perceptual differences between tones and TTHCs and also nonharmonic sounds. Investigation of responses in the primary auditory cortex (Au1) from in vivo extracellular recordings and two-photon Ca2+ imaging of excitatory and inhibitory neurons to TTHCs exhibit enhancement, suppression, or no-effect with respect to tones. Irrespective of neuron type, harmonic enhancement is maximized, and suppression is minimized when the fundamental frequencies (F 0) match the neuron's best fundamental frequency (BF0). Sex-specific processing of TTHC is evident from differences in the distributions of neurons' best frequency (BF) and best fundamental frequency (BF0) in single units, differences in harmonic suppressed cases re-BF0, independent of neuron types, and from pairwise noise correlations among excitatory and parvalbumin inhibitory interneurons. Furthermore, TTHCs elicit a higher response compared with two-tone nonharmonics in females, but not in males. Thus, our study shows specialized neural processing of TTHCs over tones and nonharmonics, highlighting local network specialization among different neuronal types.

Keywords: auditory cortex; excitatory neurons; inhibitory neurons; sex specificity; two-tone harmonic complex; vocalization.


Conflict of interest statement

The authors declare no competing financial interests.

Figures

Figure 1.
Figure 1.
Sex-specific distinctions and similarities between BF–BF0 in harmonic response distribution and categories. A, Scheme of stimulus presentation. Top panel, Pure tones (50 ms, in blue arrows, 6–48 kHz, 0.5 octave steps). Bottom panel, Two-tone harmonic complex (TTHC) with fundamental frequencies F0 values (bottom row of TTHC, in blue) and the second harmonic component F1 avlues (top row of TTHC, in red). B–D, Example single-unit responses [peristimulus time histogram (PSTH), and raster] of two-component tones (F0 (12 kHz) and F1 [24 kHz), top panel, in blue, labeled as 1 and 2 with purple bubbles], and TTHCs [represented by their fundamental frequencies (F0s, 12 kHz), in red, and labeled as 3 in a purple bubble] for different TTHC response categories, namely, harmonic-enhanced [HE, r(F0 + 2F0) > (r(F0) + r(2F0)), p < 0.05], harmonic-suppressed [HS, r(F0 + 2F0) < (r(F0) + r(2F0)), p < 0.05], and no-effect [NE, r(F0 + 2F0) = r(F0) + r(2F0), p > 0.05]. From the tuning, the best frequencies (BFs) and the best fundamental frequencies for TTHC (BF0s) were obtained and marked with green arrows. The cyan-shaded rectangle displays a 50 ms stimulus window. E–G, Best frequency (BF, right, blue shaded) and best fundamental frequency (BF0, bottom, red shaded) distributions are independent for (E) male–female combined (n = 23; χ2 = 77.46; df = 6; p = 1.18 × 10−14), (F) males [n = 11; χ2 = 15.98; df = 5 (neither BF, nor BF0 is observed for 48 kHz), p = 0.0068], and (G) females (n = 12; χ2 = 81.28; df = 6; p = 1.88 × 10−15). The center panels represent BF–BF0 relationship matrix across groups: (E) the male–female combined population, (F) males, and (G) females. The solid white diagonal lines across the matrices represent the cases where BF0 = BF, whereas the white dotted lines represent the cases where BF0–BF = −1 octave. The BF–BF0 relationship is reflected from the BF0 re-BF shifts in an octave scale ranging −3 to +3 octaves for the (E) whole population (right bottom corner, brown histogram), (F) males (right bottom corner, black histogram), and (G) females (right bottom corner, yellow histogram). H, The propensity of BF0 being −1 octave from BF is statistically significant in females compared with males, obtained from octave shift measure (OSM, bootstrapped sampling nonoverlapping at 90% C.I.). I–K, Different proportions of TTHC response cases F0 re-BF between −3 to +3 octaves are observed for (I) HE, (J) HS, and (K) NE categories. Histograms shaded in black represent males’ proportions, whereas those shaded in yellow represent females’ proportions. Comparison of cumulative distribution functions (CDFs) for the proportion of F0 re-BF cases between males and females are indifferent for HE (KS test2, p = 0.903), HS (KS test2, p = 0.084), and NE (KS test2, p = 0.851). L–N, Similarly, the proportions of F0 re-BF0 cases vary between harmonic response cases, namely, (L) HE, (M) HS, and (N) NE. Here, too, CDFs of F0 re-BF0 cases between males and females are indifferent for HE (KS test, p = 0.241), HS (KS test, p = 0.270), and NE (KS test, p = 0.381). C.I., confidence interval; *p ≤ 0.05; **p ≤ 0.01; ***p ≤ 0.001; ****p ≤ 0.0001; n.s., not significant. Extracellular in vivo electrophysiology recordings are sampled from Au1, which could be observed from the tonotopic organization and latency of the single units are shown in the Extended Data Figure 1-1. The re-BF and re-BF0 distributions of harmonic response categories across both sex combined are shown in Extended Data Figure 1-2.
Figure 2.
Figure 2.
Two-tone nonharmonics encoding differs from TTHC counterparts, indicating more sex-specific contrast. A, Schematic diagram of TTNC stimulus design. The pure tone tokens (50 ms) ranging from 6 to 68 kHz, 0.25 octave step, are represented in blue (bottom row). The example TTHC, labeled as e (cyan bubbles), with fundamental frequencies (F0), and a second harmonic F1 (one octave apart, in red arrows) which is periodic with the fundamental frequency (F0, in blue). Four example TTNCs are two-tone complexes (marked with gray bubbles and labeled a–d) with F0s and Fn, where Fn is periodic with F0, but at 0.25, 0.5, 1.25, and 1.75 octave distances. B, Proportion of sampled fundamental frequencies (F0 values): 6–48 kHz. C, TTHC, TTNC-low, and TTNC-high and pure tones (as F0 values) mean spike rate responses from sex-combined populations. D–F, F0-normalized mean spike rates for TTHC, TTNC-low, and TTNC-high for the (D) combined population, (E) males, and (F) females indicates significant distinction in normalized spike rate for females between the TTHC and two TTNC classes. G–I, The scatter representation of the F0-normalized means spike rates for (G) TTHC versus TTNC-low, (H) TTHC versus TTNC-high, and (I) TTNC-low versus TTNC-high. The slope of these scatterplots are in a red solid line, whereas the Y-intercepts are marked with black arrows. The scatterplots indicate higher normalized mean spike rate for TTHC compared with the nonharmonic ones. However, TTNC-low showed higher normalized spike rate than TTNC-high. J, A comparison of mean pairwise noise correlation over distance reflects significantly lower noise correlation for TTNC-low (magenta) and TTNC-high (purple) compared with TTHCs (red) and pure tones (F0 values, blue). TTNCs noise correlation is significantly lower than TTHC, observed for neuron pairs at distances of 125 µm (TTHC vs TTNC-low: p = 0, TTHC vs TTNC-high: p = 0) and 177 µm (TTHC vs TTNC-low: p = 0.0005, TTHC vs TTNC-high: p = 0.002), marked with black arrows, obtained from one-way ANOVA, followed by a post hoc Tukey–Kramer multicomparison test. K–M, Proportion of TTNC F0 cases with different F0 re-BF for (K) TTNC-enhanced, (L) TTNC-suppressed, and (M) TTNC-no-effect categories. Histograms shaded in black represent male population, whereas the yellow represents female population. The cumulative distribution functions (CDFs) for the proportion of TTNC F0 cases between males and females populations in all the abovementioned categories show significant differences (KS test2, TTNC-enhanced: males vs females: p = 0.049; TTNC-suppressed: males vs females: p = 0.146; TTNC-no-effect: males vs females: p = 0.0045). The proportion of two-tone nonharmonic response categories re-BF for sex combined is shown in the Extended Data Figure 2-1.
Figure 3.
Figure 3.
Excitatory neurons in Au1 possess harmonic contrast from exhibiting enhancement and suppression only at BF0. A, Representative chronic imaging window, positioned by the anatomical landmarks of ACX. A sample 2-P Ca2+ imaging ROI (green rectangle) marked with a red arrow. B, Wide-field imaging reveals the tonotopic organization (cyan to red indicate low to high frequency scale) of ACX indicating the anatomical positioning of different auditory fields (here, marked as Au1 and A2) from the tone-evoked cortical activation. C, An example 2-P Ca2+ imaging ROI with labeled neurons (Neuron1: HE, Neuron2: HS, and Neuron3: NE) for different harmonic response categories. D, F, H, Average ΔF/F0F/F0 = (F − F0)/F0 [F0 represents baseline fluorescence, obtained from averaging five prestimulus frames (the time duration for scanning an imaging ROI), and five frames average from the stimulus onset as the response frames] for TTHC F0 (red) and component tones (F0 and F1, blue) for HE (D), HS (F), and NE (H) response categories. E, G, I, Tuning curves for TTHC F0 (red, ponies with black arrow, numbered as 3 in a magenta bubble) and the component tones (blue) F0 (numbered as 1 in a magenta bubble) and F1 (number as 2 in a magenta bubble) show the mean ΔF/F0 for different harmonic categories—HE, HS, and NE as reflected in Figure 3D,F,H, respectively. The corresponding BF and BF0 from the three example neurons are marked in the tunings with green arrows and labeled as BF and BF0. The HE, HS, and NE conditions are based on the comparison of neurons’ response to individual F0 values. These HE, HS, and NE at the selected F0 values are shaded in gray rectangular boxes. J–L, Best frequency (BF, right, blue shaded) and best fundamental frequency (BF0, bottom, red shaded) distributions for (J) entire population (n = 8), (K) males (n = 4), and (L) females (n = 4). BF (blue histograms) and BF0 (red histograms) distributions across the whole population (χ2 = 133.007; df = 6; p = 0), males (χ2 = 101.498; df = 6; p = 0), and females (χ2 = 76.1007; df = 6; p = 2.27 × 10−14). The BF0 re-BF histograms (sex-combined in brown, males in black, females in yellow) in an octave scale indicated sex-specific distinction for the excitatory neurons between males and females (Fig. 3K,L, right bottom corner; χ2 = 40.6895; df = 12; p = 5.52 × 10−5). The center panels represent the BF–BF0 relationship matrices for sex combined (Fig. 3J), males (Fig. 3K), and females (Fig. 3L). M, The octave shift measure (as elaborated in Fig. 1H) indicates no significant difference between males and females for the excitatory neuron population. N–P, Proportions of TTHC F0 cases in a re-BF scale for (N) HE, (O) HS, and (P) NE categories. Black shaded histograms represent the male population, whereas yellow shaded histograms indicate the female population. The results from KS test2 indicate that there is no significant difference between males and females among the harmonic response categories [HE (p = 0.8281), HS (p = 0.8281), and NE (p = 1)], obtained from comparison between their cumulative distribution functions (cdfs). Q–S, The TTHC F0 values with different F0 re-BF0 for the categories—(Q) HE, (R) HS, and (S) NE. The results indicate a significant difference between males and females exists for the harmonic response categories, except for HE (KS test2, HE: p = 0.089, HS: p = 0.00175, NE: p = 9.16 × 10−13). R, rostral; C, caudal; D, dorsal; V, ventral. Proportions of Thy1+ excitatory neurons’ responses across harmonic response categories relative to BF and BF0 scales are shown in the Extended Data Figure 3-1.
Figure 4.
Figure 4.
PV+ interneurons respond to major enhancement, and least suppression at F0 = BF0 and vice versa when F0 = BF. A, Chronic imaging window, as described in Figure 3A and a 2-P Ca2+ imaging ROI labeled with red arrow. B, Wide-field imaging displays different auditory fields (Au1 and A2) obtained from the tonotopy. C, Two example neurons from a 2-P Ca2+ imaging ROI represent different harmonic response types (HE: Neuron I, HS and NE: Neuron II). D, F, H, Average ΔF/F0 fluorescence traces for TTHC (red), and component tones (F0 and F1, blue) reflect different harmonic response categories (D) HE (F0 = 12 kHz), (F) HS (F0 = 6 kHz), and NE (F0 = 12 kHz). E, G, I, Tuning curves representing harmonic response categories represented by two example neurons’ responses being enhanced (E), suppressed (G), or unchanged (I). The TTHC F0 values (red) and the component tones F0 and F1 (blue) are labeled with black arrows. The BF and BF of the two example neurons are marked with green arrows. A neuron's response at different F0s could be classified to different TTHC response classes based on comparison to its component tones response. Therefore neuron II provides the examples for both HS and NE categories. The TTHC F0s where the comparison is carried out for harmonic response are marked with gray shaded rectangles. J–L, BF (blue) and BF0 (red) histograms for the (J) entire population (n = 7; χ2 = 1.083; df = 6; p = 0.9822), (K) males (n = 4; χ2 = 10.546; df = 6; p = 0.1034), and females (n = 3; χ2 = 6.4655; df = 6; p = 0.3731) show no significant differences between BF–BF0 for all the three categories. The BF0 re-BF histograms between males (Fig. 3K, black) and females (Fig. 3L, yellow) report sex-specific differences (χ2 = 25.9216; df = 12; p = 0.011) in a BF0 re-BF based distribution of TTHC response cases. The central panels represent the BF-BF0 relationship matrices for sex-combined (Fig. 4J), male (Fig. 4K), and female (Fig. 4L) populations. M, Octave shift measure in PV neuron types indicate that the count BF-BF0 being −1 octave is not significant between males and females. N–P, Proportions of TTHC F0 cases re-BF for different response categories (HE: p = 0.1459, HS: p = 0.4762, NE: p = 0.6763) indicate no significant differences exist between males (black) and females (yellow), obtained from the comparison between cdfs. Q–S, The comparison of the proportions of TTHC F0 cases re-BF0 reflect that sex-specific differences are not significant for HE (Fig. 4Q; p = 0.6299) and NE (Fig. 4R; p = 0.9998), but not for HS (Fig. 4S; p = 0.0109). (Abbreviations: same as previous figures.) Proportions of PV+ inhibitory neurons’ responses across harmonic response categories with respect to BF and BF0 scales are shown in the Extended Data Figure 4-1.
Figure 5.
Figure 5.
The attributes of SOM+ interneurons within Au1 reflect similar harmonic encoding properties like excitatory neurons and PV interneurons. A, An imaging window is fitted on the left auditory cortex for chronic imaging (as described in Fig. 3A) and a representative ROI for 2-P Ca2+ imaging. B, Tonotopy is obtained from wide-field Ca2+ imaging which mark various auditory fields (Au1, A2, and AAF). C, Two example neurons from the ROI of 2-P Ca2+ imaging represent the harmonic response types (HE and HS are represented by Neuron I, NE is represented by Neuron II), carried out by comparing TTHCs and component tones at different F0s and F1s. D, F, H, Average ΔF/F0 fluorescence traces for TTHC (red), and component tones (F0 and F1, blue) reflect neurons response for different harmonic response categories (D) HE (F0 = 24 kHz), (F) HS (F0 = 12 kHz), and NE (F0 = 6 kHz). E, G, I, Tuning curves representing different harmonic response categories represented from two example neurons responses. Neuron I represents both enhancement (Fig. 5E; TTHC F0 24 kHz) and suppression (Fig. 5E; TTHC F0 12 kHz). Neuron II represents the NE category (Fig. 5I; TTHC F0 6 kHz). BF and BF0 of a neuron are marked with green arrows (Fig. 5E,I). The TTHC F0 values where the comparison for harmonic response categories is carried out for the represented examples are marked with gray shaded rectangles. J–L, BF (blue) and BF0 (red) distributions for the (J) entire population (n = 8; χ2 = 7.2576; df = 6; p = 0.2976), (K) males (n = 5; χ2 = 10.4211; df = 6; p = 0.108), and (L) females (n = 3; χ2 = 3.3539; df = 6; p = 0.7633) are not significantly different in the stated populations. The BF0 re-BF histograms for males (Fig. 5K, black) and females (Fig. 5L, yellow) show no sex-specific differences among males and females (χ2 = 8.1483; df = 6; p = 0.7734). The central matrices represent the BF–BF0 relationship for the sex-combined (Fig. 3J), males (Fig. 3K), and females (Fig. 3L) populations. M, Octave shift measure in SOM+ interneurons indicate that the measure for BF–BF0 = −1 octave is not significantly different between males and females. N–P, Proportions of TTHC F0 cases re-BF for different response categories (HE: p = 0.3781, HS: p = 0.9428, NE: p = 0.1768) indicate no significant differences exist between males (black) and females (yellow), obtained from the comparison between cdfs. Q–S, The comparison of the proportions of TTHC F0 cases re-BF0 reflect that sex-specific differences are not significant for all the harmonic response classes (KS test2, HE: p = 0.9972, HS: p = 0.021, NE: p = 0.9205). (Abbreviations: same as previous figures.) The proportions of SOM+ inhibitory neurons’ responses across harmonic response categories, with respect to BF and BF0 scales, are depicted in Extended Data Figure 5-1.
Figure 6.
Figure 6.
Pairwise noise correlation over distance demonstrates harmonic encoding difference in excitatory neurons and existence of sex-specific encoding Thy1+ neurons and PV+ interneurons. A–C, Single-unit pairwise mean noise correlation over distance (x-axis in µm) for (A) the males and females collective population, (B) males, and (C) females (TTHC is in red and component pure tones are in blue). D, E, From single-unit populations, males and females do not show differences in either coding pure tones (Fig. 6D) or TTHC (Fig. 6E). F–H, Thy1+ excitatory neurons noise correlation reflects significant difference in males (Fig. 6G), but not so in females (Fig. 6H), and the males’ difference is reflected in the whole population (Fig. 6F). I, J, Thy1+ neurons also show significant disparity among males and females in encoding either tones (Fig. 6I) or TTHCs (Fig. 6J), observed from their noise correlation over distance values. K–M, PV+ interneurons do not show difference in noise correlation in encoding tone and TTHC, and this is indifferent for the sex-combined (Fig. 6K), males (Fig. 6L), and females (Fig. 6M) population. N, O, However, sex-specific differences are observed in noise correlation at some intersomatic distances for pure tones (Fig. 6N) and TTHCs (Fig. 6O). P–R, SOM+ interneurons, too, indicate no significant difference in noise correlation between tones and TTHCs, irrespective of sex-combined (Fig. 6), males (Fig. 6Q), and females (Fig. 6R) population. Sex-specific differences of noise correlation are not visible between males and females for pure tone (Fig. 6S) and TTHC response (Fig. 6T). All the comparisons are carried out using one-way ANOVA followed by post hoc Tukey–Kramer multicomparison test.
Figure 7.
Figure 7.
A schematic of the underlying mechanism of TTHC encoding in mice primary auditory cortex (Au1). A, The stimuli played consisted of pure tones (F0), TTNC (F0 + kF0, where k = 1.25, 1.5, 2.25, and 2.75; k = 1.5 is represented), and TTHC (F0 + 2F0) shown with upward arrows in blue, purple, and red, respectively (middle). Sex-specific differences are observed between males (left) and females (right) in the Au1 through differences in spike rate for TTNC and TTHC. Females (right) exhibit a higher normalized spike rate [with respect to the spike rate from tone response (blue, F0)] for TTHCs (red) compared with TTNCs (purple), whereas males (left) show no such differences between TTHCs and their TTNC counterparts. The above conclusion is derived from Figure 2. B, A circuit motif of excitatory Thy1+ and inhibitory neurons, PV+ and SOM+ is shown (Exn, excitatory neuron). C, TTHC response [rate (F0 + 2F0), in red] categories (right) show either enhancement (indicated by upward arrow), suppression (pointed by downward arrow), or remain indifferent relative to the linear summed response of its component tones [rate (F0) + rate (2F0)], in blue (left). D, A schematic is shown for the percentage of TTHC response cases with harmonic enhancement (cyan) and suppression (black) re-BF (left) and re-BF0 (right). Independent of cell types and sex, harmonic-suppressed cases outnumber harmonic-enhanced cases when F0 is at BF (denoted by a red dashed line), or one octave below BF. However, harmonic-enhanced cases dominate harmonic-suppressed ones only when F0 is at BF0 (also marked by a red dashed line, right). Since the no-effect response cases did not exhibit differential selectivity between harmonic and the linear sum of their component tones, unlike the harmonic-enhanced and harmonic-suppressed cases, are thereby excluded to simplify the schematic.

Similar articles

References

    1. Abhirami S, Agarwalla S, Bhattacharya A, Bandyopadhyay S (2023) Contribution of the ventral pouch in the production of mouse ultrasonic vocalizations. Phys Rev E 107:024412. 10.1103/PhysRevE.107.024412 - DOI - PubMed
    1. Agarwalla S, De A, Bandyopadhyay S (2023) Predictive mouse ultrasonic vocalization sequences: uncovering behavioral significance auditory cortex neuronal preferences, and social-experience-driven plasticity. J Neurosci 43:6141–6163. 10.1523/JNEUROSCI.2353-22.2023 - DOI - PMC - PubMed
    1. Agarwalla S, Noelle SA, Long EN, O'Brien WT, Abel T, Bandyopadhyay S (2020) Male-specific alterations in structure of isolation call sequences of mouse pups with 16p11.2 deletion. Genes Brain Behav 19:e12681. 10.1111/gbb.12681 - DOI - PMC - PubMed
    1. Amador A, Margoliash D (2013) A mechanism for frequency modulation in songbirds shared with humans. J Neurosci 33:11136–11144. 10.1523/JNEUROSCI.5906-12.2013 - DOI - PMC - PubMed
    1. Angeloni C, Geffen MN (2018) Contextual modulation of sound processing in the auditory cortex. Curr Opin Neurobiol 49:8–15. 10.1016/j.conb.2017.10.012 - DOI - PMC - PubMed

LinkOut - more resources