. 2024 Sep 19;15(1):8241.
doi: 10.1038/s41467-024-52475-3.

Electron transfer in the respiratory chain at low salinity

Affiliations

Electron transfer in the respiratory chain at low salinity

Ana Paula Lobez et al. Nat Commun. .

Abstract

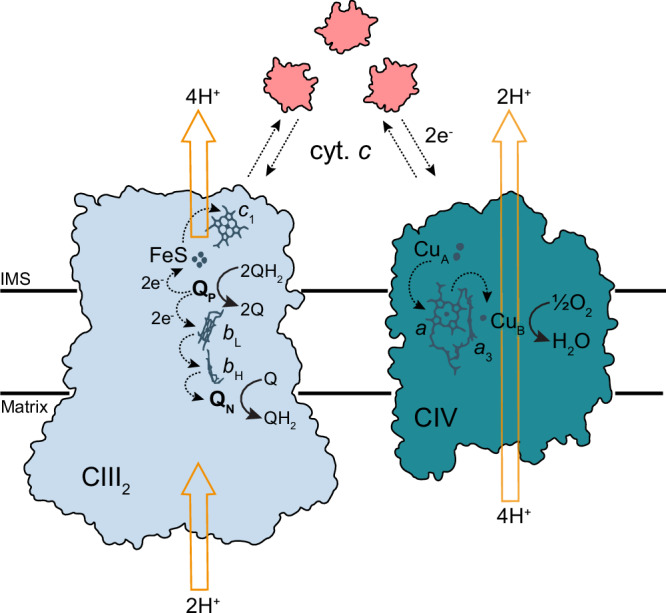
Recent studies have established that cellular electrostatic interactions are more influential than assumed previously. Here, we use cryo-EM and perform steady-state kinetic studies to investigate electrostatic interactions between cytochrome (cyt.) c and the complex (C) III2-IV supercomplex from Saccharomyces cerevisiae at low salinity. The kinetic studies show a sharp transition with a Hill coefficient ≥2, which together with the cryo-EM data at 2.4 Å resolution indicate multiple cyt. c molecules bound along the supercomplex surface. Negatively charged loops of CIII2 subunits Qcr6 and Qcr9 become structured to interact with cyt. c. In addition, the higher resolution allows us to identify water molecules in proton pathways of CIV and, to the best of our knowledge, previously unresolved cardiolipin molecules. In conclusion, the lowered electrostatic screening renders engagement of multiple cyt. c molecules that are directed by electrostatically structured CIII2 loops to conduct electron transfer between CIII2 and CIV.


Conflict of interest statement

The authors declare no competing interests.

Figures

Fig. 1
Fig. 1. Schematic view of electron and proton transfer by CIII2 and CIV.
Electron transfer between CIII2 and CIV is mediated via soluble cyt. c. Reactions catalyzed by one-half of the CIII2 homodimer and CIV are detailed. Quinol and quinone-binding sites are indicated as QP and QN, respectively. Dashed black arrows indicate electron transfer, while yellow arrows indicate proton-transfer reactions. IMS is intermembrane space.
Fig. 2
Fig. 2. Activity as a function of cyt. c concentration.
a QH2:O2 oxidoreductase activity of the S. cerevisiae CIII2CIV2 supercomplex at different cyt. c concentrations at 20 mM KCl buffer (λD = 2.2 nm). Data from measurements at 150 mM KCl (λD = 0.8 nm, blue) are included for comparison. The data are normalized at the maximum activity at 50 μM cyt. c, which was ~50 electrons/s. Data are the average of three technical replicates measured with each of three different supercomplex preparations. Error bars are standard errors. b Hill equation fit (solid black line) of the 20 mM KCl activity data in the range 0.03 – 1 μM cyt. c. The Hill coefficient was n = 5 ± 3 (KA = 180 nM), indicating the involvement of two or more cyt. c molecules in electron transfer between each CIII in CIII2 and CIV. For comparison, the data at 150 mM KCl were fitted with a Hill equation with n = 1 (solid blue line, KA = 1.7 μM).
Fig. 3
Fig. 3. Concentration and fraction reduced cyt. c.
The concentration and fraction (inset) reduced cyt. c as a function of cyt. c concentration for 20 mM (black) and 150 mM (blue) monovalent salt concentrations were measured during the turnover of the supercomplex. Data are average of two technical replicates (one preparation was used because the experiment is focused on the effects of changes in ionic strength). Error bars are calculated as standard deviation.
Fig. 4
Fig. 4. Cryo-EM analysis.
a Cryo-EM map of the CIII2CIV1 supercomplex with the approximate position of the membrane indicated by black lines. IMS is intermembrane space. b Coulomb electrostatic surface representation of a supercomplex with the cyt. c-binding positions indicated by a dashed line. c CIII2CIV1 supercomplex with the cyt. c density is shown in red. ce Principal component analysis (PCA) or 3D classification revealed two possible cyt. c positions at each CIII in CIII2 ((i), (ii), dark and light red, respectively, in panels d, e) and CIV ((iv), (v), yellow and orange, respectively, in panels d, e). Panel (c), (iii) represents a class identified in between each CIII (in CIII2) and CIV at 150 mM KCl). Panels (f) and (g) are expanded views of the two dashed squares in panel (d) showing the positions of subunits Qcr6 with cyt. c at CIII2 and Qcr9 with cyt. c at CIV, respectively.

Similar articles

Cited by

References

    1. Record, T. M. Jr, Courtenay, E. S., Cayley, S. & Guttman, H. J. Biophysical compensation mechanisms buffering E. coli protein-nucleic acid interactions against changing environments. Trends Biochem. Sci.23, 190–194 (1998). - PubMed
    1. Wennerström, H., Estrada, E. V., Danielsson, J. & Oliveberg, M. Colloidal stability of the living cell. Proc. Natl. Acad. Sci. USA117, 10113–10121 (2020). - PMC - PubMed
    1. Gupte, S. S. & Hackenbrock, C. R. Multidimensional diffusion modes and collision frequencies of cytochrome c with its redox partners. J. Biol. Chem.263, 5241–5247 (1988). - PubMed
    1. Leeb, S. et al. Diffusive protein interactions in human versus bacterial cells. Curr. Res. Struct. Biol.2, 68–78 (2020). - PMC - PubMed
    1. Leeb, S., Yang, F., Oliveberg, M. & Danielsson, J. Connecting longitudinal and transverse relaxation rates in live-cell NMR. J. Phys. Chem. B124, 10698–10707 (2020). - PMC - PubMed

Publication types

MeSH terms

Associated data