. 2024 Sep 19;15(9):687.
doi: 10.1038/s41419-024-07060-3.

GPX4 restricts ferroptosis of NKp46+ILC3s to control intestinal inflammation

Affiliations

GPX4 restricts ferroptosis of NKp46+ILC3s to control intestinal inflammation

Xinyao Li et al. Cell Death Dis. .

Abstract

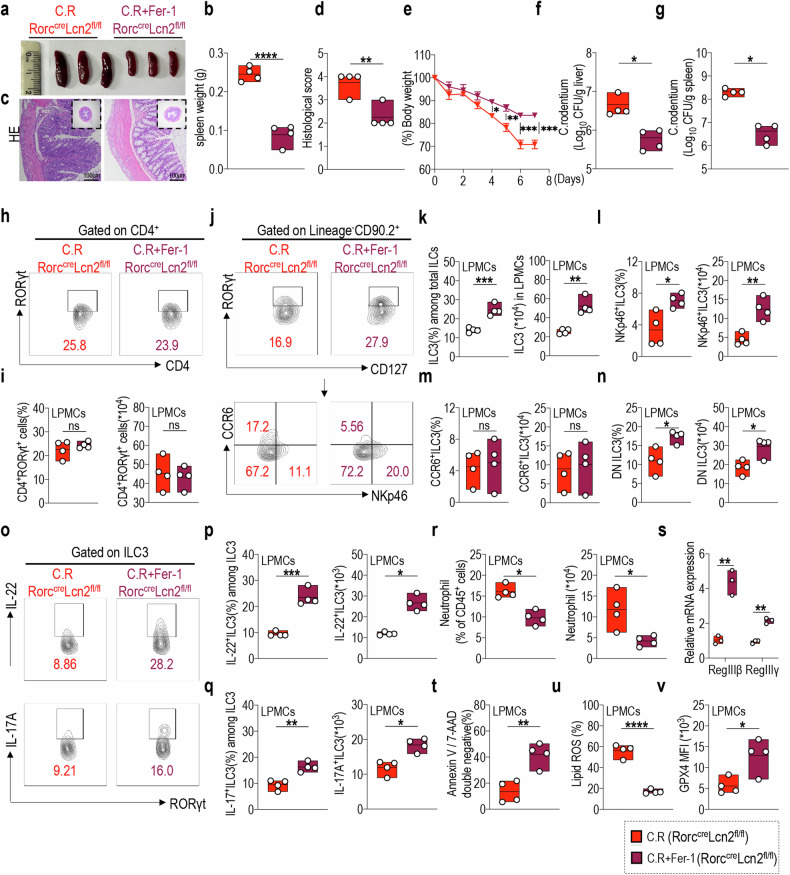
Group 3 innate lymphoid cells (ILC3s) are essential for both pathogen defense and tissue homeostasis in the intestine. Dysfunction of ILC3s could lead to increased susceptibility to intestinal inflammation. However, the precise mechanisms governing the maintenance of intestinal ILC3s are yet to be fully elucidated. Here, we demonstrated that ferroptosis is vital for regulating the survival of intestinal ILC3. Ferroptosis-related genes, including GPX4, a key regulator of ferroptosis, were found to be upregulated in intestinal mucosal ILC3s from ulcerative colitis patients. Deletion of GPX4 resulted in a decrease in NKp46+ILC3 cell numbers, impaired production of IL-22 and IL-17A, and exacerbated intestinal inflammation in a T cell-independent manner. Our mechanistic studies revealed that GPX4-mediated ferroptosis in NKp46+ILC3 cells was regulated by the LCN2-p38-ATF4-xCT signaling pathway. Mice lacking LCN2 in ILC3s or administration of a p38 pathway inhibitor exhibited similar phenotypes of ILC3 and colitis to those observed in GPX4 conditional knock-out mice. These observations provide novel insights into therapeutic strategies for intestinal inflammation by modulating ILC3 ferroptosis.


Conflict of interest statement

The authors declare no competing interests.

Figures

Fig. 1
Fig. 1. Altered ferroptosis-regulated molecule expression patterns accompany ILC3 activation.
a The representative flow cytometry plots and b statistical results of ILC3 proportion in total ILCs (left) and in CD45+ cells (right) in intestinal mucosal tissues of UC patients compared with those in HCs. (n = 6) c SAT1, HSPB1, ATF4 and Gpx4 mRNA expression in the sorted ILC3s from intestinal mucosal tissue of HCs or patients with UC. Relative gene expression was normalized to β-actin. (n = 3) d, e Comparison of GPX4 expression in ILC3s from indicated intestinal mucosal tissue. (n = 6) f Sorted ILC3s from the LPMCs were cultured with the indicated inhibitors for 24 h: zVAD (10 μM), necrostatin-1 (Nec-1, 1 μM) and ferrostatin-1 (Fer-1, 1 μM). Cell viability was measured using the alamarBlue cell viability assay. (n = 3) g, h Sorted ILC3s from LPMCs were treated with RSL3 (2–8 μM) or vehicle (DMSO) for 16 h. g The percentage of 7-AAD and annexin V double-negative cells was used to gauge cell viability, as described previously [74, 75]. h Lipid ROS production was assayed by flow cytometry using C11-BODIPY. The statistical analysis is shown. (n = 3) WT mice were administered with or without (PBS) 1 × 108 CFU of C. rodentium (C.R) via oral gavage. After 8 days, mice were euthanized, and their intestinal tissue was collected. Sorted intestinal LPMC-derived ILC3s from the indicated mice were treated with RSL3 (8 μM) for 16 h. Statistical results of i the percentage of 7-AAD and annexin V double-negative population, and j lipid ROS production, are shown. (n = 3) k Atf4, xCT, and Gpx4 mRNA expression in the sorted intestinal ILC3s from the indicated mice was assayed using qRT-PCR. The relative gene expression was normalized to β-actin. (n = 3) l The statistical results of MFI for ATF4, xCT, and GPX4 in ILC3s from the indicated mice are presented. (n = 3) m MNK3 cells were stimulated with IL-7, IL1β, and IL-23 (10 ng/mL) in vitro for 24 h. The viable MNK3 cells were gated on live cells and further analyzed for CD4, CD127, and RORγt expression using flow cytometry. n The statistical results depicting the proportions of CD127+RORγt+, CD4-RORγt+, and CD4+RORγt+ cell populations are shown. (n = 4) o In the presence of IL-7, IL1β, and IL-23 (10 ng/mL) for MNK3 cell stimulation, the specified inhibitors or inducer were applied to treat MNK3 cells: zVAD (10 μM), Nec-1 (Nec-1, 1 μM), ferrostatin-1 (Fer-1, 1 μM) or RSL3. After 16 h of cultivation, cells were harvested for analysis. p Cell viability was measured using the alamarBlue cell viability assay. (n = 3) Flow cytometry results of q the percentage of 7-AAD and annexin V double-negative cells, and r lipid ROS production, are shown. (n = 3) The statistical results of the MFI for s IL-22, t IL-17A, u RORγt, and v GPX4 in activated MNK3 cells treated with RSL3 or Fer-1 are presented. (n = 3) Data are presented as the mean ± SEM or median, and statistical significance was determined by two-sided unpaired t-test (b, c, ej, l, n, pv) or non-parametric Mann–Whitney U test (K). *P < 0.05; **P < 0.01; ***P < 0.001.
Fig. 2
Fig. 2. NKp46+ILC3 orchestrates pathological phenotypic alterations in mouse colitis induced by in vivo ferroptosis interventions, independent of T cell involvement.
a Body weight changes of indicated groups of mice. (n = 3) b Statistical results of spleen weights at day 8 post infection. (n = 4) c The statistical results of histological scores are shown. (n = 4) d Colon lengths of indicated mice. (n = 4) Log10 CFU of C.R in e liver and f spleen tissues. (n = 4) g The gating strategy for intestinal CD4+RORγt+ cells and ILC3s. h Statistical results of the proportion (upper) and absolute number (lower) of CD4+RORγt+ cells in LPMCs from the indicated groups of mice. (n = 4) i The representative flow cytometry plots and statistical results of the proportion and absolute number of j ILC3s, including k NKP46+ILC3, l DN cell subsets, and m CCR6+ILC3 in LPMCs of indicated mice. (n = 4) n Representative FACS plots of IL-22- (upper) and IL-17A-positive (lower) ILC3s in LPMCs from the indicated groups of mice. Statistical results of proportion (left) and absolute numbers (right) of o IL-22-, and p IL-17A-expressing ILC3s are shown. (n = 4) q Statistical results of the proportion (left) and numbers (right) of neutrophils in LPMCs from the indicated groups of mice. (n = 4) r Relative RegIIIβ and RegIIIγ mRNA expression in the colon tissue of indicated mice. (n = 3) s The percentage of annexin V and 7-AAD double-negative population in LPMCs-derived ILC3s from the indicated groups of mice. (n = 4) t Statistical results of lipid ROS production in ILC3s are shown. (n = 4) u The statistical results of MFI for GPX4 in ILC3s from LPMCs of indicated mice. (n = 4) Data are presented as the mean ± SEM or median, and statistical significance was determined by one-way ANOVA test (bf, h, jm, ou). *P < 0.05; **P < 0.01; ***P < 0.001.
Fig. 3
Fig. 3. NKp46+ILC3 regulation in colitis requires GPX4 for pathogen resistance and barrier repair.
Gpx4fl/fl and RorccreGpx4fl/fl mice were orally inoculated with 1×10⁸ CFU of C.R, and their tissues were collected on Day 8 post-infection. a Representative spleen images and b statistical results of spleen weights at Day 8 post-infection. (n = 3) c Representative H&E staining of the colon sections from indicated mice with C.R infection (scale bars: 100 μm). d The statistical results of histological scores are shown. (n = 4) e Body weight changes of indicated mice. (n = 4) Log10 CFU of C.R in f liver and g spleen tissues on day 8 post infection. (n = 3) h The representative flow cytometry plots of CD4+RORγt+ cells in LPMCs from the indicated mice. i Statistical results of proportion (left) and absolute numbers (right) of CD4+RORγt+ cells are shown. (n = 4) j Representative flow cytometry plots and statistical results of the proportion (left) and absolute number (right) of k ILC3s, including l NKp46+ILC3, m CCR6+ILC3, and n DN cell subsets in LPMCs of Gpx4fl/fl and RorccreGpx4fl/fl mice following C.R infection. (n = 4) o Representative FACS plots of IL-22- (upper) and IL-17A-positive (lower) ILC3s in LPMCs from the indicated mice. Statistical results of proportion (left) and absolute numbers (right) of p IL-22-, and q IL-17A-expressing ILC3s are shown. (n = 3) r Statistical results of the proportion (left) and numbers (right) of neutrophils in LPMCs from the indicated mice. (n = 4) s Relative RegIIIβ and RegIIIγ mRNA expression in the colon tissue of indicated mice. (n = 3) Statistical results of t the percentage of annexin V and 7-AAD double-negative population and u lipid ROS production in LPMC-derived ILC3s from the indicated mice. (n = 3) v Fe2+ level in ILC3s from LPMCs was analyzed using FerroOrange, and the statistical results are shown. (n = 3) Data are presented as the mean ± SEM or median, and statistical significance was determined using two-sided unpaired t-test (b, dg, i, kn, pv). *P < 0.05; **P < 0.01; ***P < 0.001.
Fig. 4
Fig. 4. LCN2 specifically mediates NKp46+ILC3 ferroptosis susceptibility and functions in colitis through GPX4.
a Statistical results of MFI for LCN2 expression in LPMC-derived ILC3s (left) and CD4+RORγt+ cells (right) after in vivo ferroptosis intervention in mice infected with C.R. (n = 4) b Comparison of LCN2 expression in NKp46+ILC3, CCR6+ILC3, and DN cell subsets from LPMCs of WT mice after C.R infection. (n = 4) Lcn2fl/fl and RorccreLcn2fl/fl mice were orally administered with 1 × 108 CFU of C.R, and their tissues were collected on Day 8 post-infection. c Representative spleen images and d statistical results of spleen weight of Lcn2fl/fl and RorccreLcn2fl/fl mice on day 8 post infection. (n = 4) e Representative H&E-stained colon sections from indicated mice with C.R infection (scale bars: 100 μm). f The statistical results of histological scores are shown. (n = 4) g Body weight changes of indicated mice. (n = 4) Log10 CFU of C.R in h liver and i spleen tissues from indicated mice on day 8 post infection. (n = 4) j The comparison of CD4+RORγt+ cell proportions (left) and absolute numbers (right) in LPMCs of Lcn2fl/fl and RorccreLcn2fl/fl mice post C.R infection. (n = 4) Statistical results of the proportion (left) and absolute number (right) of k ILC3s, including l NKp46+ILC3, m CCR6+ILC3, and n DN cell populations in LPMCs of the indicated mice after C.R infection. (n = 4) Statistical results of proportion (left) and numbers (right) of o IL-22-, and p IL-17A-positive ILC3s from LPMCs of indicated mice. (n = 4) q Statistical results of the proportion (left) and numbers (right) of neutrophils in LPMCs from the indicated mice. (n = 4) r Relative RegIIIβ and RegIIIγ mRNA expression in the colon tissue of the indicated mice. (n = 3) s Heatmap of differentially expressed genes related to ferroptosis in ILC3s from Lcn2fl/fl and RorccreLcn2fl/fl mice following C.R infection. t Relative expression of mRNA related to ferroptosis in ILC3s isolated from LPMCs of indicated mice. (n = 3) Statistical results of u the percentage of annexin V and 7-AAD double-negative population and v lipid ROS production in LPMC-derived ILC3s from the indicated mice. (n = 4) w Fe2+ level in ILC3s from LPMCs was analyzed using FerroOrange, and the statistical results are shown. (n = 4) Statistical results of x ATF4, y xCT, and z GPX4 expression in ILC3s from LPMCs of indicated mice. (n = 4) Data are presented as the mean ± SEM or median, and statistical significance was determined using two-sided unpaired t-test (a, b, d, fr, tz). *P < 0.05; **P < 0.01; ***P < 0.001.
Fig. 5
Fig. 5. LCN2 mediates ferroptosis resistance in ILC3s via the ATF4-xCT/GPX4 axis.
MNK3 cells were transfected with si-con / si-Lcn2, or plasmids encoding LCN2 (OELCN2) / empty vector (OEEV) and treated with RSL3 (2-8 μM), erastin (1–4 μM) or vehicle (DMSO) for 16 h. Statistical results of a, c the percentage of annexin V and 7-AAD double-negative population and b, d lipid ROS production in the indicated MNK3 cells. (n = 4) e ATF4, xCT, and GPX4 expression in MNK3 cells following transfection with si-con or si-Lcn2 and treatment with erastin for 16 h. (n = 4) f After transfecting MNK3 cells with si-con or si-Lcn2, the MNK3 cells were subjected to erastin (4 μM) treatment for 12 h in the presence or absence of GSH (0.5 mM) or NAC (0.5 mM), and subsequently, lipid ROS production was assayed. (n = 4) g RORγt, IL-22, and IL-17A expression in MNK3 cells following transfection with si-con or si-Lcn2 and treatment with erastin for 16 h. (n = 3) Statistical results of MFI for h p-p38-Thr180/Tyr182 and i p-ERK1/2 (Thr204/Thr187) expression in the indicated MNK3 cells following treatment with erastin. (n = 3) j ATF4, xCT, and GPX4 expression in MNK3 cells following transfection with plasmids OELCN2 or OEEV and treatment with erastin for 16 h. (n = 4) k RORγt, IL-22, and IL-17A expression was assessed in indicated MNK3 cells treated with erastin for 16 h. (n = 3) Statistical results of MFI for l p-p38-Thr180/Tyr182 and m p-ERK1/2 (Thr204/Thr187) expression in indicated MNK3 cells after treatment with erastin. (n = 3) n, o After transfecting MNK3 cells with plasmids OELCN2 or OEEV, the cells were exposed to erastin for 16 h in the presence or absence of the p38 inhibitor SB203580. n RORγt, IL-22, and IL-17A expression in indicated MNK3 cells. (n = 3) o ATF4, xCT, and GPX4 expression in indicated MNK3 cells. (n = 3) p Statistical results of MFI for p-p38-Thr180/Tyr182 expression in ILC3s from LPMCs of Lcn2fl/fl and RorccreLcn2fl/fl mice post C.R infection. (n = 4) Data are presented as the mean ± SEM or median, and statistical significance was determined using two-sided unpaired t-test (ap). *P < 0.05; **P < 0.01; ***P < 0.001.
Fig. 6
Fig. 6. p38 signaling downstream of LCN2 is specifically involved in regulating NKp46+ILC3 functions and susceptibility to ferroptosis during colitis.
The WT mice were orally administered 1 × 108 CFU of C.R and treated with or without the p38 inhibitor SB203580. Mouse tissues were collected on day 8 post infection (1 mg/kg/day, i.p.). a Representative spleen images and b statistical results of spleen weights at day 8 post infection. (n = 4) c Representative H&E-stained colon sections from indicated mice (scale bars: 100 μm). d The statistical results of histological scores are shown. (n = 4) e The body weight change rates of indicated mice. (n = 4) Log10 CFU of C.R in f liver and g spleen tissues of indicated mice on day 8 post infection. (n = 4) h The representative flow cytometry plots of CD4+RORγt+ cells in LPMCs from the indicated mice. i Statistical results of proportion (left) and numbers (right) of CD4+RORγt+ cells are shown. (n = 4) j The representative flow cytometry plots and statistical results of the proportion (left) and number (right) of k ILC3s, including l NKp46+ILC3, m CCR6+ILC3, and n DN cell subsets in LPMCs of indicated mice. (n = 4) o Representative flow cytometry plots of IL-22- (upper) and IL-17A-positive (lower) ILC3s in LPMCs. Statistical results of proportion (left) and absolute numbers (right) of p IL-22-, and q IL-17A-expressing ILC3 are shown. (n = 4) r Statistical results of the proportion (left) and numbers (right) of neutrophils in LPMCs from the indicated mice. (n = 4) s Relative RegIIIβ and RegIIIγ mRNA expression in the colon tissue of indicated mice. (n = 3) Statistical results of t the percentage of annexin V and 7-AAD double-negative population and u lipid ROS production in LPMCs-derived ILC3s from the indicated mice. (n = 4) v Fe2+ level in ILC3s from LPMCs was analyzed using FerroOrange, and the statistical results are shown. (n = 4) The expression levels of w ATF4, x xCT, and y GPX4 in ILC3s from LPMCs of indicated mice. (n = 4) Data are presented as the mean ± SEM or median, and statistical significance was determined using two-sided unpaired t-test (b, dg, i, kn, py). *P < 0.05; **P < 0.01; ***P < 0.001.
Fig. 7
Fig. 7. Restoring GPX4 expression through Fer-1 treatment effectively alleviates colitis signs in Lcn2fl/flRorccre mice.
RorccreLcn2fl/fl mice infected with C.R were treated with or without Fer-1 (10 mg/kg/day, i.p.), and tissue samples were collected on day 8. a Representative spleen images and b statistical results of spleen weight of the indicated mice. (n = 4) c Representative H&E-stained colon sections from indicated mice (scale bars: 100 μm). d The statistical results of histological scores are shown. (n = 4) e Body weight changes of the indicated mice. (n = 4) Log10 CFU of C.R in f liver and g spleen tissues from indicated mice on day 8 post infection. (n = 4) h Representative flow cytometry plots and i statistical results of the comparison of CD4+RORγt+ cell numbers in LPMCs of indicated groups of mice. (n = 4) j Representative flow cytometry plots and statistical results of the comparison of k ILC3s, including l NKp46+ILC3, m CCR6+ILC3, and n DN cell populations in LPMCs of indicated mice. (n = 4) o Representative flow cytometry plots and statistical results of the comparison of p IL-22-, and q IL-17A-positive ILC3s from LPMCs of the indicated mice. (n = 4) r Statistical results of the proportion (left) and numbers (right) of neutrophils in LPMCs from the indicated mice. (n = 4) s Relative RegIIIβ and RegIIIγ mRNA expression in the colon tissue of the indicated mice. (n = 3) Statistical results of t the percentage of annexin V and 7-AAD double-negative population and u lipid ROS production in LPMCs-derived ILC3s from the indicated mice. (n = 4) v Statistical results of GPX4 expression in ILC3s from LPMCs of the indicated mice. (n = 4) Data are presented as the mean ± SEM or median, and statistical significance was determined using two-sided unpaired t-test (b, dg, i, k–n, pv). *P < 0.05; **P < 0.01; ***P < 0.001.
Fig. 8
Fig. 8
Working model of the regulatory role of LCN2-ATF4-xCT/GPX4 axis in modulating intestinal ILC3 cell function and susceptibility to ferroptosis.

Similar articles

Cited by

References

    1. Zhou W, Sonnenberg GF. Activation and Suppression of Group 3 Innate Lymphoid Cells in the Gut. Trends Immunol 2020;41:721–33. - PMC - PubMed
    1. Morita H, Moro K, Koyasu S. Innate lymphoid cells in allergic and nonallergic inflammation. J Allergy Clin Immunol 2016;138:1253–64. - PubMed
    1. Ebihara T, Song C, Ryu SH, Plougastel-Douglas B, Yang L, Levanon D, et al. Runx3 specifies lineage commitment of innate lymphoid cells. Nat Immunol 2015;16:1124–33. - PMC - PubMed
    1. Vivier E, Artis D, Colonna M, Diefenbach A, Di Santo JP, Eberl G, et al. Innate Lymphoid Cells: 10 Years On. Cell 2018;174:1054–66. - PubMed
    1. Zeng B, Shi S, Ashworth G, Dong C, Liu J, Xing F. ILC3 function as a double-edged sword in inflammatory bowel diseases. Cell Death Dis 2019;10:315. - PMC - PubMed

MeSH terms

Substances

LinkOut - more resources