. 2024 Sep 19;15(1):8232.
doi: 10.1038/s41467-024-52507-y.

PRMT1 inhibition perturbs RNA metabolism and induces DNA damage in clear cell renal cell carcinoma

Affiliations

PRMT1 inhibition perturbs RNA metabolism and induces DNA damage in clear cell renal cell carcinoma

Joseph Walton et al. Nat Commun. .

Abstract

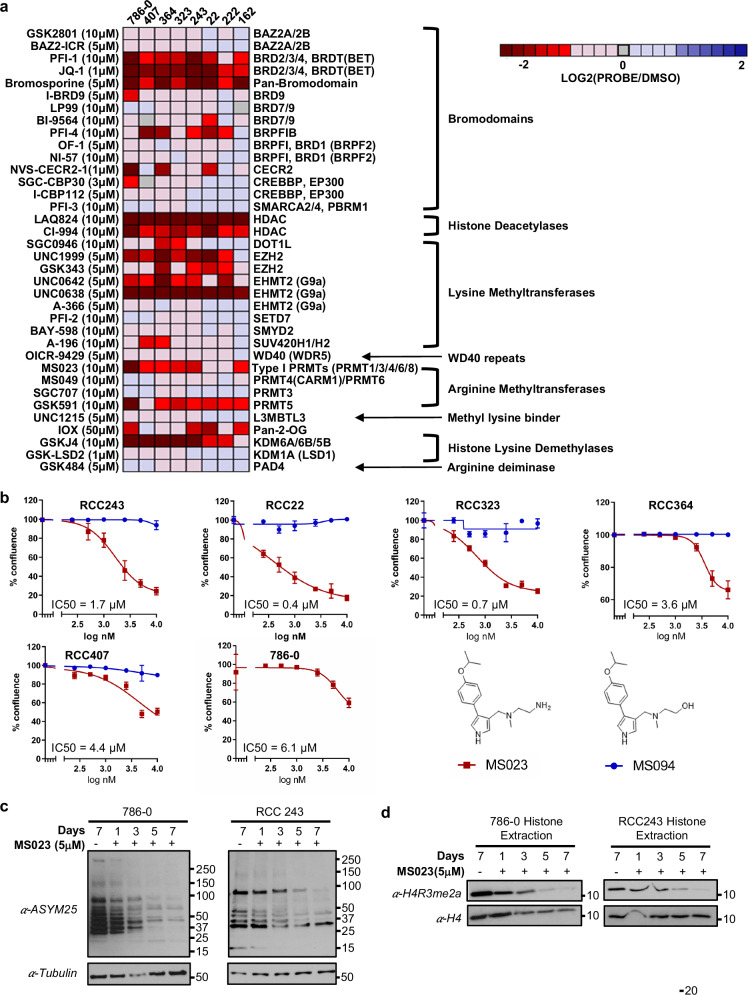
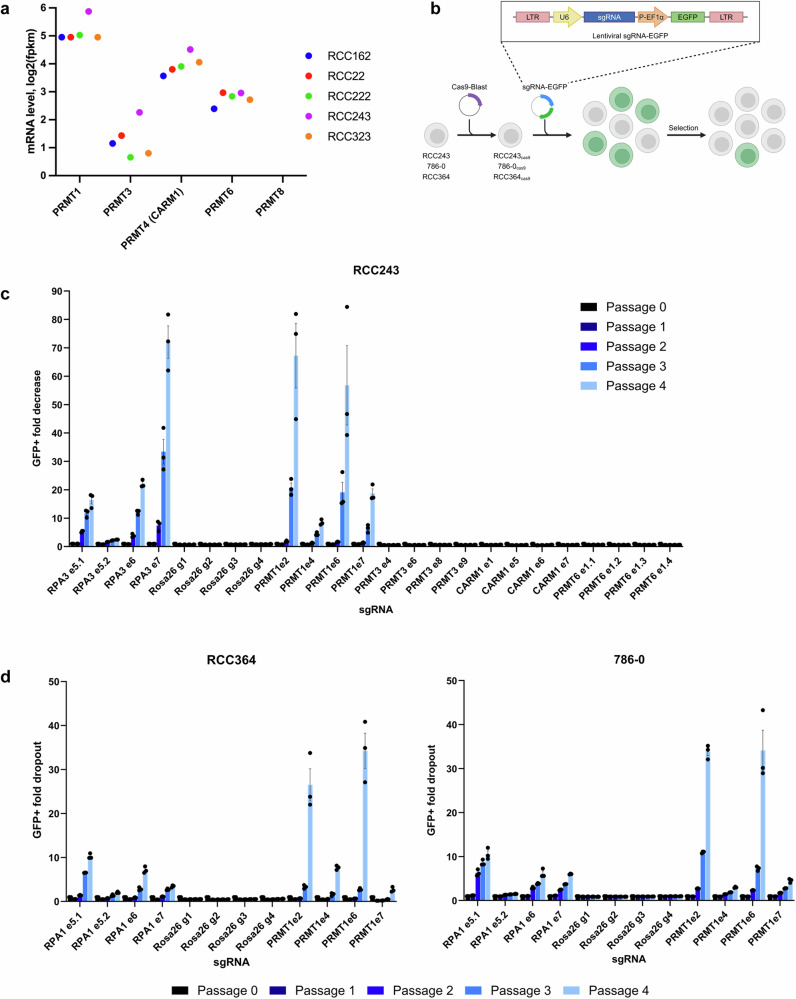
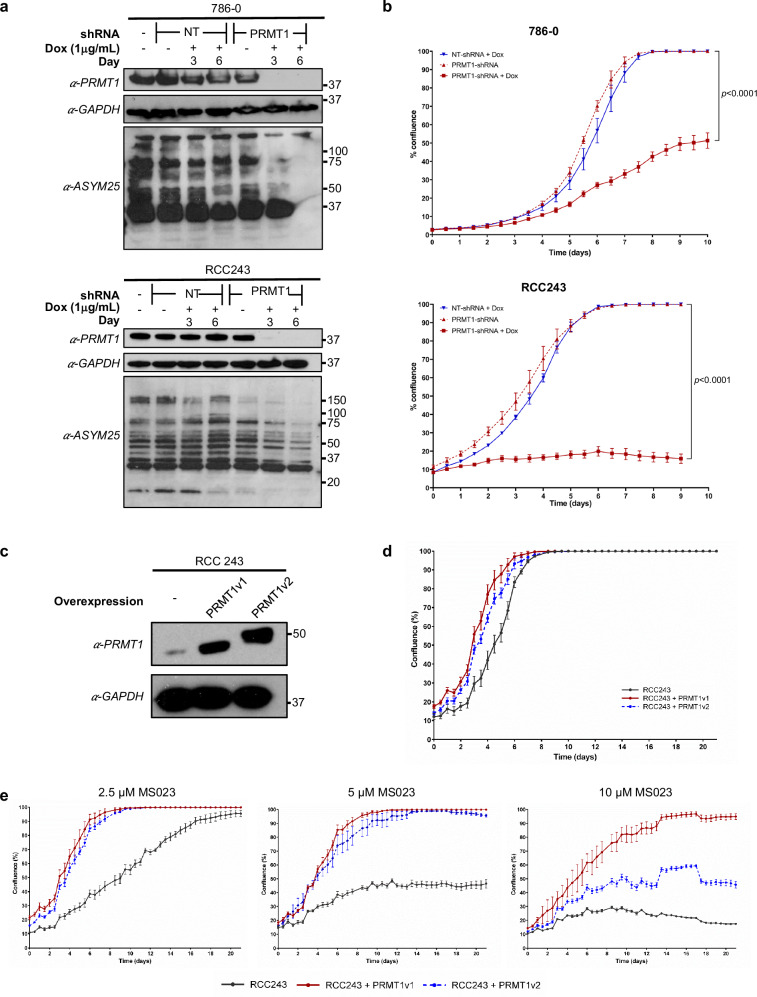
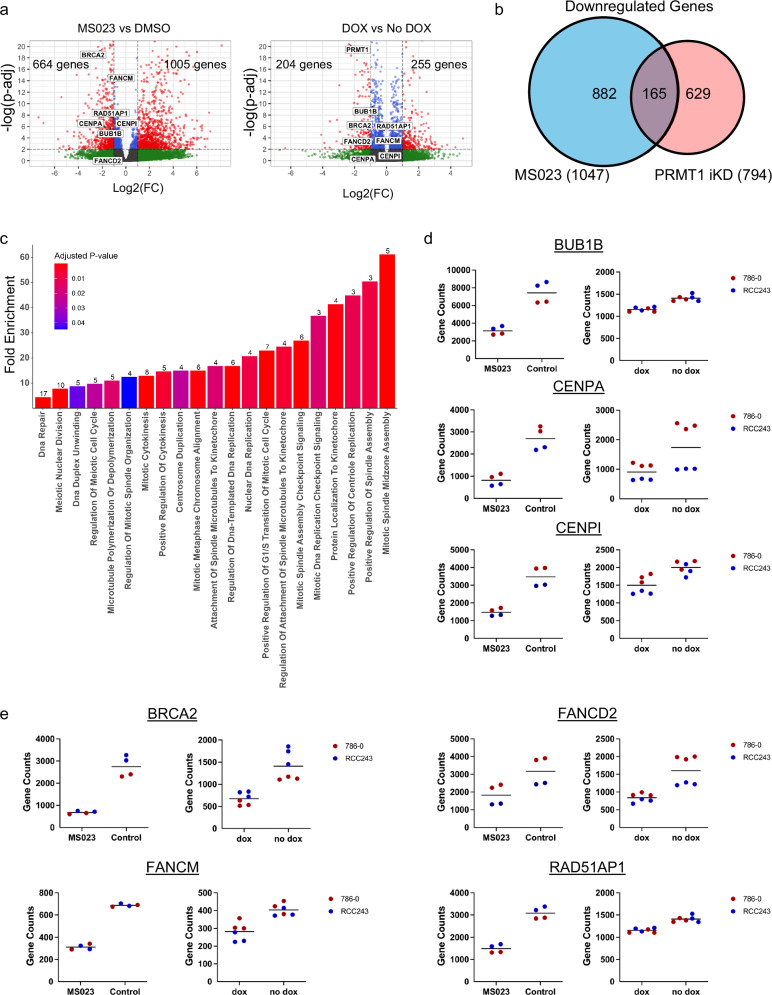
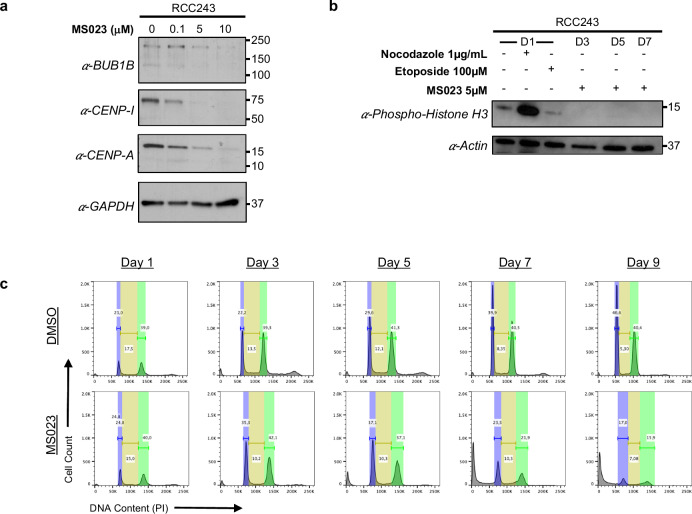
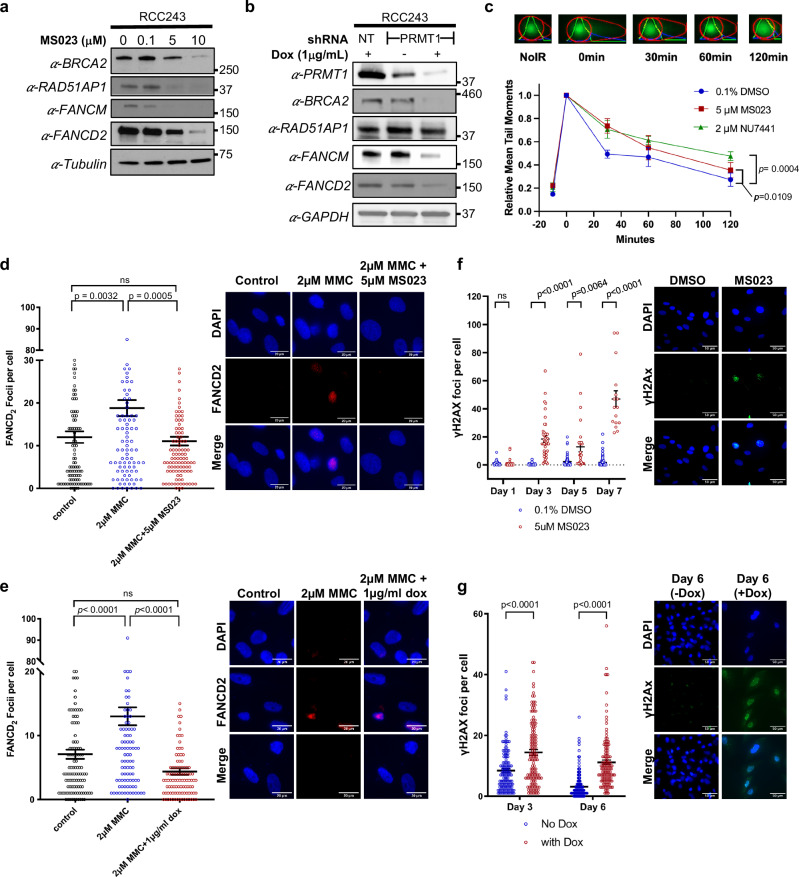
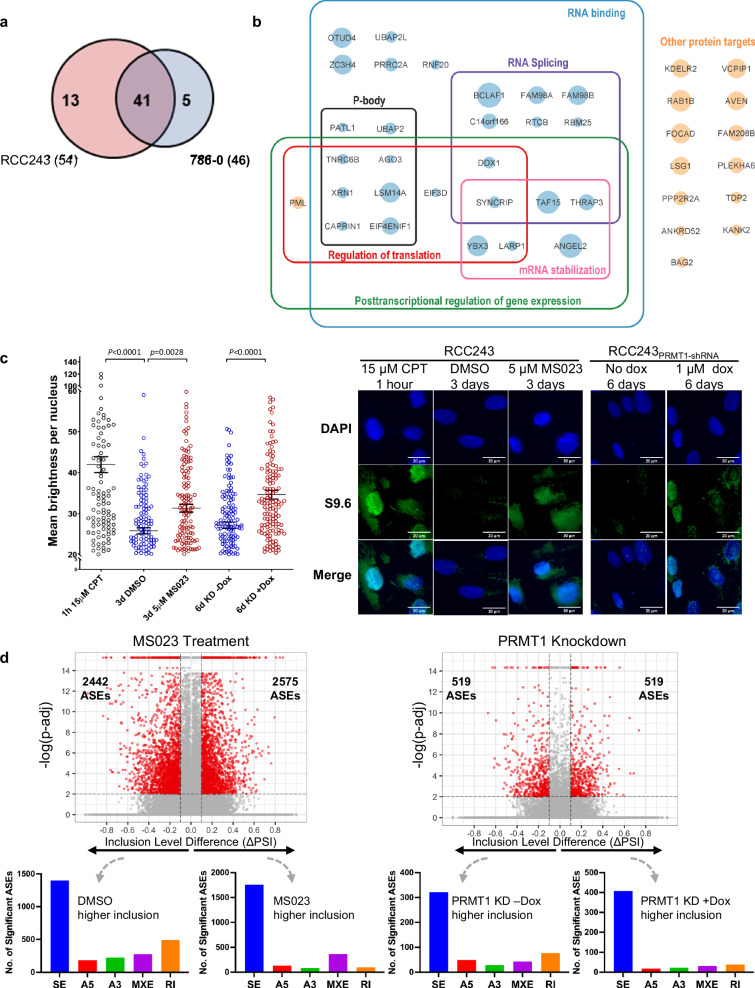
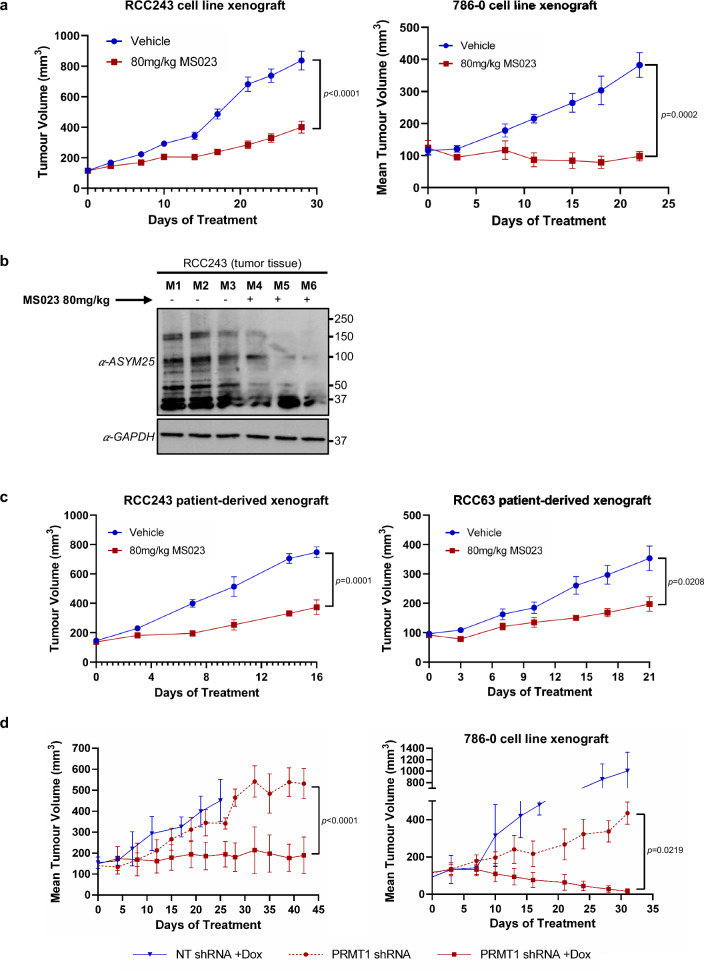
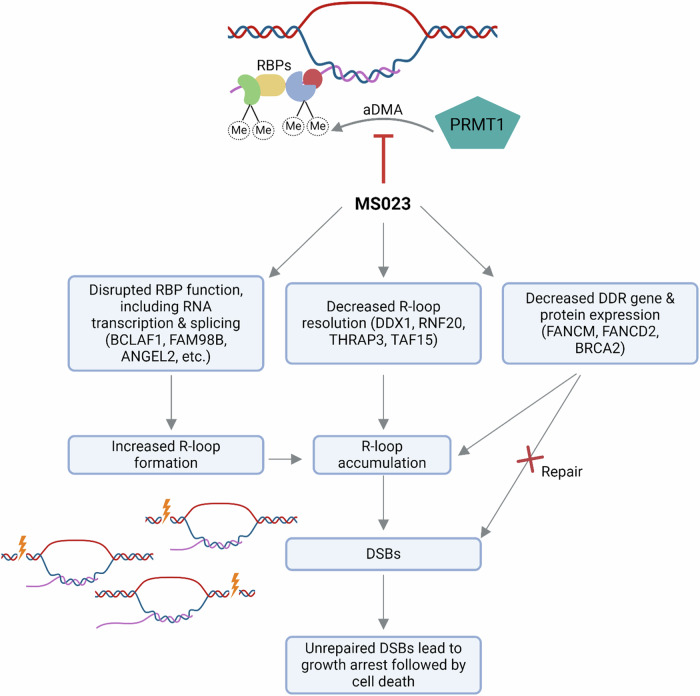
In addition to the ubiquitous loss of the VHL gene in clear cell renal cell carcinoma (ccRCC), co-deletions of chromatin-regulating genes are common drivers of tumorigenesis, suggesting potential vulnerability to epigenetic manipulation. A library of chemical probes targeting a spectrum of epigenetic regulators is screened using a panel of ccRCC models. MS023, a type I protein arginine methyltransferase (PRMT) inhibitor, is identified as an antitumorigenic agent. Individual knockdowns indicate PRMT1 as the specific critical dependency for cancer growth. Further analyses demonstrate impairments to cell cycle and DNA damage repair pathways upon MS023 treatment or PRMT1 knockdown. PRMT1-specific proteomics reveals an interactome rich in RNA binding proteins and further investigation indicates significant widespread disruptions in mRNA metabolism with both MS023 treatment and PRMT1 knockdown, resulting in R-loop accumulation and DNA damage over time. Our data supports PRMT1 as a target in ccRCC and informs a mechanism-based strategy for translational development.


Conflict of interest statement

The authors declare no competing interests.

Figures

Fig. 1
Fig. 1. An epigenetic chemical probe screen identifies type I PRMT inhibitor MS023 as an inhibitor of ccRCC cell proliferation.
a Heat map showing the average cell proliferation values in the presence of the indicated epigenetic chemical probe after seven days exposure in eight ccRCC cell lines (data shown as mean of n  =  3 technical replicates). b Dose–response curves and MS023 IC50 values across a number of ccRCC models (red). MS094 is the negative control probe for MS023 (blue). Data are presented as the mean ± SD calculated from 3 technical replicates for each cell line. Data presented at day 5 for 786-0, Day 7 for RCC243, day 8 for RCC407, day 12 for RCC22 and day 14 for RCC323 (determined based on the time at which control-treated cells reached confluence). c Western blot analysis of asymmetric dimethylarginine (aDMA) changes in 786-0 and RCC243 cells after MS023 treatment using the ASYM25 antibody for indicated period of time. d Western blot analysis of H4R3me2a changes in acid histone extractions of 786-0 and RCC243 following MS023 treatment for indicated period of time. H4 serves as the gel loading control. Source data are provided as a Source Data file.
Fig. 2
Fig. 2. A CRISPR drop out experiment demonstrates that PRMT1 is the critical dependency among type I PRMTs in ccRCC.
a Type I PRMT mRNA expression in ccRCC patient-derived cell lines (each dot represents an individual cell line) shown as fpkm, fragments per kilobase of transcript per million mapped reads. b Schematic representation of the CRISPR-Cas9 competition assay used to determine the functional importance of each type I PRMT enzyme for proliferation and viability in ccRCC cells. c Mean fold-change values (± SEM, n = 3 technical replicates) in the percentage of GFP+ cells, relative to the percentage of GFP+ cells at passage 0 in cell line RCC243 for RPA1 sgRNAs (positive control), ROSA26 gRNAs (negative control) and the indicated type I PRMT sgRNAs (targeting PRMT1, PRMT3, PRMT4/CARM1 and PRMT6). d Mean fold-change values (± SEM, n = 3 technical replicates) in the percentage of GFP+ cells, relative to the percentage of GFP+ cells at passage 0 in cell lines RCC364 and 786-0 for PRMT1 and control sgRNAs. Source data are provided as a Source Data file. Figure (b) Created with BioRender.com released under a Creative Commons Attribution-NonCommercial-NoDerivs 4.0 International license.
Fig. 3
Fig. 3. PRMT1 knockdown inhibits ccRCC proliferation and overexpression results in MS023 resistance.
a Western blot analysis of PRMT1 expression (top) and asymmetric dimethylarginine (aDMA) changes using the ASYM25 antibody (bottom) in 786-0 and RCC 243 cells. Cell lines were engineered to express doxycycline (Dox)-inducible PRMT1 targeting or non-targeting (NT) shRNAs and treated with or without 1.0 μg/mL Dox for 3 and 6 days. b Cell line growth curves (confluence measured in Incucyte® Live-Cell Analysis System) of 786-0 and RCC243 cells expressing PRMT1 targeting or NT shRNAs, with or without Dox. Data are presented as the mean of n = 3 technical replicates ± SEM and p-values are calculated by 2-way ANOVA with repeated measures and Sidak’s multiple comparisons test. c Western blot analysis of RCC243 cell line engineered to overexpress PRMT1 isoforms PRMT1v1 (ENST00000391851.8) and PRMT1v2 (ENST00000454376.7). d Cell line growth curve of RCC243 cells engineered to overexpress PRMT1 isoforms. Data are presented as the mean of n = 3 technical replicates ± SEM. e Cell line growth curves of RCC243 cells engineered to overexpress PRMT1 isoforms in the presence of 2.5 μM, 5 μM and 10 μM MS023. Data are presented as the mean of n = 3 technical replicates ± SEM. Source data are provided as a Source Data file.
Fig. 4
Fig. 4. MS023 treatment leads to down-regulation of genes associated with cell cycle and DDR pathways.
a Volcano plots of log2fold-change for significantly downregulated (red, left) or upregulated (red, right) genes following 3 days of 5 μM MS023 treatment and in cell lines expressing PRMT1 targeting shRNAs treated with or without 1.0 μg/mL Dox for 4 days. Specific mitotic and DNA damage genes of interest explicitly labeled in plot. b Venn diagram highlighting the 165 common significant (FDR ≤ 0.01) downregulated (log2(FC) ≤ 0) genes across MS023 treated and PRMT1 knockdown conditions. c Overrepresentation analysis for gene ontology (GO) biological processes on 165 common significantly down regulated genes across MS023 treatment and PRMT1 knockdown conditions as described in (b). 151/165 genes mapped. Analysis conducted using Fisher’s exact test and PANTHER tool; number of genes in down regulated list per GO biological process listed above each respective bar. GO terms filtered to most specific subclass. d Normalized gene counts (DESeq2’s median of ratios normalization) for mitotic checkpoint protein BUB1B and centromere proteins CENPA and CENPI in RCC243 and 786-0 cells following 5μM MS023 treatment for 3 days (left, n = 2 technical replicates per cell line), and for RCC243 and 786-0 cells expressing PRMT1 targeting shRNAs treated with or without 1.0 μg/mL Dox for 4 days (right, n = 3 technical replicates per cell line). e Normalized gene counts (DESeq2’s median of ratios normalization) for DNA damage proteins FANCM, BRCA2, RAD51AP1 and FANCD2 in RCC243 and 786-0 cells following 5μM MS023 treatment for 3 days (left, n = 2 technical replicates per cell line), and for RCC243 and 786-0 cells expressing PRMT1 targeting shRNAs treated with or without 1.0 μg/mL Dox for 4 days (right, n = 3 technical replicates per cell line).
Fig. 5
Fig. 5. MS023 treatment results in a stalled cell cycle and eventual cell death.
a Western blot analysis of mitotic checkpoint protein BUB1B and centromere proteins CENPA and CENPI in RCC243 cells treated with 0 μM, 0.1 μM, 5 μM, and 10 μM of MS023 for 3 days. b Western blot analysis of phospho-histone H3 in RCC243 cells treated with 0.1 μg/mL Nocodazole (beta-tubulin disruptor and mitotic staller), 100 μM etoposide (DNA damaging agent) and 5 μM MS023 for 3, 5 and 7 days. c Flow cytometric histograms showing cell cycle progression of RCC243 cells in response to 5 μM MS023 inhibition over 9 days. Source data are provided as a Source Data file.
Fig. 6
Fig. 6. MS023 treatment decreases DDR proteins, impedes the formation of FANCD2 foci upon mitomycin C treatment, and causes accumulation of DSBs.
a Western blots for indicated proteins in RCC243 cells treated with indicated doses of MS023 for 3 days. b Western blots for indicated proteins in RCC243 cells with dox-inducible PRMT1-shRNAs treated with or without Dox for 4 days. c RCC243 cells were treated with indicated doses of MS023, DNA-PK-inhibitor NU7441 or DMSO followed by 10 Gy of irradiation and allowed to recover for the indicated times. Cells were analyzed by neutral comet assay. Average comet tail moments ± SEM of three independent experiments are shown. P-values are calculated by 2-way ANOVA with repeated measures and Sidak’s multiple comparisons tests. Representative images pictured above. d, e Scatter plots of FANCD2 foci in RCC243 cells treated with and without MS023 for 3 days (d) or with dox-inducible PRMT1-shRNAs treated with or without Dox for 4 days (e) followed by Mitomycin C for 24 h. Data are presented as mean foci counts ± SEM. P-values are calculated by one-way ANOVA with Sidak’s multiple comparisons test. Representative images are shown to the right. ns, not significant. n = 103 cells (DMSO), 104 cells (MMC) and 107 cells (MMC + MS023) (d). n = 111 cells (DMSO), 110 cells (MMC) and 101 cells (MMC + dox) (e). f, g Scatter plots of γH2AX foci in RCC243 cells treated with and without MS023 (f) or with dox-inducible PRMT1-shRNAs treated with or without Dox (g) for indicated times. Data are presented as mean foci counts ± SEM. P-values are calculated by two-tailed unpaired t-tests with Welch’s correction. Representative images from Day 5 (f) or Day 6 (g) are shown to the right. ns, not significant. n = 45 vs 44 cells (Day 1 DMSO vs MS023), 60 vs 43 cells (Day 3 DMSO vs MS023), 81 vs 27 cells (Day 5 DMS0 vs MS023) and 147 vs 16 cells (Day 7 DMOS vs MS023) (f). n = 128 vs 132 cells (Day 3 No Dox vs Dox) and 217 vs 132 cells (Day 6 No Dox vs Dox) (g). Source data are provided as a Source Data file.
Fig. 7
Fig. 7. Bio-ID reveals RNA-binding proteins as predominant PRMT1 interactors, and MS023 treatment and PRMT1 knockdown induce R-loop formation and alternative splice events.
a Venn diagram of the 59 total high confidence PRMT1 interactors identified in mini-Turbo Bio-ID experiment (log2(FC) ≥ 2 and ≥20 total counts) in RCC243 and/or 786-0. b Summary diagram of the 41 PRMT1 interactors identified in both cell lines. Protein names were imported into Cytoscape 3.9.1 for visual representation and enrichment analysis was carried out using the STRING Enrichment app using the categories GO biological process, GO molecular function and COMPARTMENTS. Circle size corresponds to fold-change in peptide counts between PRMT1-expressing vs control-miniTurbo cells. The majority of PRMT1 interactors correspond to RNA-binding proteins (blue circles), with the remainder corresponding to other proteins that do not fall into any significantly enriched categories (orange circles). c Quantification of nuclear R-loops via immunostaining with the anti-RNA-DNA hybrid S9.6 monoclonal antibody in indicated cell lines and conditions. Data are presented as mean nuclear intensity ± SEM. P-values are calculated by one-way ANOVA with Sidak’s multiple comparisons test. n = 119 nuclei (15uM CPT, RCC243), n = 148 nuclei (3d DMSO, RCC243), n = 154 (3d 5uM MS023, RCC243), n = 153 nuclei (6d No Dox, RCC243PRMT1-shRNA), n = 149 nuclei (6d Dox, RCC243PRMT1-shRNA). Representative images shown on the right. CPT = camptothecin. d Volcano plots of Alternative Splice Events (ASEs) significantly (FDR < 0.01) downregulated (red, left, ΔPSI < −0.1) or upregulated (red, right, ΔPSI > 0.1) following 3 days of 5 μM MS023 treatment or 4 days of doxycycline induction. Bar graphs of significant ASEs by event type (SE = skipped exons, A5 = alternative 5’ splice site, A3 = alternative 3’ splice site, MXE = mutually exclusive exons, RI = retained introns) are shown below the matching volcano plots. Source data are provided as a Source Data file.
Fig. 8
Fig. 8. MS023 treatment and PRMT1 knockdown suppress tumor growth in vivo.
a Tumor growth curves of RCC243 and 786-0 cell line xenograft models treated with MS023 at 80 mg/kg or vehicle control, QD 3 on/4 off. Data are presented as the mean ± SEM and p-values are calculated by 2-way ANOVA with repeated measures and Sidak’s multiple comparisons test. n = 10 mice/group (RCC243) and n = 5 mice/group (786-0). b Western blot analysis of aDMA in RCC243 tumor lysates on day 30. n = 3 mice/group. c Tumor growth curve of RCC63 and RCC243 patient-derived xenograft (PDX) models treated with MS023 at 80 mg/kg or vehicle control, QD 3 on/4 off. Data are presented as the mean ± SEM and p-values are calculated by 2-way ANOVA with repeated measures and Sidak’s multiple comparisons test. n = 5 mice/ group (RCC243 PDX), n = 10 mice/group (RCC63 PDX). d Tumor growth curves of RCC243 and 786-0 cell line xenografts expressing Dox-inducible PRMT1-targeting or NT control shRNAs. n = 5 mice/group (RCC243_NT shRNA (+)Dox, RCC243_PRMT1 shRNA (+)Dox and 786-0_PRMT1 shRNA (+)Dox) and n = 3 mice/group (RCC243_PRMT1 shRNA (-)Dox, 786-0_NT shRNA (+)Dox and 786-0_PRMT1 shRNA (-)Dox). Mice were randomized to either Dox supplemented water (1 mg/mL dox in water) or normal water upon tumor establishment (100–200 mm3). Data are presented as the mean ± SEM and p-values are calculated by 2-way ANOVA with repeated measures and Sidak’s multiple comparisons test. Source data are provided as a Source Data file.
Fig. 9
Fig. 9. Working model for the effect of PRMT1 inhibition on ccRCC cells.
PRMT1 inhibition leads to loss of aDMA post-translational modifications on RBPs involved in RNA processing, resulting in the accumulation of R-loops. Some RBPs in the PRMT1 interactome are reported to be involved in R-loop resolution (e.g. DDX1, RNF20, THRAP3, TAF15), thus in addition to promoting R-loop formation, PRMT1 inhibition may also prevent R-loop resolution. In addition, DDR genes such as FANCM, FANCD2 and BRCA2 are decreased at both the transcriptional and protein level, thus DSBs that result from the presence of unresolved R-loops are not repaired. It remains unclear whether this decreased expression is occurring via effects on RBPs, or other mechanisms such as transcriptional regulation via the H4R3me2a histone mark. FANCM loss also plays a role in R-loop resolution, thus contributing to the phenotype at multiple levels. Unrepaired DSBs lead to growth arrest and ultimately cell death. RBP: RNA-binding protein; aDMA: asymmetric dimethylation; Me: methyl group. Figure 9 created with BioRender.com released under a Creative Commons Attribution-NonCommercial-NoDerivs 4.0 International license.

References

    1. Hsieh, J. J. et al. Renal cell carcinoma. Nat. Rev. Dis. Prim.3, 17009 (2017). - PMC - PubMed
    1. Motzer, R. J. et al. Kidney Cancer, Version 3.2015. J. Natl Compr. Cancer Netw.13, 151–159 (2015). - PubMed
    1. Gupta, K., Miller, J. D., Li, J. Z., Russell, M. W. & Charbonneau, C. Epidemiologic and socioeconomic burden of metastatic renal cell carcinoma (mRCC): a literature review. Cancer Treat. Rev.34, 193–205 (2008). - PubMed
    1. Speed, J. M., Trinh, Q.-D. D., Choueiri, T. K. & Sun, M. Recurrence in localized renal cell carcinoma: a systematic review of contemporary data. Curr. Urol. Rep.18, 15 (2017). - PubMed
    1. Siegel, R. L., Miller, K. D., Jemal, A. & Society, A. C. Cancer statistics, 2020. Ca. Cancer J. Clin.70, 7–30 (2020). - PubMed

Publication types

MeSH terms

Associated data