. 2024 Sep 19;9(1):249.
doi: 10.1038/s41392-024-01963-5.

The p-MYH9/USP22/HIF-1α axis promotes lenvatinib resistance and cancer stemness in hepatocellular carcinoma

Affiliations

The p-MYH9/USP22/HIF-1α axis promotes lenvatinib resistance and cancer stemness in hepatocellular carcinoma

Qiaonan Shan et al. Signal Transduct Target Ther. .

Abstract

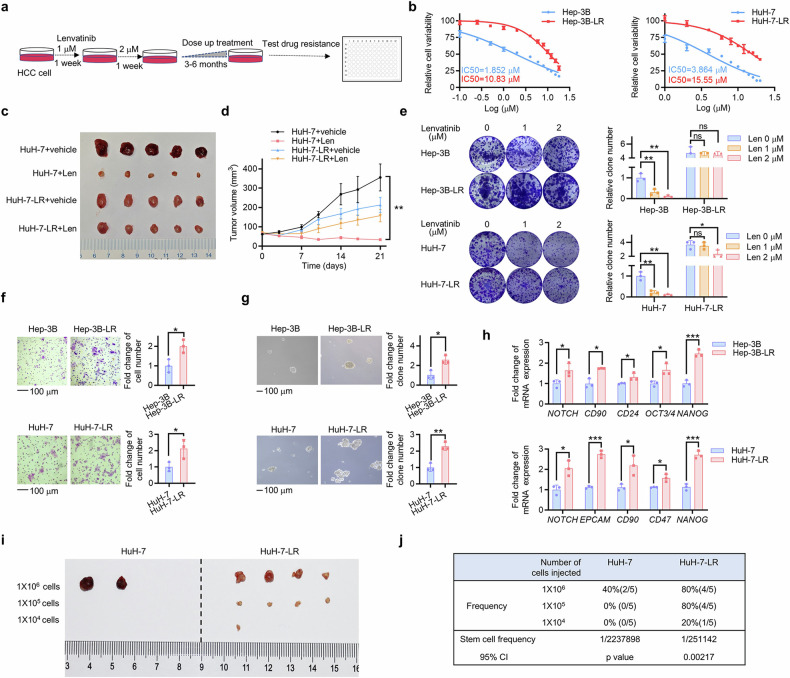
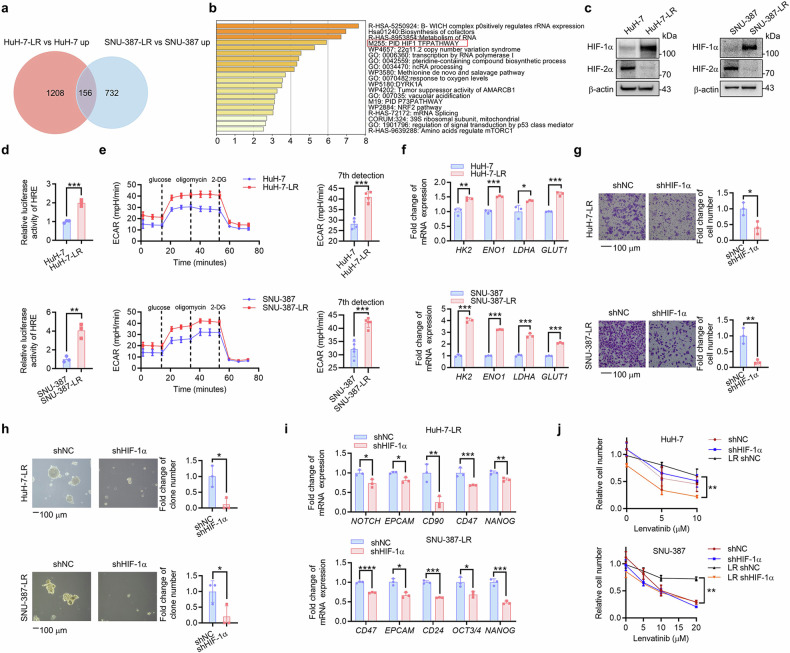
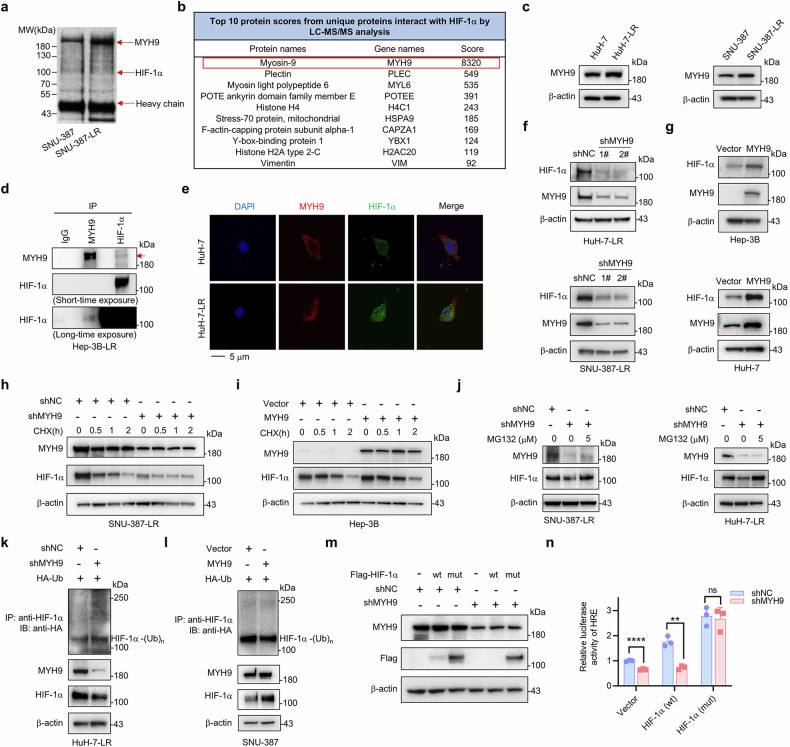
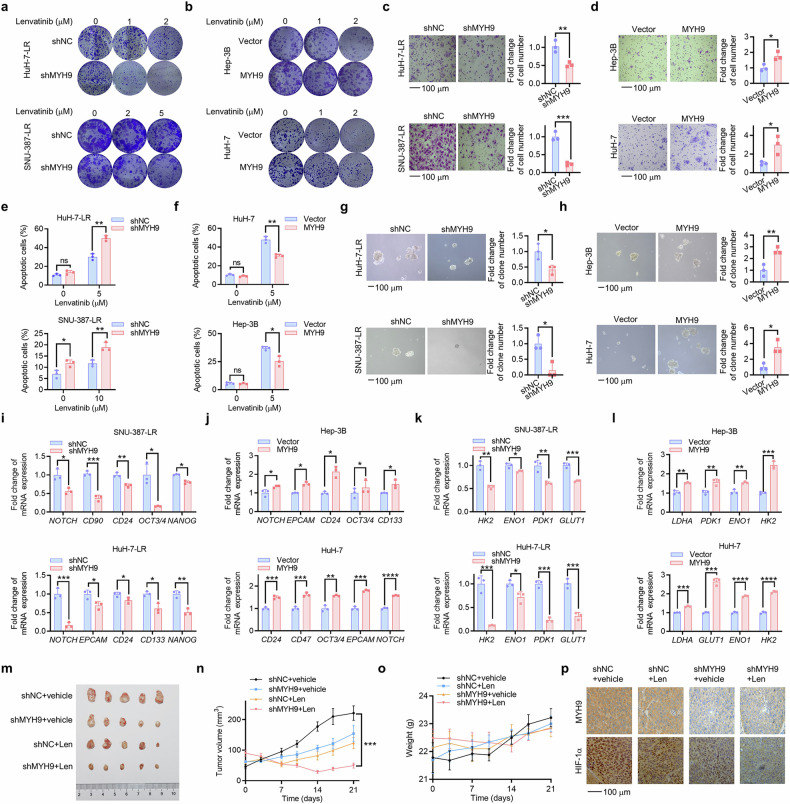
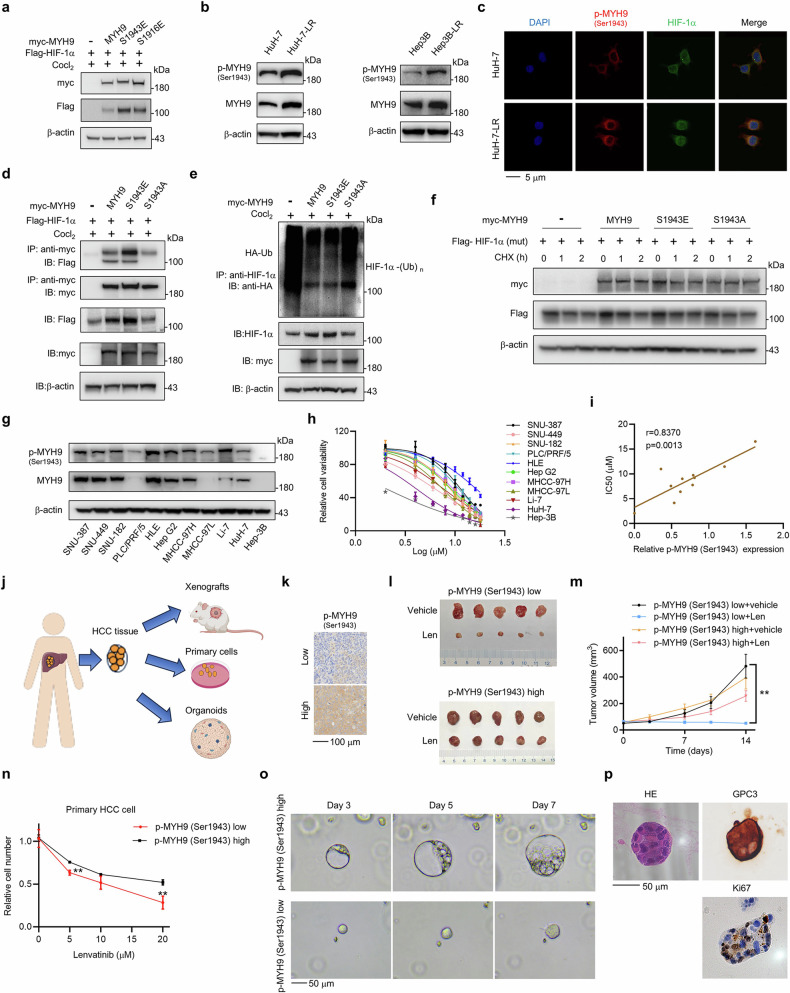
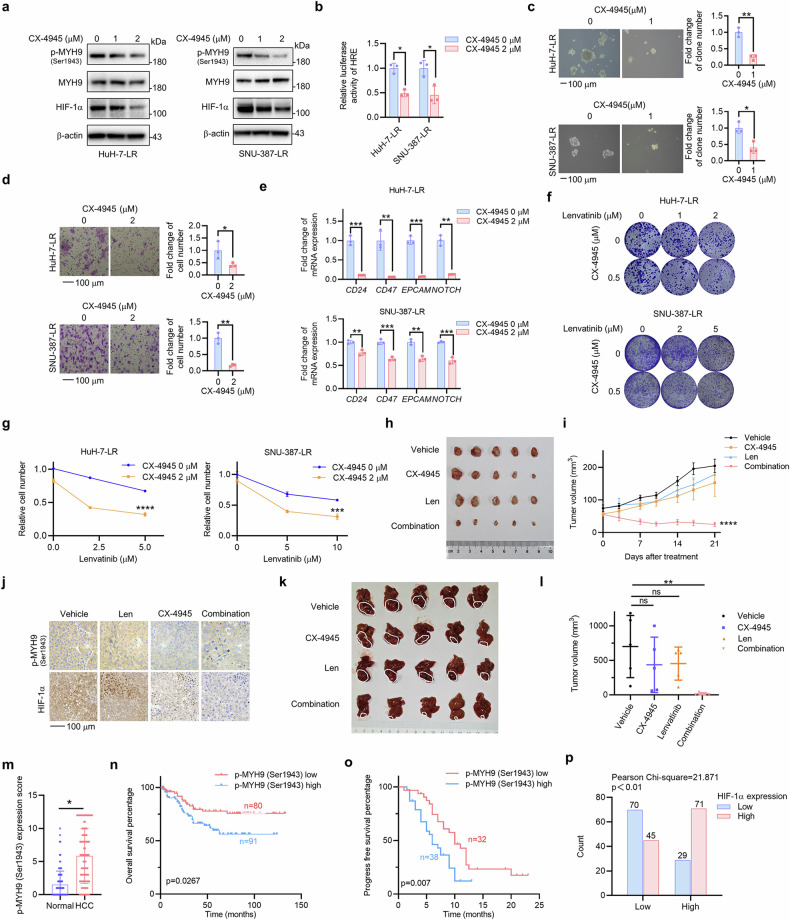
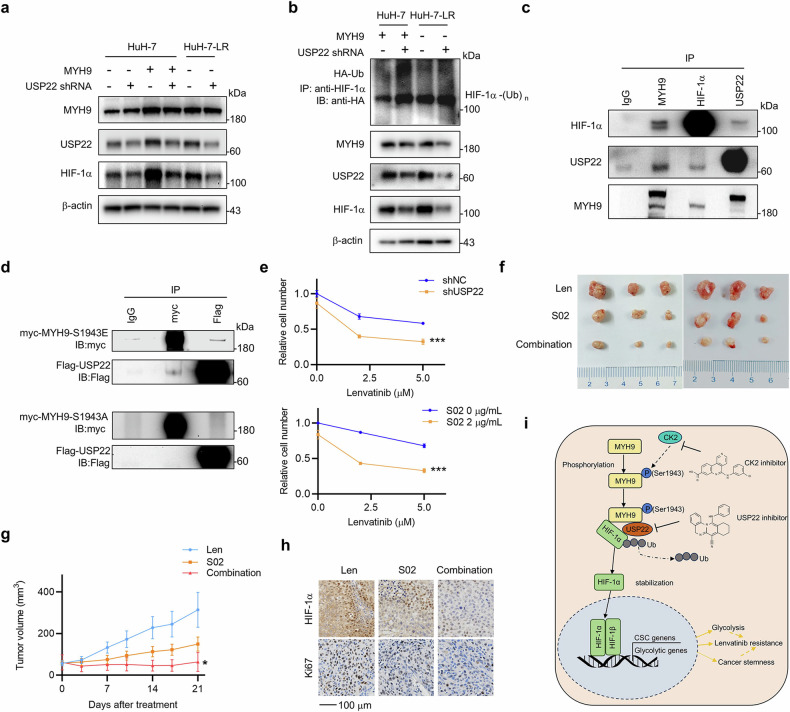
Lenvatinib is a targeted drug used for first-line treatment of hepatocellular carcinoma (HCC). A deeper insight into the resistance mechanism of HCC against lenvatinib is urgently needed. In this study, we aimed to dissect the underlying mechanism of lenvatinib resistance (LR) and provide effective treatment strategies. We established an HCC model of acquired LR. Cell counting, migration, self-renewal ability, chemoresistance and expression of stemness genes were used to detect the stemness of HCC cells. Molecular and biochemical strategies such as RNA-sequencing, immunoprecipitation, mass spectrometry and ubiquitination assays were used to explore the underlying mechanisms. Patient-derived HCC models and HCC samples from patients were used to demonstrate clinical significance. We identified that increased cancer stemness driven by the hypoxia-inducible factor-1α (HIF-1α) pathway activation is responsible for acquired LR in HCC. Phosphorylated non-muscle myosin heavy chain 9 (MYH9) at Ser1943, p-MYH9 (Ser1943), could recruit ubiquitin-specific protease 22 (USP22) to deubiquitinate and stabilize HIF-1α in lenvatinib-resistant HCC. Clinically, p-MYH9 (Ser1943) expression was upregulated in HCC samples, which predicted poor prognosis and LR. A casein kinase-2 (CK2) inhibitor and a USP22 inhibitor effectively reversed LR in vivo and in vitro. Therefore, the p-MYH9 (Ser1943)/USP22/HIF-1α axis is critical for LR and cancer stemness. For the diagnosis and treatment of LR in HCC, p-MYH9 (Ser1943), USP22, and HIF-1α might be valuable as novel biomarkers and targets.


Conflict of interest statement

The authors declare no competing interests.

Figures

Fig. 1
Fig. 1
Acquired lenvatinib-resistant HCC cells display increased cancer stemness. a HCC cells were subjected to escalating doses of lenvatinib over a period of 3–6 months in order to develop lenvatinib-resistant cell models. b The IC50 value of Hep-3B, Hep-3B-LR, HuH-7, and HuH-7-LR cells was determined via CCK-8 assay. Each point on the dose-response curves consisted of five replicates. c A vehicle or a Len treatment was administered to nude mice xenografted with HuH-7 cell (lenvatinib, 30 mg/kg) for 3 weeks (n = 5 per group). The isolated tumors were photographed after the mice were sacrificed. d Tumor volume of each group was measured twice a week. e Hep-3B, Hep-3B-LR, HuH-7, and HuH-7-LR cells were treated with the indicated concentrations of lenvatinib. Then, the remaining cells were stained after 2 weeks with crystal violet staining. The colony formations were photographed and counted. Histograms were used to statistically analyze changes. f The migration ability of Hep-3B, Hep-3B-LR, HuH-7, and HuH-7-LR cells was evaluated by transwell assay after incubation for 24 hours. g The sphere formation assay was used to evaluate the in vitro self-renewal ability. h The qRT-PCR assay was employed to measure the mRNA levels of stemness markers. i Limiting dilution xenograft formation of HuH-7 and HuH-7-LR cells in NOD/SCID mice (n = 5 per group). The isolated tumors were photographed, and the stem cell frequency (j) was calculated. Extreme limiting dilution analysis (ELDA) was used for the limiting dilution assay. The data from cell functional assays and RT-qPCR analysis were presented as mean ± SD of three individual experiments, and the data from animal experiments were presented as mean ± SEM. The Student’s t test was used for comparisons. *p < 0.05, **p < 0.01, ***p < 0.001. Scale bar: 100 μm. LR lenvatinib resistant, CCK-8 Cell Counting Kit-8, ns nonsignificant
Fig. 2
Fig. 2
HIF-1α pathway activation is responsible for acquired LR and increased cancer stemness in HCC. a Top 156 upregulated DEGs of HuH-7-LR versus HuH-7 and SNU-387-LR versus SNU-387 were extracted from RNA-seq data. b Upon KEGG analysis show, it was revealed that the 156 upregulated DEGs were involved in associated with the HIF-1α pathway. c The expression of HIF-1α and HIF-2α was detected in WT and HCC LR cells via western blot analysis. d Changes in relative luciferase activity in WT and HCC LR cells were determined by luciferase reporter assay. e The ECAR of HCC LR cells and WT cells was identified using the Seahorse system. The means and SDs are represented on the column graphs. f qRT-PCR was used to measure the expression of glycolysis driver genes in WT and HCC LR cells. The effects of HIF-1α knockdown (shHIF-1α) or not (shNC) on HuH-7-LR and SNU-387-LR cell stemness were shown according to migration (g), in vitro self-renewal (h), and mRNA expression of stemness markers (i). j The WT and HCC LR cells with or without HIF-1α knockdown (shHIF-1α or shNC) were exposed to the indicated concentrations of lenvatinib for 48 hours. Trypan blue staining-based cell counting was used to detect lenvatinib sensitivity. The data were presented as mean ± SD of three individual experiments. The Student’s t test was used for comparisons. *p < 0.05, **p < 0.01, ***p < 0.001, ****p < 0.0001. Scale bar: 100 μm. DEGs differentially expressed genes, KEGG Kyoto Encyclopedia of Genes and Genomes, WT wild type, LR lenvatinib resistant, HIF-1α hypoxia-inducible factor-1α, HIF-2α hypoxia-inducible factor-2α, HCC hepatocellular carcinoma, ECAR extracellular acidification rate
Fig. 3
Fig. 3
Identifying MYH9 as a HIF-1α-interacting protein and the effect of MYH9 on HIF-1α protein stabilization and ubiquitination. a Immunoprecipitated proteins of SNU-387 and SNU-387-LR cells were separated by SDS-PAGE and visualized by silver staining. b The top 10 protein scores from unique proteins that interact with HIF-1α were identified by LC-MS/MS analysis. c Western blot was conducted to assess the MYH9 expression in WT and HCC LR cells. d The interaction between endogenous MYH9 and HIF-1α was tested in Hep-3B-LR cells. IgG was used as a control. The MYH9 protein is indicated by the red arrow. e Colocalization of HIF-1α (green) with MYH9 (red) was observed by confocal microscopy in HuH-7 and HuH-7-LR cells. The nuclei were stained with DAPI. f Western blot analysis was used to assess the protein expression of MYH9 and HIF-1α following MYH9 knockdown (shMYH9) or shNC in HCC LR cells. g Western blot analysis was used to assess the protein expression of MYH9 and HIF-1α in WT HCC cells with MYH9 overexpression (MYH9) or vector. SNU-387-LR cells were treated with shMYH9 or shNC. h While Hep-3B cells were treated with MYH9 or vector (i). Both cell lines were then exposed to 10 μg/mL CHX for the designed time. The protein levels of HIF-1α and MYH9 were determined via western blot analysis. j SNU-387-LR and HuH-7-LR cells were treated with shMYH9 or shNC, and then exposed to MG132 (5 μM) for 2 hours. Western blot analysis was performed to assess the protein levels of HIF-1α and MYH9. k HuH-7-LR cells were cotransfected with shMYH9 or shNC and Ub (HA-tag) plasmids. l SNU-387 cells were cotransfected with MYH9 overexpression or vector and HA-Ub plasmids. Anti-HIF-1α antibody was used to isolate endogenous HIF-1α and anti-HA antibody was used to detect bound Ub. Exogenous MYH9 and HIF-1α expression in whole cell lysates was detected. m HuH-7-LR cells with shMYH9 or shNC were stably overexpressed with HIF-1α (wt) or mutated HIF-1α (P402A, P564A), HIF-1α (mut), which were with Flag-tag. Flag and MYH9 protein were determined by western blot, while the relative luciferase activity of HRE was analyzed (n). The data were presented as mean ± SD of three individual experiments. The Student’s t test was used for comparisons. **p < 0.01, ****p < 0.0001. Scale bar: 5 μm. IP immunoprecipitation, MYH9 non-muscle myosin heavy chain 9, WT wild type, LR lenvatinib resistant, HIF-1α hypoxia-inducible factor-1α, HCC hepatocellular carcinoma, CHX cycloheximide, HRE hypoxia-responsive element, ns nonsignificant
Fig. 4
Fig. 4
MYH9 promotes LR and cancer stemness in HCC. HCC LR cells with MYH9 knockdown (shMYH9) or shNC. a and WT HCC cells with MYH9 overexpression or vector (b) were cultured with the indicated lenvatinib concentrations. Following 14 days, crystal violet staining was used to determine the remaining cells. The influence of shNC and shMYH9 on HCC LR cell stemness was demonstrated through assessments of migration (c), flow cytometry (e), in vitro self-renewal (g) and the mRNA expression of stemness markers (i) and glycolysis driver genes (k). The influence of vector and MYH9 overexpression on WT HCC cell stemness was demonstrated through assessments of migration (d), flow cytometry (f), in vitro self-renewal (h) and the mRNA expression of stemness markers (j) and glycolysis driver genes (l). m HuH-7-LR cells with shMYH9 or shNC xenografted nude mice were treated with vehicle or Len (lenvatinib, 30 mg/kg) for 3 weeks after the tumor reached an average size of 50–100 mm3 (n = 5 per group). After 21 days, the mice were sacrificed. The isolated tumors were photographed. Tumor volume (n) and mouse weight of each group (o) were recorded every other week. p Immunohistochemistry was used to assess the expression of MYH9 and HIF-1α in the xenografts post-treatment. The data of cell functional assays and RT-qPCR analysis were presented as mean ± SD of three individual experiments, and the data of animal experiments were presented as mean ± SEM. The Student’s t-test was used for comparisons. *p < 0.05, **p < 0.01, ***p < 0.001, ****p < 0.0001. Scale bar: 100 μm., non-muscle myosin heavy chain 9; WT wild type, LR lenvatinib resistant, HIF-1α hypoxia-inducible factor-1α, HCC hepatocellular carcinoma, ns nonsignificant
Fig. 5
Fig. 5
Phosphorylated MYH9 at Ser1943 interacts with HIF-1α and promotes LR and stemness in HCC. a HIF-1α (Flag) and MYH9 (myc) plasmids or phosphorylation mimics at S1943 (S1943E) and S1916 (S1916E) were transfected into HEK-293T cells. Anti-myc antibody was used to detect MYH9, and anti-Flag antibody represented HIF-1α. b The expression of p-MYH9 (Ser1943) in WT and LR HCC cells was detected using western blotting. c Colocalization of HIF-1α (green) with p-MYH9 (Ser1943) (red) was observed by confocal microscopy in HuH-7 and HuH-7-LR cells. The nuclei were stained with DAPI. Scale bar: 5 μm. d HIF-1α interactions with MYH9, MYH9-S1943E and its dephosphorylation mimic (MYH9-S1943A) were tested. Vector (–), MYH9 (wt) and its mutants (myc-tag) were transfected into HEK-293T cells respectively along with HIF-1α plasmid (Flag-tag). The immunoprecipitation assay was conducted to isolate myc-tagged vector and MYH9 protein, and anti-Flag antibody was used to detect bound HIF-1α protein. The expression of Flag-HIF-1α, myc-MYH9 and β-actin in whole cell lysates was verified. e MYH9, MYH9-S1943E and MYH9-S1943A (myc-tag) were transfected into HEK-293T cells respectively along with Ub plasmid (HA-tag). The immunoprecipitation assay was conducted to isolate endogenous HIF-1α and anti-HA antibody was used to detected bound Ub. The expression levels of HIF-1α and my-tagged MYH9 in whole cell lysates was verified. f Vector (–), MYH9 (wt) and its mutants (myc-tag) were transfected into HEK-293T cells respectively along with mutated HIF-1α (P402A, P564A) (HIF-1α (mut)) plasmids (Flag-tag). 10 μg/mL CHX was added at the designed time. Western blot was used to assess the expression of HIF-1α and MYH9. g The expression of p-MYH9(Ser1943) and MYH9 in multiple HCC cell lines was analyzed by western blot. h The IC50 of multiple HCC cell lines was measured by a CCK-8 assay to determine cell viability. Each point on the dose-response curves represents five technical replicates. i The correlation between IC50 and the relative p-MYH9 (Ser1943) protein expression was examined. j Schematic of the construction of PDXs, primary cells and PDOs models from human HCC tissues. Created with BioRender.com. k Selection of patients with high and low expression of p-MYH9 (Ser1943) were detected by IHC. Scale bar: 100 μm. l NOD/SCID mice bearing PDX with high and low expression of p-MYH9 (Ser1943) were treated with vehicle or lenvatinib for 2 weeks (n = 5 per group). The isolated tumors were photographed. m Tumor volume of each group was measured twice a week. n Primary cells with high or low expression of p-MYH9 (Ser1943) were treated with lenvatinib under different concentrations for 48 hours in vitro. Alive cell numbers of each group were counted. Relative cell number was calculated. o The relative representative bright-field microscopy images of PDO with high or low expression of p-MYH9 (Ser1943) were photographed on Day 3, 5 and 7. p HE staining of PDO and IHC staining of GPC3 and Ki67 in PDO with high expression of p-MYH9 (Ser1943) were detected. Scale bar: 50 μm. The relevance analysis was conducted using Pearson’s correlation. The data of cell functional assays were presented as mean ± SD of three individual experiments, and the data of animal experiment were presented as mean ± SEM. The Student’s t test was used for comparisons. **p < 0.01. MYH9 non-muscle myosin heavy chain 9, WT wild type, LR lenvatinib resistant, HIF-1α hypoxia-inducible factor-1α, HCC hepatocellular carcinoma, CHX cycloheximide, CCK-8 Cell Counting Kit-8, IP immunoprecipitation, PDX patient-derived xenograft PDO patient-derived organoid
Fig. 6
Fig. 6
p-MYH9 (Ser1943) is a therapeutic target for stemness and LR, and predicts poor prognosis and LR in patients with HCC. a HuH-7-LR and SNU-387-LR cells were exposed to the indicated concentrations of CX-4945. Western blot was used to assess expression of p-MYH9 (Ser1943), MYH9 and HIF-1α (b) The effect of CX-4945 treatment on the relative luciferase activity of HRE in HCC LR cells was also investigated. The influence of CX-4945 on HCC LR cell stemness was used to assess in vitro self-renewal (c), migration (d), the mRNA expression of stemness markers (e) and colony formation (f). g HuH-7-LR and SNU-387-LR cells were treated with DMSO or 2 μM CX-4945 combined with the indicated concentration of lenvatinib. Differences in sensitivity to lenvatinib and CX-4945 were observed through cell count using trypan blue staining. h HuH-7-LR cell xenografted nude mice were administrated with vehicle, Len (lenvatinib, 30 mg/kg), CX-4945 (20 mg/kg) and their combination daily for 3 weeks after the tumor volume reached an average size of 50–100 mm3 (n = 5 per group). Then, the mice were sacrificed and the isolated tumors were photographed. i Tumor volume of each group was measured twice a week. j IHC was used to detect the expression of HIF-1α and p-MYH9 (Ser1943) in the xenografts following treatment. k HuH-7-LR cell was injected into the sub-capsular space of right liver lobe nude mice to establish the orthotopic tumor model. After 1 week, mice were treated with vehicle, Len (lenvatinib, 30 mg/kg), CX-4945 (20 mg/kg) and their combination daily for 3 weeks (n = 5 per group). Then, the mice were sacrificed and the isolated livers were photographed. l Tumor volume was calculated. m p-MYH9 (Ser1943) expression was detected by IHC in normal adjacent to tumor tissue (NAT) and HCC samples from 171 patients. Based on IHC staining of p-MYH9 (Ser1943), patients were categorized into two groups, and subsequent overall survival curves (n) were plotted. o Patients with HCC treated with lenvatinib were separated into two groups depending on their p-MYH9 (Ser1943) protein expression, and subsequent progression-free survival curves were plotted. p Positive correlation between p-MYH9 (Ser1943) and HIF-1α IHC results in 215 HCC samples. The data of cell functional assays, Luciferase reporter assay and RT-qPCR analysis were presented as mean ± SD of three individual experiments, and the data of animal experiments were presented as mean ± SEM. The Student’s t-test was used for comparisons. *p < 0.05, **p < 0.01, ***p < 0.001, ****p < 0.0001. Scale bar: 100 μm. MYH9 non-muscle myosin heavy chain 9, LR lenvatinib resistance, HIF-1α hypoxia-inducible factor-1α, HRE hypoxia-responsive element, HCC hepatocellular carcinoma, IHC immunohistochemistry, DMSO dimethyl sulfoxide, ns nonsignificant
Fig. 7
Fig. 7
p-MYH9 (Ser1943) recruits USP22 to deubiquitinate HIF-1α and promote LR. a HuH-7 cells with vector and MYH9 overexpression and HuH-7-LR cells, accompanied by USP22 knockdown (shUSP22) or not, the altered protein expression of MYH9, HIF-1α and USP22 was detected through western blot. b Both the shUSP22 and Ub (HA-tagged) plasmids were transfected into HuH-7 cells with MYH9 overexpression and HuH-7-LR cells. Anti-HIF-1α antibody was used to isolated the HIF-1α protein and anti-HA antibody was used to detected bound Ub. MYH9, HIF-1α and USP22 protein expression levels were determined in whole cell lysates. c The interaction of endogenous MYH9, HIF-1α and USP22 was detected in HuH-7-LR cells. IgG was used as a control. d USP22 (Flag-tag) plasmid was transfected with MYH9-S1943E (myc-tag) or MYH9-S1943A (myc-tag) plasmids in HEK-293T cells. The interaction of myc protein and Flag protein was detected. IgG was used as a control. e HuH-7-LR cells were transfected with shNC or shUSP22, and cells were treated with DMSO or 2 μg/mL USP22 inhibitor, S02 combined with the indicated concentration of lenvatinib. Variations in lenvatinib and USP22 inhibitor sensitivity were detected by trypan blue staining-based cell count. The data were presented as mean ± SD of three individual experiments. f HuH-7-LR cell xenografted nude mice were fed lenvatinib (30 mg/kg), S02 (10 mg/kg) and their combination daily for three weeks after the tumor volume reached an average size of 50–100 mm3 (n = 6 per group). The isolated tumors were photographed. g Tumor volume of each group was measured twice a week. After 21 days, the mice were sacrificed. The data were presented as mean ± SEM. h Immunohistochemistry was used to detect the expression of HIF-1α and Ki67 in the xenografts after various treatments. i Graphical summary of the molecular mechanisms involving MYH9, HIF-1α and USP22 in regulating of CSC properties in lenvatinib-resistant cells. The graph was created by Microsoft Powerpoint. The Student’s t-test was used for comparisons. *p < 0.05, ***p < 0.001. Scale bar: 100 μm. MYH9 non-muscle myosin heavy chain 9, LR lenvatinib resistant, HIF-1α hypoxia-inducible factor-1α, USP22 ubiquitin-specific protease 22, DMSO dimethyl sulfoxide, CSC cancer stem cell

References

    1. Sung, H. et al. Global Cancer Statistics 2020: GLOBOCAN estimates of incidence and mortality worldwide for 36 cancers in 185 countries. CA Cancer J. Clin.71, 209–249 (2021). - PubMed
    1. Forner, A., Reig, M. & Bruix, J. Hepatocellular carcinoma. Lancet391, 1301–1314 (2018). - PubMed
    1. Fang, H., Ke, Q., Wu, S., Tu, Q. & Wang, L. Immune-targeted therapy with transarterial chemo(embolization) for unresectable HCC: a systematic review and meta-analysis. Front. Immunol.15, 1421520 (2024). - PMC - PubMed
    1. Kudo, M. et al. Lenvatinib versus sorafenib in first-line treatment of patients with unresectable hepatocellular carcinoma: a randomised phase 3 non-inferiority trial. Lancet391, 1163–1173 (2018). - PubMed
    1. Wang, S. et al. BNIP3-mediated mitophagy boosts the competitive growth of Lenvatinib-resistant cells via energy metabolism reprogramming in HCC. Cell Death Dis.15, 484 (2024). - PMC - PubMed

Publication types

MeSH terms