. 2024 Sep 19;15(1):8239.
doi: 10.1038/s41467-024-52576-z.

Metastable water at several compression rates and its freezing kinetics into ice VII

Affiliations

Metastable water at several compression rates and its freezing kinetics into ice VII

Charles M Pépin et al. Nat Commun. .

Abstract

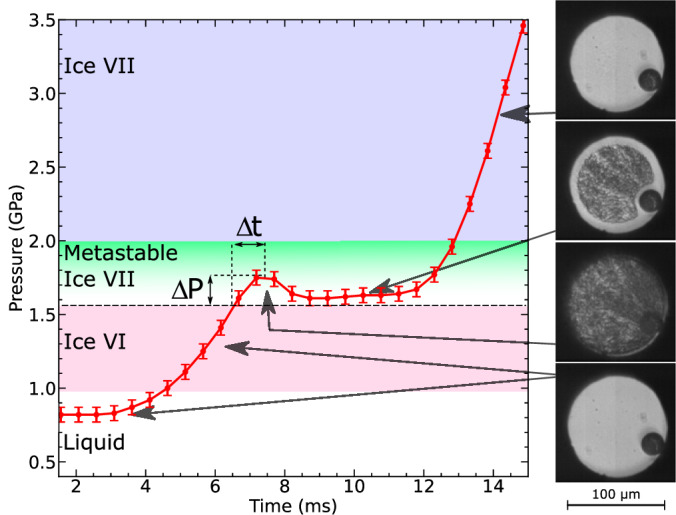
Water can be dynamically over-compressed well into the stability field of ice VII. Whether water then transforms into ice VII, vitreous ice or a metastable novel crystalline phase remained uncertain. We report here the freezing of over-compressed water to ice VII by time-resolved X-ray diffraction. Quasi-isothermal dynamic compression paths are achieved using a dynamic-piezo-Diamond-Anvil-Cell, with programmable pressure rise time from 0.1 ms to 100 ms. By combining the present data set with those obtained on various ns-dynamical platforms, a complete evolution of the solidification pressure of metastable water versus the compression rate is rationalized within the classical nucleation theory framework. Also, when crystallization into ice VII occurs in between 1.6 GPa and 2.0 GPa, that is in the stability field of ice VI, a structural evolution over few ms is then observed into a mixture of ice VI and ice VII that seems to resolve apparent contradictions between previous results.


Conflict of interest statement

The authors declare no competing interests.

Figures

Fig. 1
Fig. 1. Dynamic-DAC experimental setup.
a Schematic of the experimental configuration. X-ray diffraction spectra are recorded as a function of time on a JUNGFRAU 1M detector in a Debye–Scherrer geometry (b) and are azimuthaly integrated into an XRD pattern where the diffraction peaks of ice VII are clearly measured in 20 μs (c). SrB4O7 : Sm2+ fluorescence over time is recorded on an iXon EMCCD (d) alongside images on a Photron Fast Camera. A typical system pressure response (red) to the input voltage (blue) are plotted versus time (e).
Fig. 2
Fig. 2. Dynamic compression of liquid water at 0.4 GPa/ms.
The sample pressure over time is measured using the SrB4O7 : Sm2+-chip fluorescence while micro-photographs are recorded at 40 kHz framing time. Errors bars are estimated to be  ±0.05 GPa following and our system sensitivity. At the liquid-solid phase transition a characteristic pressure drop due the density difference is observed. Visual observation with the ultra-fast camera reveals a homogeneous nucleation in the sample volume. The over-compression pressure, ΔP, is defined as the pressure differential between crystallization and the associated ice VII melting at the same temperature (1.56 GPa). The quantity Δt represents the corresponding duration over which fluid water remains in its metastable state.
Fig. 3
Fig. 3. Measured pressure as a function of time for compression rates of 1.6 GPa/ms and 110 GPa/ms.
At the freezing pressure into ice VII, a rupture in the compression slope is observed due to the negative discontinuity at crystallization. Pressure is measured using the SrB4O7 : Sm2+ fluorescence gauge and in some cases using the volume of a piece of Cu embedded in the sample chamber. The freezing into ice VII is evidenced from the XRD pattern. After freezing, excellent agreement is observed between the pressure measured from the volume of ice VII, the luminescence gauge and the volume of Cu. Good reproducibility of the sample pressure response to a given voltage function driving the piezo-actuator is observed. The quantities ΔP and Δt defined in the text are represented for each run. Note the break in scale for the horizontal axis.
Fig. 4
Fig. 4. The time evolution of the integrated XRD image of water freezing under a 0.8 GPa/ms compression rate.
Metastable water crystallizes first into ice VII as evidenced by the appearance of its (110) peak at 580 μs.  ~200 μs later, diffraction peaks attributed to ice VI are observed. The horizontal red and green lines mark the apparition of the ice VII and ice VI respectively. Top: integrated diffraction pattern of the same sample held at the maximum pressure of 1.8 GPa taken after a few minutes. A mixture of ice VI and ice VII is still observed.
Fig. 5
Fig. 5. Over-compression (ΔP) as a function of compression rate (Π).
Our data points alongside the averaged points from refs. ,– are reported. Temperature at freezing is shown as a color-scale. The gray-dashed lines is the best fit result of the power function ΔP = aΠc + b, with a = 2.6654, b = −2.2544 and c = 0.0564. Inset: Low-pressure phase diagram of H2O showing how the ΔP is calculated for isentropic compressions of refs. ,. Errors bars are estimated from the pressure measurements and from the ones given in the literature.
Fig. 6
Fig. 6. Logarithm of the nucleation time as a function of over-compression.
The nucleation time is assumed as tn = αΔt, with α = 1 for the figure. Changing α only changes the constant of the fit. Our data points with averaged points from refs. , are fitted using the CNT-based phenomenological model given in Eq. (4) with the three free parameters equal to: log(tmin) = −11.39, a = 5380.17 and b = 2.453e8. Inset: Extrapolation of the CNT model at large over-compression showing an asymptotic limit at the picosecond-timescale. The error bars in pressure are shown while those in time are smaller than the symbol size. They are estimated from the pressure measurements and from the ones given in the literature.

References

    1. Hansen, T. C. The everlasting hunt for new ice phases. Nat. Commun.12, 3161 (2021). - PMC - PubMed
    1. Loerting, T., Fuentes-Landete, V., Tonauer, C. M. & Gasser, T. M. Open questions on the structures of crystalline water ices. Commun. Chem.3, 109 (2020). - PMC - PubMed
    1. Kamb, B. & Davis, B. L. Ice VII the densest form of ice. Proc. Natl. Acad. Sci. USA52, 1433 (1964). - PMC - PubMed
    1. Petrenko, V. F. & Whitworth, R. W. Physics of Ice (Oxford University Press, 1999).
    1. Bartels-Rausch, T. et al. Ice structures, patterns, and processes: a view across the icefields. Rev. Mod. Phys.84, 885–944 (2012).

LinkOut - more resources