. 2024 Sep 19;15(1):8224.
doi: 10.1038/s41467-024-52246-0.

Shared neutrophil and T cell dysfunction is accompanied by a distinct interferon signature during severe febrile illnesses in children

Collaborators, Affiliations

Shared neutrophil and T cell dysfunction is accompanied by a distinct interferon signature during severe febrile illnesses in children

Harsita Patel et al. Nat Commun. .

Abstract

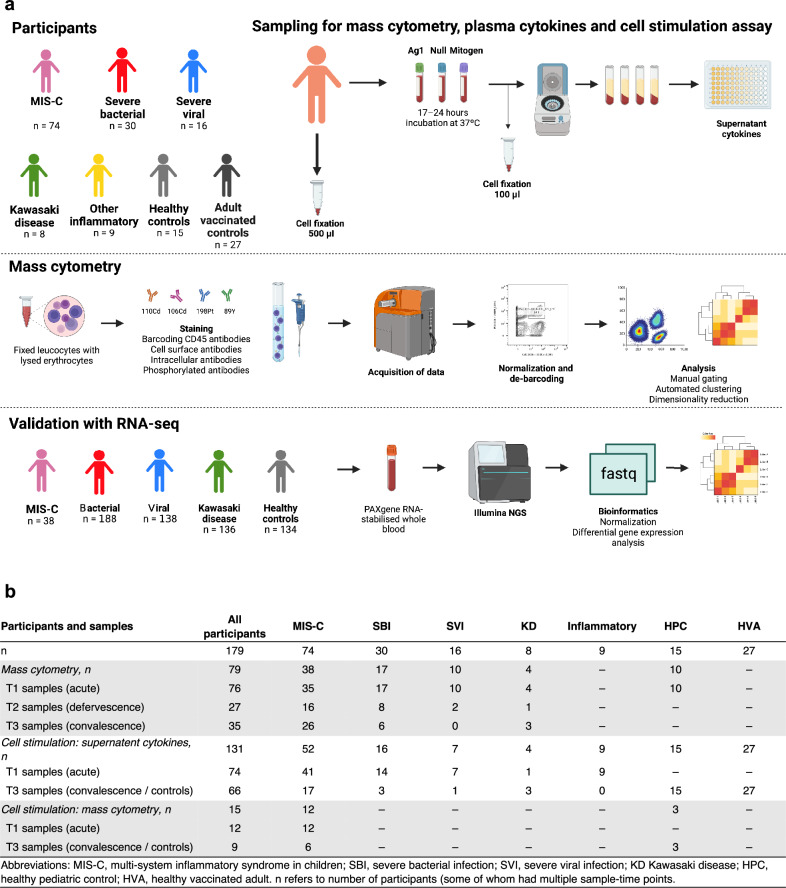
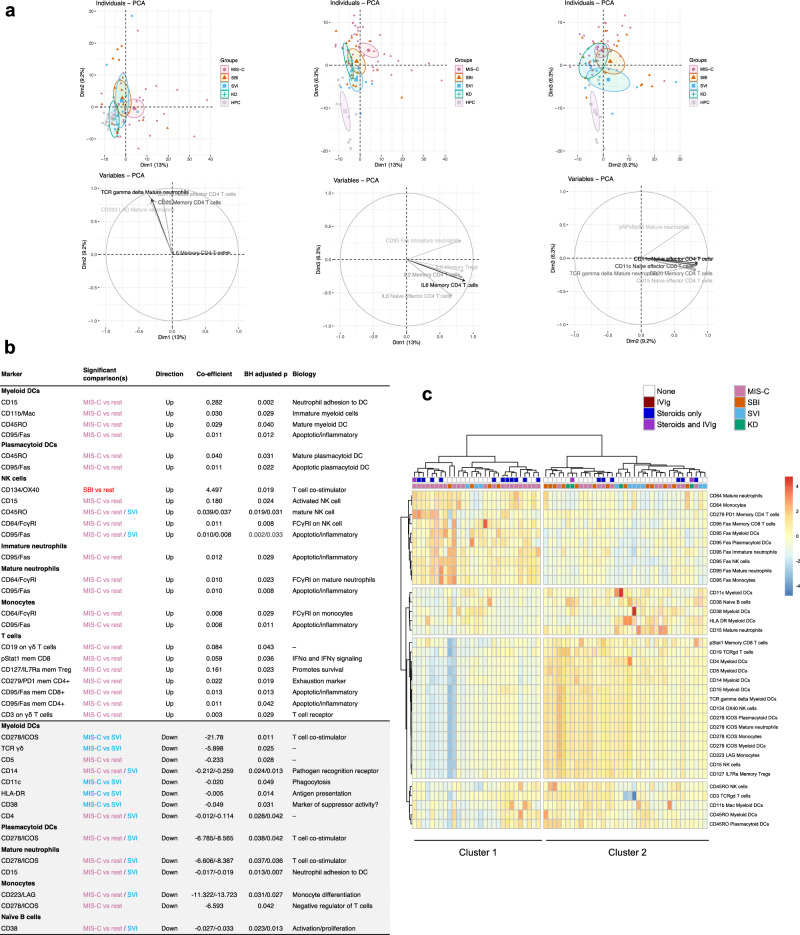
Severe febrile illnesses in children encompass life-threatening organ dysfunction caused by diverse pathogens and other severe inflammatory syndromes. A comparative approach to these illnesses may identify shared and distinct features of host immune dysfunction amenable to immunomodulation. Here, using immunophenotyping with mass cytometry and cell stimulation experiments, we illustrate trajectories of immune dysfunction in 74 children with multi-system inflammatory syndrome in children (MIS-C) associated with SARS-CoV-2, 30 with bacterial infection, 16 with viral infection, 8 with Kawasaki disease, and 42 controls. We explore these findings in a secondary cohort of 500 children with these illnesses and 134 controls. We show that neutrophil activation and apoptosis are prominent in multi-system inflammatory syndrome, and that this is partially shared with bacterial infection. We show that memory T cells from patients with multi-system inflammatory syndrome and bacterial infection are exhausted. In contrast, we show viral infection to be characterized by a distinct signature of decreased interferon signaling and lower interferon receptor gene expression. Improved understanding of immune dysfunction may improve approaches to immunomodulator therapy in severe febrile illnesses in children.


Conflict of interest statement

The authors declare no competing interests.

Figures

Fig. 1
Fig. 1. Schematic representation of the study cohort, experimental flow and samples analyzed.
a Summary of the number of samples used for mass cytometry and cell stimulation assay from each disease groups at timepoints T1 (acute), T2 (defervescence), T3 (convalescence). b Sample numbers available and analyzed. For a full overview of the sample types and at an individual level see the Supplementary Fig. 1. Abbreviations: MIS-C, multi-system inflammatory syndrome in children; SBI, severe bacterial infection; SVI, severe viral infection; KD, Kawasaki disease; HPC, healthy pediatric control; HAC, healthy adult control. Figure 1a created with BioRender.com released under a Creative Commons Attribution-NonCommercial-NoDerivs 4.0 International license. Source data are provided as a Source Data file.
Fig. 2
Fig. 2. Supervised and unsupervised approaches to immune cell data show differences between disease groups and key immune cell features in acute (T1) disease.
a Principal component analyses of immune cell features measured by patient and disease group (small symbol; upper) and eigenvectors (lower; top 5 eigenvectors shown). Ellipses indicate 95% confidence intervals around the group center (large symbol). b Results of a generalized linear model regressing immune cell features with each disease group. Comparisons included MIS-C vs SBI and SVI combined (“rest”) as well as at an individual group level. The Benjamini-Hochberg method was used to adjust the two-sided p value for multiple testing; only comparisons with adjusted p < 0.05 have been shown. c Heatmap displaying immune cell features associated with disease group (b) with disease groups clustered as columns (Ward’s hierarchical clustering), and data scaled by row. Source data are provided as a Source Data file.
Fig. 3
Fig. 3. Multiplex cytokine assay results of cell stimulation assay supernatant.
Concentration (picog/ml) or fold change of IFN, IFNβ, IL6, TNF, and IP10 in acute (T1) and convalescent (T3) samples with (a), No stimulation, (b), SARS-CoV-2 antigen stimulation and (c), mitogen stimulation. Log10 transformed data are shown. Each point represents a participant for the following groups: multisystem inflammatory syndrome in children (MIS-C), severe bacterial illness (SBI), severe viral illness (SVI), Kawasaki disease (KD), other inflammatory disease (INF). Point shape corresponds to treatment received prior to blood sampling: ivig = intravenous immunoglobulin, steroid = corticosteroids, mab = monoclonal antibody. Two-sided Wilcoxon pairwise comparisons with Benjamini-Hochberg correction were performed; only significant p values are displayed. *=0.05, **=0.01, ***=0.001, ****=0.0001. Boxplots represent the median (horizontal line), first and third quartile boundary (box) and 1.5 times the inter-quartile range (whiskers). Source data are provided as a Source Data file.
Fig. 4
Fig. 4. Targeted analyses of immune cell data following cell stimulation assays.
Patients with multisystem inflammatory syndrome in children at timepoints 1 and 3 (MIS-C T1, n = 8; MIS-C T3, n = 6) and healthy pediatric controls (HPC, n = 3) were included. Heatmap of variables associated with (a), innate immunity and (b), the T cell immune response are summarized using an unsupervised hierarchical clustering model with cohort (disease group and timepoint) plotted on the x axis. Cells were measured in three states: no stimulation, stimulation with SARS-CoV-2 antigen and stimulation with mitogen. (c), Significant results from two-sided Wilcoxon pairwise comparisons are shown with unadjusted and adjusted (Benjamini–Hochberg) p values. Source data are provided as a Source Data file.
Fig. 5
Fig. 5. Whole blood gene expression counts generated by RNA-Seq.
Samples are from children with MIS-C (n = 38), bacterial infections (DB, n = 188), viral infections (DV, n = 138), Kawasaki disease (KD, n = 136), and healthy controls (HC, n = 134). Gene counts were normalized and log2-transformed. a Genes involved with formation of neutrophil extracellular traps (NETs). b Genes encoding FcγRI and FcγRIII. c Genes implicated in T cell exhaustion. d Genes associated with interferon signaling. Data shown are normalized to healthy pediatric controls for this cohort. Two-sided Wilcoxon pairwise comparisons with Benjamini Hochberg correction were performed; only significant p values are displayed. *=0.05, **=0.01, ***=0.001, ****=0.0001. Boxplots represent the median (horizontal line), first and third quartile boundary (box) and 1.5 times the inter-quartile range (whiskers) with all data points shown. Source data are provided as a Source Data file.

References

    1. Maslove, D. M. et al. Redefining critical illness. Nat. Med28, 1141–1148 (2022). - PubMed
    1. Singer, M. et al. The third international consensus definitions for sepsis and septic shock (Sepsis-3). JAMA315, 801–810, (2016). - PMC - PubMed
    1. Schlapbach, L. J. et al. International consensus criteria for pediatric sepsis and septic shock. JAMA331, 665–674, (2024). - PMC - PubMed
    1. Shankar-Hari, M. et al. Association between administration of IL-6 antagonists and mortality among patients hospitalized for COVID-19: a meta-analysis. Jama326, 499–518, (2021). - PMC - PubMed
    1. Lamontagne, F. et al. A living WHO guideline on drugs for covid-19. BMJ370, m3379 (2020). - PubMed

Publication types

MeSH terms

Supplementary concepts