

3D whole body preclinical micro-CT database of subcutaneous tumors in mice with annotations from 3 annotators
- PMID: 39300127
- PMCID: PMC11412993
- DOI: 10.1038/s41597-024-03814-y
3D whole body preclinical micro-CT database of subcutaneous tumors in mice with annotations from 3 annotators
Abstract
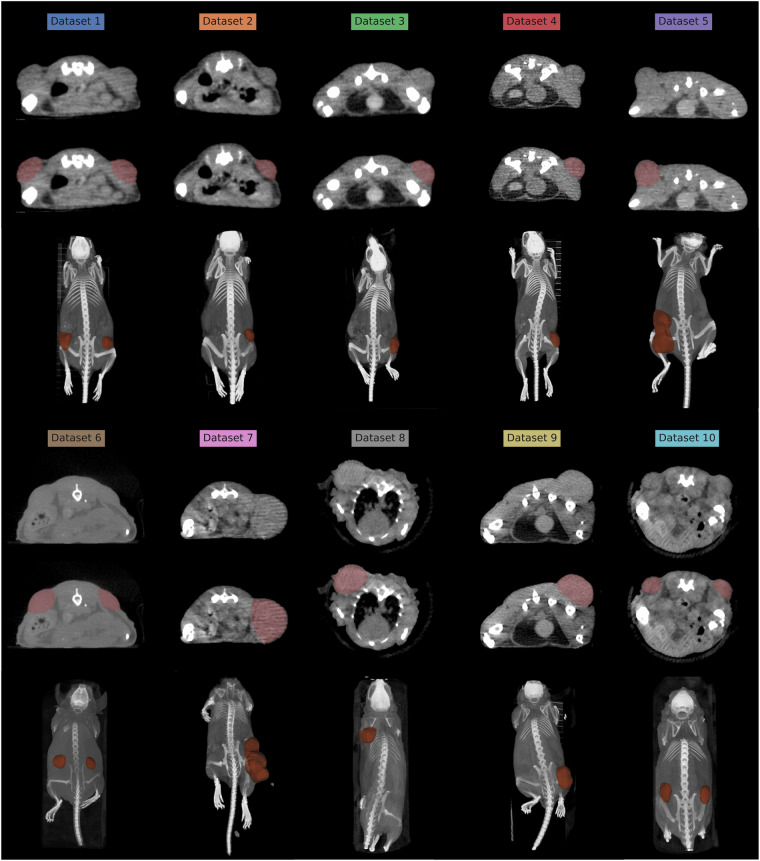
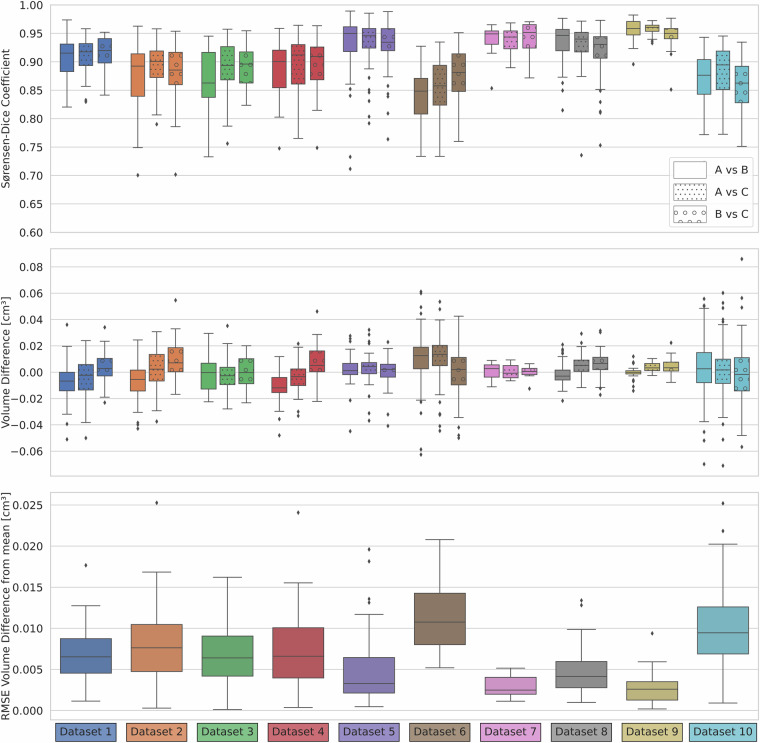
A pivotal animal model for development of anticancer molecules is mice with subcutaneous tumors, grown by injection of xenografted tumor cells, where micro-Computed Tomography (µCT) of the mice is used to analyze the efficacy of the anticancer molecule. Manual delineation of the tumor region is necessary for the analysis, which is time-consuming and inconsistent, highlighting the need for automatic segmentation (AS) tools. This study introduces a preclinical µCT database, comprising 452 whole-body scans from 223 individual mice with subcutaneous tumors, spanning ten diverse µCT datasets conducted between 2014 and 2020 on a preclinical PET/CT scanner, making it the hitherto largest dataset of its kind. Each tumor is annotated manually by three expert annotators, allowing for robust model development. Inter-annotator agreement was analyzed, and we report an overall annotation agreement of 0.903 ± 0.046 (mean ± std) Fleiss' Kappa and a mean deviation in volume estimation of 0.015 ± 0.010 cm3 (6.9% ± 4.7), which establishes a human baseline accuracy for delineation of subcutaneous tumors, while showing good inter-annotator agreement.
© 2024. The Author(s).
Conflict of interest statement
The authors declare no competing interests.
Figures
References
-
- Rosenthal, N. & Brown, S. The mouse ascending: Perspectives for human-disease models. Nature Cell Biology9, 993–999 (2007). - PubMed
-
- Perrin, S. Make mouse studies work. Nature507, 423–425 (2014). - PubMed
-
- James, M. L. & Gambhir, S. S. A molecular imaging primer: Modalities, imaging agents, and applications. Physiological Reviews92, 897–965 (2012). - PubMed
-
- Burch, R. & Russell, W. The Principles of Humane Experimental Technique by W.M.S. Russell and R.L. Burch. John Hopkins Bloomberg School of Public Health (1959).
Publication types
MeSH terms
Grants and funding
LinkOut - more resources
Full Text Sources
Research Materials
