. 2024 Sep 20;7(1):1185.
doi: 10.1038/s42003-024-06815-0.

The gut microbiota and its metabolite butyrate shape metabolism and antiviral immunity along the gut-lung axis in the chicken

Affiliations

The gut microbiota and its metabolite butyrate shape metabolism and antiviral immunity along the gut-lung axis in the chicken

Vincent Saint-Martin et al. Commun Biol. .

Abstract

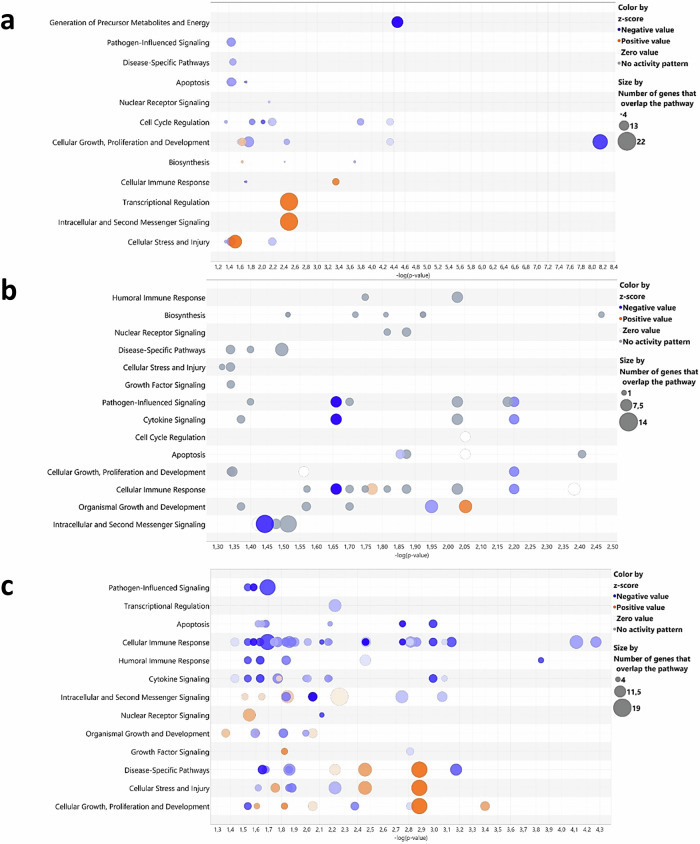
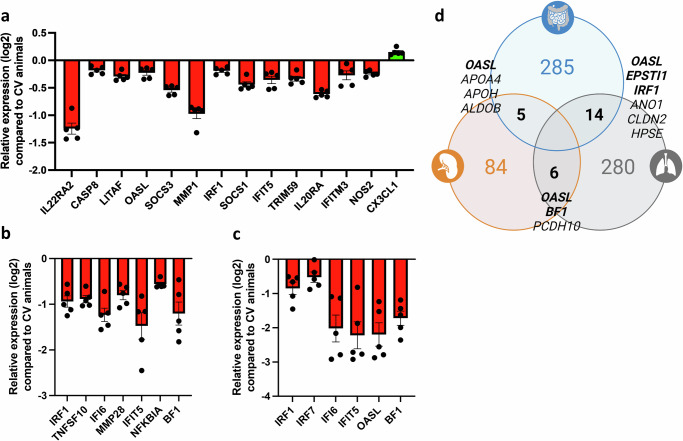
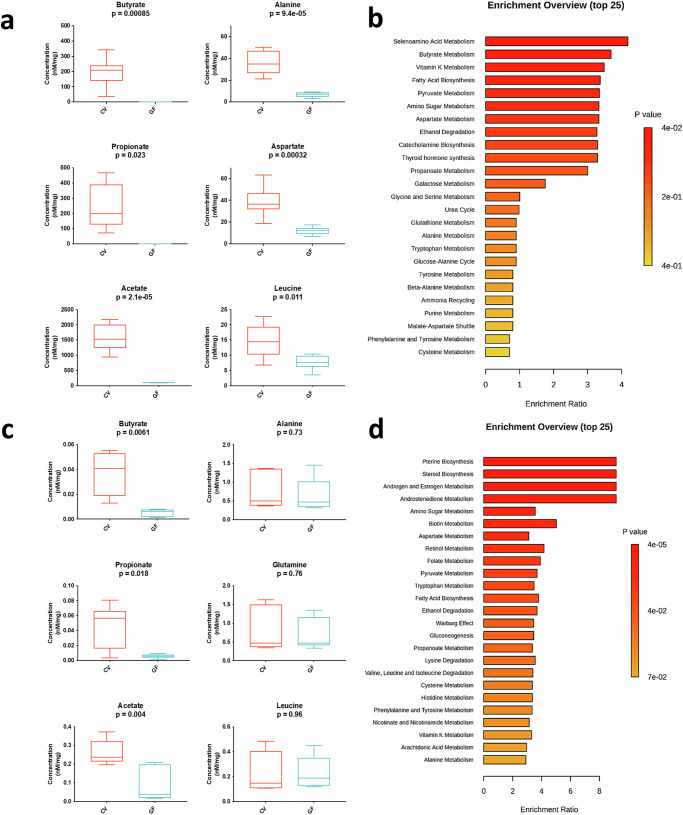
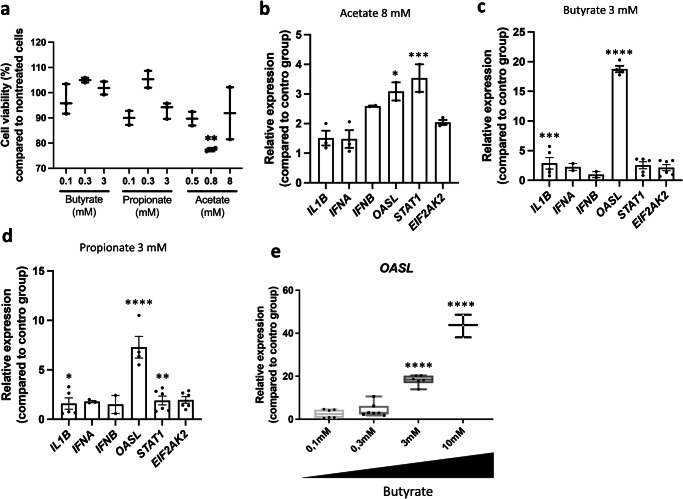
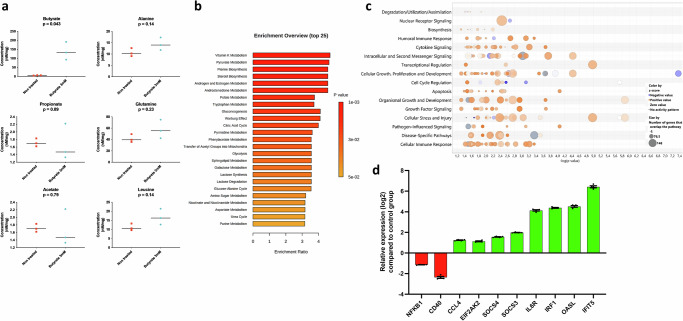
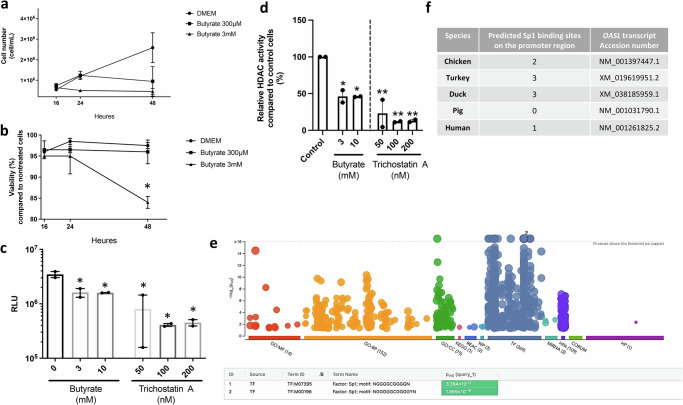
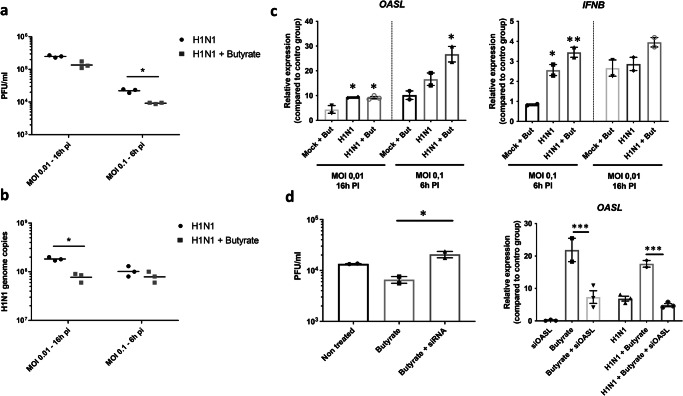
The gut microbiota exerts profound influence on poultry immunity and metabolism through mechanisms that yet need to be elucidated. Here we used conventional and germ-free chickens to explore the influence of the gut microbiota on transcriptomic and metabolic signatures along the gut-lung axis in poultry. Our results demonstrated a differential regulation of certain metabolites and genes associated with innate immunity and metabolism in peripheral tissues of germ-free birds. Furthermore, we evidenced the gut microbiota's capacity to regulate mucosal immunity in the chicken lung during avian influenza virus infection. Finally, by fine-analysing the antiviral pathways triggered by the short-chain fatty acid (SCFA) butyrate in chicken respiratory epithelial cells, we found that it regulates interferon-stimulated genes (ISGs), notably OASL, via the transcription factor Sp1. These findings emphasize the pivotal role of the gut microbiota and its metabolites in shaping homeostasis and immunity in poultry, offering crucial insights into the mechanisms governing the communication between the gut and lungs in birds.


Conflict of interest statement

The authors declare no competing interests.

Figures

Fig. 1
Fig. 1. The influence of the gut microbiota on gene expression profiles varies according to the tissue studied.
Differently expressed genes (DEG, padj < 0.05, log2 fold change ≥1) from RNAseq data from germ-free (GF) chickens, compared to conventionally raised (CV) chickens at 21 days post-hatch were analysed using Ingenuity Analysis Pathway software, visualised as a “bubble chart.” Circles in each row represent groups of genes associated with a biological function, with size indicating gene count and colour reflecting an intensity gradient ranging from overexpression (orange pattern) to downregulation (blue pattern) in GF chickens using CV chickens as the normalisation controls. The software enables tissue or cell selection and provides inferences on unrepresented genes. A confidence-boosting maximum adjusted p value threshold was applied: 0.45 for caeca (a), including the analyses of the top 244 genes from the caeca RNAseq analyses; 0.4 for lungs (b), including the analyses of the top 280 genes from the lungs RNAseq analyses; and 0.1 for spleen (c), including the analyses of the top 84 genes from the spleen RNAseq analyses. Each group comprised caeca, lungs or spleen samples from 5 GF chickens or 5 CV chickens (n = 5 biological replicates).
Fig. 2
Fig. 2. The absence of a gut microbiota results in the regulation of several immune-related genes along the gut-lung axis in the chicken.
Differently expressed genes (DEG, padj <0.05, log2 fold change ≥1) associated with immunity and inflammation were identified in the RNAseq analyses of caeca (a), lungs (b), and spleen (c) samples of 21 days-old chickens. This selection included standout genes coding for transcription factors, cytokines, enzymes and other molecules with broad functions in innate and adaptive immunity of vertebrates. Histograms present the relative expression of each gene in log2 format for germ-free (GF) animals compared to conventionally raised (CV) animals. A downregulation trend is particularly pronounced in the caeca and moderately in the spleen. In the lungs, contrasting regulatory phenomena with similar intensities coexist. d Certain DEGs identified using RNAseq analyses followed by an assessment through the Ingenuity Analysis Pathway software (in which a confidence-boosting maximum adjusted p value threshold was applied) are shared by the three organs studied. A Venn diagram illustrates DEG counts per organ, with caeca in blue, lungs in grey, and spleen in orange. Genes shared between organs, where available in the chicken genome, are annotated in the intersections. Immune-related genes, indicated in bold, reveal OASL as the sole immune-related gene significantly regulated in all three examined organs. Each group comprised caeca, lungs or spleen samples from 5 GF chickens or 5 CV chickens (n = 5 biological replicates). Data are represented as the mean ± SEM.
Fig. 3
Fig. 3. Germ-free chickens show an altered metabolic landscape along the gut-lung axis.
We used H1-NMR to analyse metabolite concentrations (nM/mg) in caecal contents (a) and lungs (c) of 21-day-old conventional (CV) and germ-free (GF) chickens. Metabolic pathway enrichments for caecal contents (b) and lungs (d) were determined using MetaboAnalyst. This tool identifies essential metabolic pathways (e.g., amino-acid metabolism, biosynthesis, catabolism) across organs. Ratios for each pathway were calculated as “number of metabolites in pathway X”/“Total number of metabolites in pathway X in the database,” and enrichment testing used the “globaltest” method, with resulting p values generating colour scales for the histograms. No prior transformations (normalisation, exclusion threshold) were applied to the presented data. Each group comprised caecal contents or lung samples from 6 GF chickens or 6 CV chickens (n = 6 biological replicates). Unpaired student’s t test was employed for statistical analyses (a, c). Data are represented as the mean ± SEM.
Fig. 4
Fig. 4. The transcriptional immune response to avian influenza infection in the chicken lung is profoundly regulated by the gut microbiota.
Germ-free (GF) animals infected via the tracheal route with a 5 × 105 EID50 dose of LPAIV H7N1 exhibited a disease profile indistinguishable from their conventional (CV) counterparts. Macroscopic lung lesion scores (haemorrhage, necrosis, oedema) (a) and viral genome copies in the lungs (b) or in the caeca (c) at Days 1–3 post-infection (p.i.) show no significant differences between the two groups. d Examination of infection kinetics in GF chickens’ lungs using Medium-Throughput qPCR (Fluidigm) indicates sustained expression of genes associated with inflammation (IL8L1, IL1B) and innate antiviral immunity (IFNA, IFNB, IRF7, and OASL – upper-right box) at Day 3 p.i. The heatmap illustrates relative expression levels in GF-infected animals compared to CV-infected animals on the same day. Each group comprised caeca or lungs samples from 5 mock and 8 infected GF chickens or 5 mock and 8 infected CV chickens (n = 5–8 biological replicates), depending on the time-point. a, c, d, each biological replicate is the mean of three technical replicates. Statistical analysis employed unpaired student’s t test (ac) or one-way ANOVA followed by Tukey multiple comparison test (d), where *p < 0.05 and ***p < 0.001. Data are represented as the median (ac) or the mean ± SEM (d, OASL expression).
Fig. 5
Fig. 5. Short-chain fatty acids elicit cellular and molecular responses in chicken lung epithelial cells.
The CLEC213 chicken lung epithelial cell line was treated with different concentrations of SCFA for 16 h. Cytotoxicity of butyrate, propionate, and acetate was assessed using a Spark® Cyto and expressed as the percentage of cell viability compared to untreated controls (a). qPCR analysis demonstrates that acetate (b), butyrate (c), and propionate (d) elicit different responses in terms of selected innate immune gene expression in CLEC213 cells. Notably, the induction of OASL by butyrate exhibits a concentration-dependent relationship (e). Statistical analysis was performed using One-way ANOVA followed by Tukey multiple comparison test, with significance levels indicated as follows: *p < 0.05, **p < 0.01, ***p < 0.005, ****p < 0.001. a, b, an n = 3 biological replicates is shown, in which each biological replicate is the mean of three technical replicates. ce an n = 5–7 biological replicates is shown, in which each biological replicate is the mean of three technical replicates. Data are represented as the mean ± SEM.
Fig. 6
Fig. 6. Butyrate regulates metabolic and transcriptional signatures in chicken lung epithelial cells.
CLEC213 chicken lung epithelial cells were treated with 3 mM butyrate for 16 h, resulting in an increase in metabolites associated with various biosynthetic pathways (tryptophan, glycogenesis, pyruvate), as analysed by H1-NMR (a). Statistical significance was assessed using unpaired student’s t test. b Metabolic pathway enrichment analysis, employing the “globaltest” method, revealed pathway ratios, with colour scales in histograms corresponding to p values. c Butyrate induced positive regulation across diverse biological functions in chicken lung epithelial cells, as depicted in a ‘bubble chart’ generated from RNAseq data analysis using Ingenuity Analysis Pathway software. Circles in each row represent groups of genes associated with a biological function, with size indicating gene count and colour reflecting an intensity gradient ranging from overexpression (orange pattern) to downregulation (blue pattern) in butyrate (3 mM) treated cells using untreated cells as the normalisation controls. A confidence-boosting maximum adjusted p value threshold of 045 was applied. d The log2 relative expression of a group of selected immune-related genes extracted from all DEG from RNAseq data (padj < 0.05, log2 fold change ≥1) in cells receiving butyrate (3 mM) compared to untreated cells at 16 h. a, b an n = 3 biological replicates is shown, while in c, d an n = 6 biological replicates. Data in a are represented as the median. Data in d are represented as the mean ± SEM.
Fig. 7
Fig. 7. Butyrate possess HDACi functions and strongly regulates Sp1 in chicken respiratory epithelial cells.
Incubation of CLEC213 cells with 0.3 and 3 mM of butyrate for 16 hours resulted in reduced cell counts (per ml) (a) with no major impact on cell viability (b), as assessed using a Spark® Cyto and expressed as the percentage of cell viability compared to untreated controls. c The exposure of CLEC213 cells to 3 mM of butyrate for 16 hours led to diminished histone deacetylase (HDAC) activity as assessed using the HDAC-Glo I/II assay. Data are presented as luminescence ratio (RLU) (c) or as the percentage relative to the control group (d), with decreased luminescence indicating HDAC inhibition. Trichostatin A (50–200 nM) was used as a positive control. e Gene ontology enrichment analysis in butyrate-treated cells (3 mM for 16 h) reveals a significant enrichment (green box) of two Sp1 transcription factor motifs among the top 1000 differentially expressed genes obtained through RNAseq (padj < 0.05, log2 fold change ≥1). Enrichment analysis originally used g:profiler for molecular function, biological processes, cellular components, various databases, and transcription factors. f Identification of potential binding sites for Sp1 in the OASL promoter of selected bird and mammalian species. One-way ANOVA followed by Tukey multiple comparison tests (ad) was employed for statistical analyses, where *p < 0.05, **p < 0.01. a, b an n = 3 biological replicates are shown. c, d an n = 3 biological replicates is shown, in which each biological replicate is the mean of three technical replicates. Data in e are representative of an n = 6 biological replicates. Data are represented as the mean ± SEM.
Fig. 8
Fig. 8. Butyrate enhances viral clearance in chicken lung epithelial cells upon infection with a low-pathogenicity H1N1 avian influenza strain via increased type I IFN/ISG responses.
Butyrate treatment (3 mM) improves viral clearance in CLEC213 cells infected with an LPAIV H1N1 avian influenza strain. Incubation with butyrate prior to infection (MOI 0.1 for 6 hours or MOI 0.01 for 16 hours) significantly reduces viral titre (PFU/ml) (a) and genomic copies (b) compared to untreated cells. Additionally, qPCR analysis showed increased expression of IFNB and OASL in butyrate-treated infected cells (c). Silencing OASL expression abolishes butyrate’s antiviral effects, resulting in infectious titre identical to untreated cells, concomitantly with reduced OASL expression (d). Unpaired student’s t test (a, b) and One-way ANOVA followed by Tukey multiple comparison test (c, d) were employed for statistical analyses, where p < 0.05, **p < 0.01, ***p < 0.001. a an n = 3 biological replicates are shown. bd an n = 3 biological replicates is shown, in which each biological replicate is the mean of three technical replicates. a, b are represented as the median. Data in c, d are represented as the mean ± SEM.

References

    1. Thaiss, C. A., Zmora, N., Levy, M. & Elinav, E. The microbiome and innate immunity. Nature535, 65–74 (2016). - PubMed
    1. Rowland, I. et al. Gut microbiota functions: metabolism of nutrients and other food components. Eur. J. Nutr.57, 1–24 (2018). - PMC - PubMed
    1. Willing, B. P., Russell, S. L. & Finlay, B. B. Shifting the balance: antibiotic effects on host–microbiota mutualism. Nat. Rev. Microbiol.9, 233–243 (2011). - PubMed
    1. Koh, A., De Vadder, F., Kovatcheva-Datchary, P. & Bäckhed, F. From dietary fiber to host physiology: short-chain fatty acids as key bacterial metabolites. Cell165, 1332–1345 (2016). - PubMed
    1. Fachi, J. L. et al. Butyrate protects mice from clostridium difficile-induced colitis through an HIF-1-dependent mechanism. Cell Rep.27, 750–761.e7 (2019). - PubMed

Publication types

LinkOut - more resources