. 2025 Feb;32(2):300-314.
doi: 10.1038/s41594-024-01395-3. Epub 2024 Sep 19.

Catalytic and noncatalytic functions of DNA polymerase κ in translesion DNA synthesis

Affiliations

Catalytic and noncatalytic functions of DNA polymerase κ in translesion DNA synthesis

Selene Sellés-Baiget et al. Nat Struct Mol Biol. 2025 Feb.

Abstract

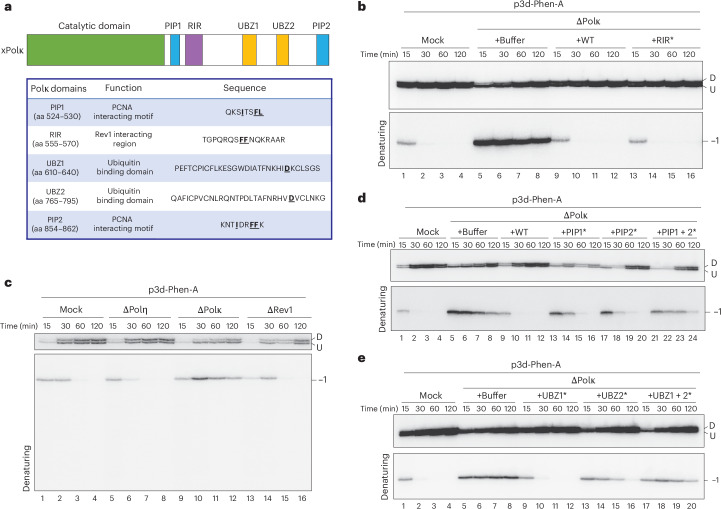
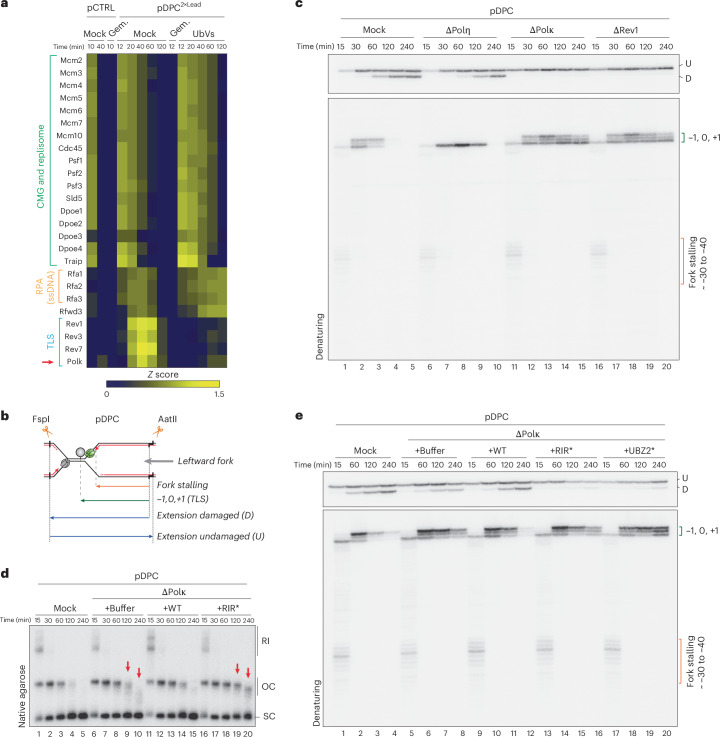
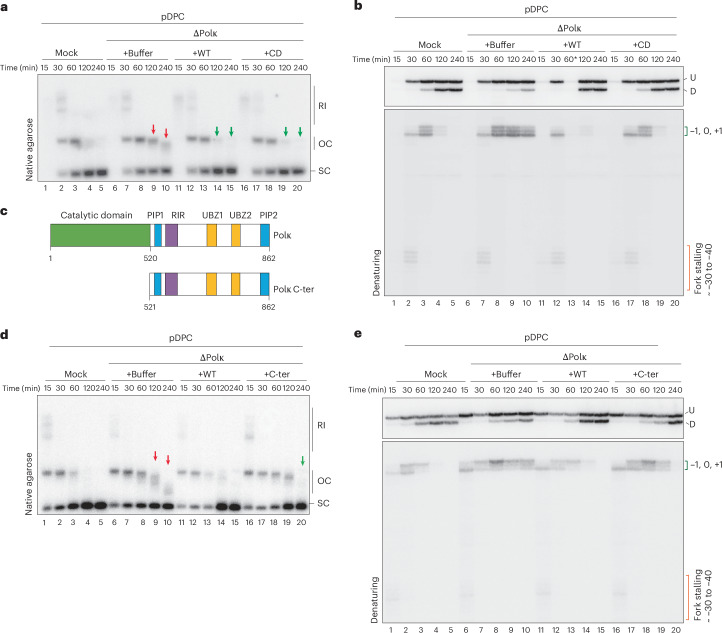
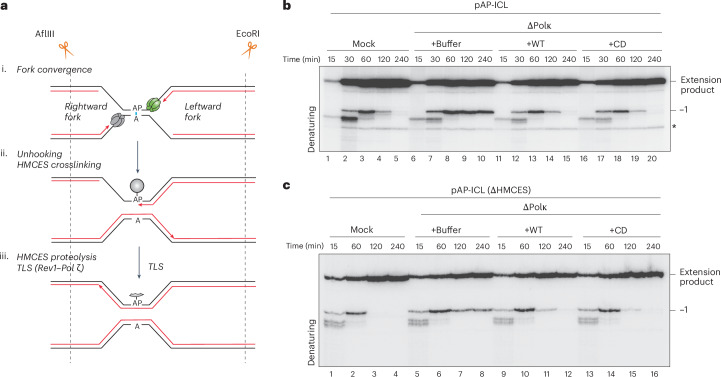
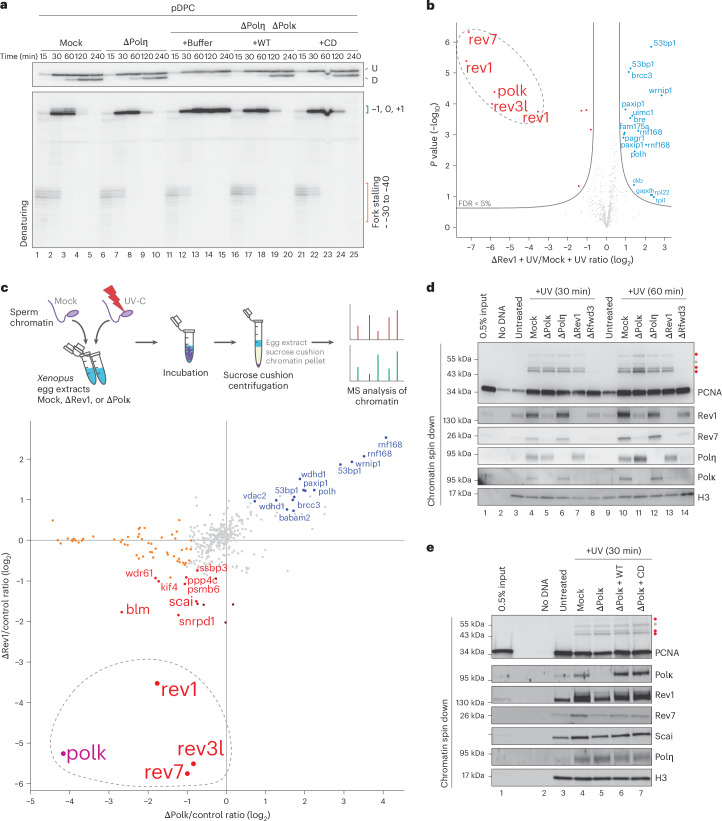
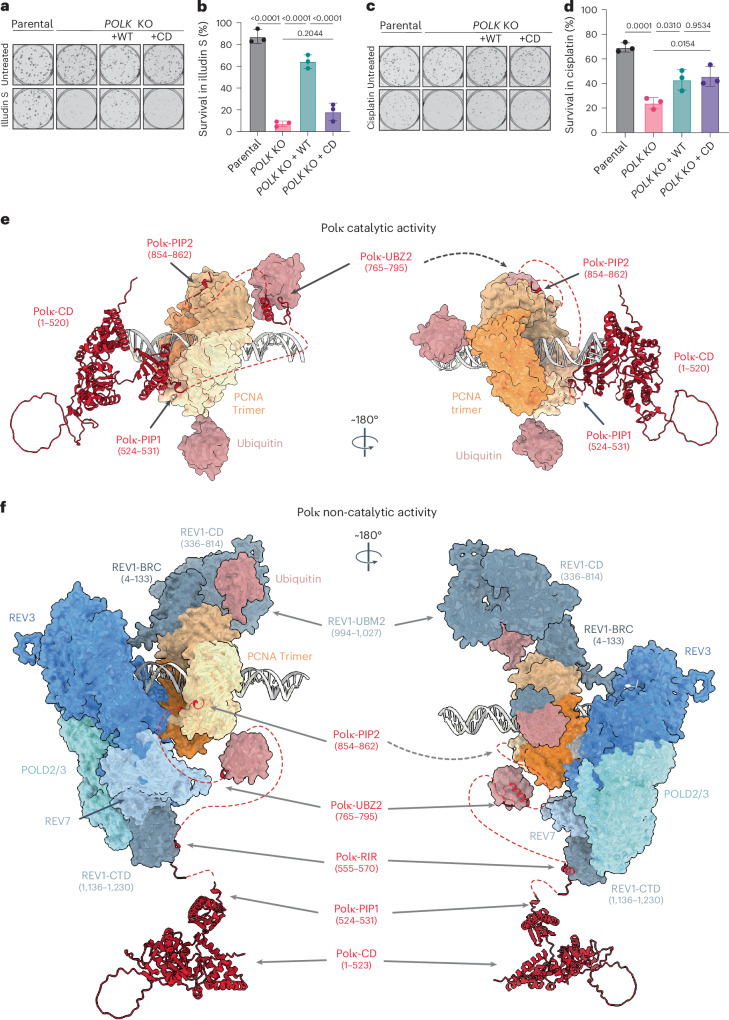
Translesion DNA synthesis (TLS) is a cellular process that enables the bypass of DNA lesions encountered during DNA replication and is emerging as a primary target of chemotherapy. Among vertebrate DNA polymerases, polymerase κ (Polκ) has the distinctive ability to bypass minor groove DNA adducts in vitro. However, Polκ is also required for cells to overcome major groove DNA adducts but the basis of this requirement is unclear. Here, we combine CRISPR base-editor screening technology in human cells with TLS analysis of defined DNA lesions in Xenopus egg extracts to unravel the functions and regulations of Polκ during lesion bypass. Strikingly, we show that Polκ has two main functions during TLS, which are differentially regulated by Rev1 binding. On the one hand, Polκ is essential to replicate across a minor groove DNA lesion in a process that depends on PCNA ubiquitylation but is independent of Rev1. On the other hand, through its cooperative interaction with Rev1 and ubiquitylated PCNA, Polκ appears to stabilize the Rev1-Polζ extension complex on DNA to allow extension past major groove DNA lesions and abasic sites, in a process that is independent of Polκ's catalytic activity. Together, our work identifies catalytic and noncatalytic functions of Polκ in TLS and reveals important regulatory mechanisms underlying the unique domain architecture present at the C-terminal end of Y-family TLS polymerases.


Conflict of interest statement

Competing interests: The authors declare no competing interests.

Figures

Fig. 1
Fig. 1. Polκ is essential to bypass minor groove DNA lesions.
a, Schematic outline of a Polκ CRISPR base-editor tiling screen aimed at identifying missense mutations that sensitize RPE1-hTERT p53−/− cells to illudin S. NGS, next-generation sequencing. b, Dot plot showing the results of the Polκ CRISPR base-editor tiling screen. Each guide is shown as a dot. The x axis represents the amino acid position in Polκ that is targeted for point substitution. The y axis represents the log2(fold change) between illudin S and untreated conditions. Larger dots represent guides that significantly change in illudin S (P value ≤ 0.01). The various domains of Polκ are indicated. c, Composite molecular model of human Polκ with the predicted point substitutions (in red) derived from the base-editor tiling screen that sensitized cells to illudin S treatment. Dashed lines represent disordered regions that are not present in the model. The model was generated by combining structure predictions from AlphaPulldown and AlphaFold2 (ref. ), as described in the Methods, along with deposited structures of human Polκ and PCNA (PDB 5W2C (ref. ), PDB 6TNY (ref. ) and PDB 3TBL (ref. )). d, Left, schematic of p3d-Phen-A. Right, scheme displaying the leftward nascent leading strand and extension products during replication of p3d-Phen-A generated upon HaeII and HindIII digest. Double digestion generates longer damaged and shorter undamaged extension products, which can be resolved on a denaturing polyacrylamide gel. The leftward CMG helicase is depicted in green, while the minor groove adduct is depicted in blue. e, p3d-Phen-A was replicated in the presence or absence of a ubiquitin E1 inhibitor (MLN-7243). Reaction samples were digested with HaeII and HindIII followed by separation on a denaturing polyacrylamide gel alongside a sequencing ladder. The stalling points position in relationship to the minor groove adduct are shown in the lower radiograph. The upper radiograph shows the extension products; note that ~70% of the plasmid preparation contains the adduct. f, Polκ-depleted extracts were compared to a mock depletion dilution series. Polκ-depleted extracts were supplemented with buffer, WT Polκ or CD Polκ. Samples were blotted with the indicated antibodies. The asterisk denotes a nonspecific band. g, Schematic diagram illustrating the replication intermediates generated during the replication of p3d-Phen-A. h, Samples from f were used to replicate p3d-Phen-A in the presence of [α-32P]dATP. Reaction samples were analyzed by native agarose gel electrophoresis. RI, replication intermediate. Red arrowheads indicate the accumulation of OC molecules. Note that accumulated OC molecules undergo 5′-to-3′ resection over time, leading to faster migration on the gel. i, Samples from h were digested with HaeII and HindIII analyzed as in e. Source Data
Fig. 2
Fig. 2. Polκ-mediated bypass of minor groove lesions is independent of Rev1.
a, Overview of Xenopus Polκ and the specific point mutants used in this study. The underlined amino acids within each domain sequence were substituted to alanine. b, Mock and Polκ-depleted egg extracts were used to replicate p3d-Phen-A. Polκ-depleted extracts were supplemented with buffer, recombinant WT Polκ or RIR* mutant Polκ. Samples were digested and analyzed as in Fig. 1e. c, p3d-Phen-A was replicated in mock, Polη-depleted, Polκ-depleted or Rev1-depleted extracts. Samples were digested and analyzed as in Fig. 1e. d, Mock and Polκ-depleted egg extracts were supplemented with buffer, recombinant WT Polκ or PIP1, PIP2 or PIP1 and PIP2 mutant Polκ. Extracts were then used to replicate p3d-Phen-A. Samples were digested and analyzed as in Fig. 1e. e, Mock and Polκ-depleted egg extracts were supplemented with buffer or UBZ1, UBZ2 or UBZ1 and UBZ2 mutant Polκ. Extracts were then used to replicate p3d-Phen-A. Samples were digested and analyzed as in Fig. 1e. Source Data
Fig. 3
Fig. 3. Polκ’s RIR is required for the bypass of a major groove DPC lesion.
a, Heat map displaying the mean of the z-scored log2(LFQ intensity) obtained from four biochemical replicates of pCTRL and pDPC2×Lead. Geminin was added to block DNA replication where indicated. Ubiquitin-vinyl sulfone (UbVS) was added where indicated to block ubiquitin recycling and deplete the pool of free ubiquitin from the extracts. These data were originally published in a previous study. b, Scheme displaying the nascent leading strand and extension products generated upon FspI and AatII digestion of pDPC. Double digestion generates shorter damaged and longer undamaged extension products, which can be resolved on a denaturing polyacrylamide gel. The CMG helicase is depicted in green, while the crosslinked M.HpaII is depicted in gray. c, pDPC was replicated in egg extracts in mock, Polη-depleted, Polκ-depleted or Rev1-depleted extracts. Reaction samples were digested with FspI and AatII, followed by separation on a denaturing polyacrylamide gel. The stalling points position in relationship to the DPC are shown in the lower radiograph. The upper radiograph shows the extension products. d, Mock and Polκ-depleted egg extracts were used to replicate pDPC. Polκ-depleted extracts were supplemented with buffer, WT Polκ or RIR mutant Polκ. Samples were analyzed as in Fig. 1h. e, Mock and Polκ-depleted egg extracts were used to replicate pDPC. Polκ-depleted extracts were supplemented with buffer, WT Polκ or RIR or UBZ2 mutant Polκ. Samples were analyzed as in c. Source Data
Fig. 4
Fig. 4. Polκ has a noncatalytic function that stimulates Rev1–Polζ-mediated extension across major groove DPC lesions.
a, Mock and Polκ-depleted egg extracts were used to replicate pDPC. Polκ-depleted extracts were supplemented with buffer, WT Polκ or CD Polκ. Samples were analyzed as in Fig. 1h. b, Samples from a were digested with FspI and AatII and separated on a denaturing polyacrylamide gel. Samples were analyzed as in Fig. 3c. The asterisk denotes a sample that was partially lost during DNA extraction (lane 13). c, Schematic of X.laevis Polκ showing the domain architecture of WT Polκ and Polκ C-ter. d, Polκ-depleted extracts were supplemented with buffer, WT Polκ or Polκ C-ter. Samples were analyzed as in Fig. 1h. e, Samples from d were digested with FspI and AatII and separated on a denaturing polyacrylamide gel. Samples were analyzed as in Fig. 3c. Source Data
Fig. 5
Fig. 5. Polκ’s noncatalytic function stimulates HMCES DPC and AP site bypass.
a, Schematic of HMCES DPC formation and proteolysis during replication-coupled AP-ICL repair,. AflIII and EcoRI allow visualization of stalling points positions relative to the AP-ICL site of the leftward-moving fork. b, Mock and Polκ-depleted egg extracts were used to replicate pAP-ICL. Polκ-depleted extracts were supplemented with buffer, WT Polκ or CD Polκ. Samples were subsequently digested with AflIII and EcoRI, followed by separation on a denaturing polyacrylamide gel. Extension products and stalling points position in relationship to the AP-ICL are indicated on the right side of the gel. The asterisk indicates a nonspecific digestion product. c, HMCES-depleted extracts were further mock-treated or Polκ-depleted and used to replicate pAP-ICL. Polκ-depleted extracts were supplemented with buffer, WT Polκ or CD Polκ. The samples were analyzed as in b. Source Data
Fig. 6
Fig. 6. Polκ and Rev1–Polζ form a stable complex on damaged DNA.
a, Mock, Polη-depleted or Polη-depleted and Polκ-depleted egg extracts were used to replicate pDPC. Polκ-depleted extracts were supplemented with buffer, WT Polκ or CD Polκ. Samples were subsequently digested with FspI and AatII and analyzed as in Fig. 3c. b, CHROMASS analysis of protein recruitment to UV-treated sperm chromatin in mock or Rev1-depleted extracts. Note that this experiment was performed in the absence of DNA replication. The volcano plot illustrates the difference in abundance of proteins between the two sample conditions (x axis), plotted against the P value resulting from two-tailed Student’s two-sample t-testing (y axis). Proteins significantly downregulated or upregulated (FDR < 5%) in Rev1-depleted reactions are represented in red or blue, respectively (n = 4 biochemical replicates). FDR < 5% corresponds to a q value < 0.05. Different isoforms of the same protein can be detected (for example, Rev1). These data were originally published in a previous study. c, Top, schematic of CHROMASS. Bottom, graph illustrating protein recruitment to UV-treated sperm chromatin in the presence or absence of Rev1 or Polκ, as determined by CHROMASS analysis (Supplementary Table 2). This experiment was performed in the absence of DNA replication. Red dots (bottom-left quadrant) indicate the proteins that were significantly de-enriched on sperm chromatin in the absence of Rev1 and Polκ. Blue dots (top-right quadrant) indicate the proteins that were significantly enriched on sperm chromatin in the absence of Rev1 and Polκ. Orange dots indicate the proteins that were significantly de-enriched on sperm chromatin in the absence of Polκ (n = 4 biochemical and n = 8 technical replicates; significance was determined by two-tailed Student’s two-sample t-testing, with a permutation-based FDR control (s0 = 0.5) to ensure a q value < 0.05. Note that different isoforms of the same protein can sometimes be detected. d, Sperm chromatin was either untreated or treated with 2,000 J m−2 of UV-C and then added to nonreplicating mock, Polη-depleted, Polκ-depleted, Rev1-depleted or Rfwd3-depleted extracts. Chromatin was isolated and the associated proteins were blotted with the indicated antibodies. Red dots correspond to PCNA ubiquitylation (monoubiquitin, diubiquitin and triubiquitin); the gray dot corresponds to monosumoylated PCNA. e, Sperm chromatin was either untreated or treated with 2,000 J m−2 of UV-C and added to nonreplicating Polκ-depleted extracts. Polκ-depleted extracts were supplemented with buffer, WT Polκ or CD Polκ. Chromatin was isolated and the associated proteins were blotted with the indicated antibodies as in d. Source Data
Fig. 7
Fig. 7. Molecular models of Polκ’s catalytic and noncatalytic functions during TLS.
a,b, Colony formation assay with illudin S. U2OS parental cells, POLK-KO cells and POLK-KO cells stably expressing Venus–WT Polκ or Venus–CD Polκ were seeded at low density and cells expressing Venus–WT Polκ or Venus–CD Polκ were induced with 20 ng ml−1 doxycycline. Cells were grown in the presence or absence of 31.25 pg ml−1 illudin S and formed colonies were stained and quantified. Examples of images (a) and quantification (b) are shown. The survival in illudin S represents the average number of colonies at 31.25 pg ml−1 illudin S normalized to the untreated condition. Individual data points, means and s.d. values from three independent experiments are plotted. One-way ANOVA with Tukey’s multiple-comparisons test was performed and P values for the indicated comparisons are shown. c,d, Colony formation assay with cisplatin. Examples of images (c) and quantification (d) of a colony formation assay performed as in a,b but treated with 1 μM cisplatin. e,f, Composite molecular models of the catalytic (e) and noncatalytic (f) functions of Polκ during TLS. Models were generated by combining structure predictions from AlphaPulldown and AlphaFold2 (ref. ), as described in the Methods. During its catalytic function (e), Polκ can interact with PCNA monomers through its PIP1 or PIP2 domains, bringing its catalytic domain into close proximity with the DNA substrate. The long flexible Polκ C-terminal region additionally allows Polκ to interact with a monoubiquitinated PCNA through its UBZ2 domain. During its noncatalytic function (f), Polκ can bind Rev1 through its RIR domain; the UBZ2 and PIP2 domains are able to bind to monoubiquitinated PCNA thanks to the long flexible Polκ C-terminal region. Notably, whilst the Polκ RIR domain is bound to Rev1, the PIP1 domain is positioned such that it would be unable to interact with monoubiquitylated PCNA. Note that the existence of a Rev1–Polζ–Polκ complex is inferred from a previous study and data presented in this manuscript. Source Data
Extended Data Fig. 1
a) Dot plot showing the results of the Polκ CRISPR base editor tiling screen comparing t0 and t18 of the untreated condition. Each guide is shown as a dot. X-axis represents amino acid position in Polκ. Y-axis represents Log2 fold changes between t18 and t0 of the untreated condition. Larger dots represent guides which are significantly changing between the two conditions (p-value ≤ 0.01). The various domains of Polκ are indicated. The significance and fold change was derived from limma (see Methods) b) Composite molecular model of human Polκ. Dashed lines represent disordered regions that are not present in the model. The model was generated as described in Fig. 1c. c) Composite molecular model of human Polκ with point mutations derived from the base editor tiling screen. Dashed lines represent disordered regions that are not present in the model. Point mutations are highlighted in red. The left panel is a duplicate of Fig. 1c. d) pCTRL and p3d-Phen-A were replicated in the presence or absence of ubiquitin E1 inhibitor. Reaction samples were analyzed as in Fig. 1h. e) Schematic diagram illustrating the replication intermediates generated during the replication of p3d-Phen-A. f) Western blot of the immunoprecipitation of Polκ using our generated Xenopus Polκ antibody. Sup., supernatant; IP, immunoprecipitation. Polκ #1 and Polκ #2 denotes two different affinity purifications generated from the same rabbits. g) Coomassie blue staining of recombinant Polκ WT and Polκ CD purified from E.coli. * denotes a contaminant not recognized by the anti-HIS antibody (right immunoblot). h) Schematic representation of gap filling synthesis (left scheme) when pDPCssDNA is incubated with Polκ WT, Polκ CD, or whole egg cytosolic egg extract (HSS) in the presence of [α-32P]dATP. Note the absence of DNA synthesis in the Polκ CD reaction (lanes 6-9). Source Data
Extended Data Fig. 2
a) Polκ-depleted extracts were supplemented with either buffer (+Buffer), wild-type Polκ (+WT), or RIR (RIR*) Polκ mutant. Samples were blotted with the indicated antibodies (top immunoblots). To ensure that the same amount of protein was added back to the extracts, the different Polκ preparations used in this study were titrated, and equal amounts were confirmed via immunoblotting (via HIS antibody, bottom immunoblot). 1x corresponds to the amount needed to add back roughly endogenous levels of Polκ (when added to 10% F.C in NPE). We unfortunately lack the Coomassie stain of various mutants. b) Extracts from (A) were used to replicate p3d-Phen-A. Samples were analyzed as in Fig. 1h. c) Polκ-depleted extracts were supplemented with either buffer (+Buffer), wild-type Polκ (+WT), PIP1 (PIP1*), PIP2 (PIP2*) or PIP1 and PIP2 (PIP1 + 2*) Polκ mutants. Samples were blotted with the indicated antibodies. Note that the Polκ antibody was generated against Polκ C-terminal end which encompasses PIP2. This antibody exhibits lower affinity for Polκ PIP2* compared to Polκ WT and Polκ PIP1*. The 6xHis tag of the recombinant protein is located on the N-terminal end. d) Extracts from (C) were used to replicate p3d-Phen-A. Samples were analyzed as in Fig. 1h. e) Polκ-depleted extracts were supplemented with either buffer (+Buffer), wild-type Polκ (+WT), UBZ (UBZ1*), UBZ (UBZ2*) or UBZ1 and UBZ2 (UBZ1 + 2*) Polκ mutants. Samples were blotted with the indicated antibodies. f) Extracts from (E) were used to replicate 3d-Phen-A. Samples were analyzed as in Fig. 1h. Source Data
Extended Data Fig. 3
a) Replication intermediates generated during replication of pDPC. b) Mock-, Polη-, Polκ-, Rev1-, or Rev3-depleted extracts were blotted with the indicated antibodies. c) pDPC was replicated in egg extracts in mock-, Polη-, Polκ-, or Rev1-depleted extracts. Reaction samples were analyzed as in Fig. 1h. d) pDPC was replicated in Polκ- or Rev1-, or Rev3-depleted egg extracts. Samples were digested, separated on a denaturing polyacrylamide gel and analyzed as in Fig. 3c. Source Data
Extended Data Fig. 4
a) Generation of pDPCPK. b) Mock- and Polκ-depleted egg extracts were used to replicate pDPCPK. Polκ-depleted extracts were supplemented with either buffer (+Buffer), wild-type (+WT), or catalytically inactive (+CD) Polκ. Samples were analyzed as in Fig. 1h. c) Samples from (B) were digested and analyzed as in Fig. 3c. d) pDPCLead was replicated in either mock- or Polκ-depleted egg extracts in the presence of LacI. Polκ-depleted extracts were supplemented with either buffer (+Buffer), wild-type Polκ (+WT), or catalytically inactive Polκ (+CD). Samples were digested with AatII, separated on a denaturing polyacrylamide gel and analyzed as in Fig. 3c. e) Extracts from (D) were used to replicate pDPCLag. Samples were digested with BssHII, separated on a denaturing polyacrylamide gel and analyzed as in Fig. 3c. f) Polκ-depleted egg extracts were supplemented with either buffer (+Buffer), recombinant PIP1 (+PIP1*), PIP2 (+PIP2*) or PIP1 and PIP2 (PIP1 + 2*) Polκ mutants. Extracts were then used to replicate pDPC. Samples were digested and analyzed as in Fig. 3c. g) Polκ-depleted egg extracts were supplemented with either buffer (+Buffer), UBZ1(+UBZ1*), UBZ2 (+UBZ2*), or UBZ1 and UBZ2 (+UBZ1 + 2*) Polκ mutants. Extracts were then used to replicate pDPC. Samples were analyzed as in Fig. 3c. Source Data
Extended Data Fig. 5
a) Mock- and Polκ-depleted egg extracts were used to replicate pAP-ICL. Polκ-depleted extracts were supplemented with either buffer (+Buffer), wild-type Polκ (+WT), or catalytically inactive Polκ (+CD). The samples were analyzed as in Fig. 1h. b) Western blot of the immunoprecipitation of HMCES. Sup., supernatant; IP, immunoprecipitation. c) Mock- and HMCES-extracts were blotted with the indicated antibodies. * indicates a non-specific band. d) HMCES-depleted extracts were either mock- or Polκ-depleted and were subsequently used to replicate pAP-ICL. Polκ-depleted extracts were supplemented with either buffer (+Buffer), wild-type Polκ (+WT), or catalytically inactive Polκ (+CD). The samples were analyzed as in Fig. 1h. Source Data
Extended Data Fig. 6
a) Mock-, Polη-, or double Polη- and Polκ-depleted egg extracts were used to replicate pDPC. Polκ-depleted extracts were supplemented with either buffer (+Buffer), wild-type Polκ (+WT), or catalytically inactive Polκ (+CD). Samples were analyzed as in Fig. 1h. b) MS analysis of protein recruitment to UV-treated compared to untreated sperm chromatin. The volcano plot shows the difference in abundance of proteins between the two sample conditions (x-axis), plotted against the p-value resulting from two- tailed Student’s two-sample t-testing (y-axis). Proteins significantly down- or up-regulated (FDR < 5%) upon UV treatment are represented in red or blue, respectively. TLS polymerases are highlighted in orange. n = 4 biochemical and n = 8 technical replicates, significance was determined via two-tailed Student’s two-sample t-testing, with permutation-based FDR control (s0 = 0.5) to ensure an adjusted p-value (that is q-value) of <0.05 in all cases. The significance line is drawn at q = 0.01. c) Same experiment as in (B) but comparing mock- to Rev1-depleted extracts. Small red dots, 1% < FDR < 5%; large red dots, FDR < 1%. Polκ and Rev1 are highlighted in purple and black, respectively. d) Same experiment as in (B) but comparing mock- to Polκ-depleted extracts. Small red dots, 1% < FDR < 5%; large red dots, FDR < 1%. Polκ and Rev1 are highlighted in purple and black, respectively. e) Western blot of FancA immunoprecipiates. Sup., supernatant; IP, immunoprecipitation. FancA #1 and was used to validate that our FancA antibody (FancA #2) immunoprecipitates the same protein. f) Western blot of the co-immunoprecipitation of Polκ with FancA. Sup., supernatant; IP, immunoprecipitation. g) Sperm chromatin was either untreated or treated with 20 J/m2 of UV-C and then added to replicating mock-, Polκ- or Rev1-depleted extracts. Chromatin samples of duplicated reactions were isolated at 60 min, and the proteins associated were blotted with the indicated antibodies. h) pDPC was replicated in either mock, Polκ or Rev1-depleted extracts. Reactions were subjected to plasmid pull-down and samples were blotted with the indicated antibodies. i) p3d-Phen-A was replicated in either mock or Polκ-depleted extracts. Reactions were subjected to plasmid pull-down and samples were blotted with the indicated antibodies. Source Data
Extended Data Fig. 7
a) Knockout of POLK in U2OS cells was validated by qPCR. Bar graphs represent POLK mRNA (cDNA) expression levels relative to WT parental cells (E1) and normalised to GAPDH expression levels. Error bars represent standard deviation from the mean of a technical triplicate PCR reaction (one representative experiment of two biological replicates is shown). Clones 1.10 was selected for further studies. b) Western blot analysis of whole cell extracts of the indicated cell lines treated with doxycycline where indicated. Note that we were unable to detect endogenous Polκ with three independent antibodies that were tested (A301-975A (Bethyl); A301-977A (Bethyl); sc-166667 (Santa Cruz). * indicates a non-specific band. c) AlphaPulldown predictions of protein complexes were utilised to construct the composite molecular models presented in Fig. 7. Each panel is divided into three sections: The upper panel displays the Predicted Aligned Error (PAE) plots associated with specific protein/fragment combinations generated by AlphaPulldown. The PAE score in AlphaFold estimates the distance errors for residue pairs. It is represented by plots composed by diagonal squares for inner-correlation and cross-correlation areas for protein/fragment interactions. They assess prediction confidence, with low values being reliable and high values unreliable. The middle panel shows the predicted structures. Lastly, the lower panel includes the names of the predicted protein combinations, along with their corresponding Interface Predicted Template Modelling (IPTM), the Predicted Template Modelling (PTM) scores and the Ranking of the model (R0). d) Summary tables featuring the protein structures used as scaffolds for model building, along with their respective PDB codes. Single protein predictions obtained from AlphaPulldown with related Predicted Local Distance Difference Test scores (pLDDT). Uniprot accession codes for each of the proteins used for the complex protein modelling. Source Data

References

    1. Ling, H., Boudsocq, F., Woodgate, R. & Yang, W. Crystal structure of a Y-family DNA polymerase in action: a mechanism for error-prone and lesion-bypass replication. Cell107, 91–102 (2001). - PubMed
    1. Goodman, M. F. & Woodgate, R. Translesion DNA polymerases. Cold Spring Harb. Perspect. Biol.5, a010363 (2013). - PMC - PubMed
    1. Cortez, D. Replication-coupled DNA repair. Mol. Cell74, 866–876 (2019). - PMC - PubMed
    1. Saldivar, J. C., Cortez, D. & Cimprich, K. A. The essential kinase ATR: ensuring faithful duplication of a challenging genome. Nat. Rev. Mol. Cell Biol.18, 622–636 (2017). - PMC - PubMed
    1. Friedberg, E. C., Wagner, R. & Radman, M. Specialized DNA polymerases, cellular survival, and the genesis of mutations. Science296, 1627–1630 (2002). - PubMed

LinkOut - more resources