. 2025 Apr;21(4):522-531.
doi: 10.1038/s41589-024-01726-x. Epub 2024 Sep 19.

A tRNA modification with aminovaleramide facilitates AUA decoding in protein synthesis

Affiliations

A tRNA modification with aminovaleramide facilitates AUA decoding in protein synthesis

Kenjyo Miyauchi et al. Nat Chem Biol. 2025 Apr.

Abstract

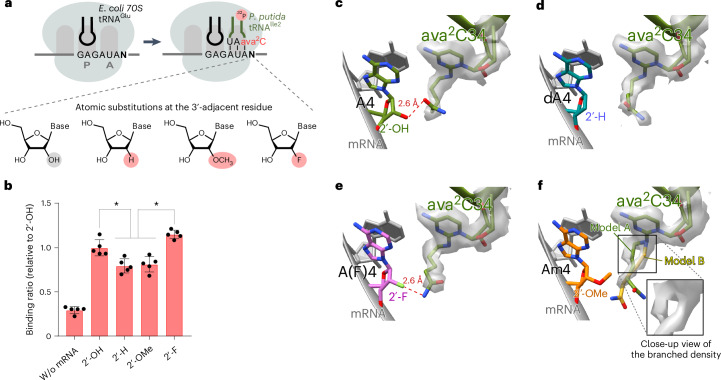
Modified tRNA anticodons are critical for proper mRNA translation during protein synthesis. It is generally thought that almost all bacterial tRNAsIle use a modified cytidine-lysidine (L)-at the first position (34) of the anticodon to decipher the AUA codon as isoleucine (Ile). Here we report that tRNAsIle from plant organelles and a subset of bacteria contain a new cytidine derivative, designated 2-aminovaleramididine (ava2C). Like L34, ava2C34 governs both Ile-charging ability and AUA decoding. Cryo-electron microscopy structural analyses revealed molecular details of codon recognition by ava2C34 with a specific interaction between its terminal amide group and an mRNA residue 3'-adjacent to the AUA codon. These findings reveal the evolutionary variation of an essential tRNA modification and demonstrate the molecular basis of AUA decoding mediated by a unique tRNA modification.


Conflict of interest statement

Competing interests: All authors declare no competing interests.

Figures

Fig. 1
Fig. 1. N341 is a modified cytidine at position 34 of tRNAIle2 in plant organelles and bacteria.
a, Secondary structures of tRNAIle2 from spinach chloroplasts (left) and mitochondria (right). The modifications other than N341 in chloroplast tRNAIle2 were reported previously and confirmed by LC–MS analyses (Extended Data Fig. 2a,b and Supplementary Table 1a,b). For mitochondrial tRNAIle2, the modifications other than Ψ were mapped by LC–MS analysis (Extended Data Fig. 2c and Supplementary Table 1c). b, LC–MS analysis of RNase A digests of spinach chloroplast tRNAIle2. The BPC (top) and XICs for L-containing (middle) and N341-containing (bottom) fragments are shown. c, CID spectrum of the N341-containing fragment of spinach chloroplast tRNAIle2 digested by RNase A. The product ions are indicated on the CID spectrum and assigned to the corresponding sequence. d, Nucleoside analyses of total RNA from various plants and bacterial species. The UV trace (top) and mass chromatograms detecting proton adducts of N341(middle) and L (bottom) are shown. The red arrows indicate the N341 peaks, and the blue arrows indicate the lysidine peaks. e, LC–MS analysis of RNase T1 digests of C. merolae chloroplast tRNAIle2. The BPC (top) and XICs for N341-containing (second), L-containing (third) and C-containing (bottom) fragments are shown. f. Nucleoside analysis of E. coli and V. cholerae tRNAIle2. MRM chromatograms detecting L (m/z 372 > 240) and N341 (m/z 342 > 210) are shown. g, LC–MS co-injection analyses of bacterial and plant N341. N341 from V. cholerae (top) and plants (middle), and a co-injected sample (bottom) were analyzed by HILIC (left) and ODS columns (right). XICs detecting N341 (m/z 342.2) are shown. BPC, base peak chromatogram; XICs, extracted ion chromatograms.
Fig. 2
Fig. 2. N341 is a modified cytidine conjugated with 5-AVA.
a, Involvement of TilS in N341 biogenesis in V. cholerae. LC–MS analysis of total nucleosides from the V. cholerae strain (TilS expression is controlled by the arabinose promotor) cultured in the presence (top) or absence (bottom) of arabinose. MRM chromatograms detecting N341 (m/z 342 > 210), L (m/z 372 > 240) and queuosine (m/z 410 > 295) are shown. b, Metabolic labeling of N341 with stable isotope-labeled lysine. LC–MS analyses of total nucleosides from V. cholerae cells cultured in M9 medium (left) and M9 medium supplemented with full-labeled Lys (13C6,15N2-lysine; middle) and one carbon-labeled Lys (1-13C-lysine; right). XICs detecting proton adducts of N341 nucleoside with different isotopes as indicated on the right are shown. Asterisks represent labeled carbon and nitrogen atoms of Lys. c, Chemical structure (imine isomer) of ava2C. d, CID spectrum of the spinach N341 base moiety (BH2+) with parent m/z 210. The daughter ions are assigned on the ava2C base. e, Mass (left) and CID (right) spectra of N341 nucleoside in D2O solution. Eight and six exchangeable protons, including a proton for ionization, are assigned on the ava2C nucleoside (left) and its base moiety (right), respectively. The asterisk indicates a non-specific signal not derived from the D-labels. f, Schematic representation of the chemical synthesis of the ava2C nucleoside (see Methods for details). g, LC–MS co-injection analyses with chemically synthesized ava2C. Spinach N341 (top), chemically synthesized ava2C (middle) and a co-injected sample (bottom) were analyzed by an ODS column. h, LC–MS co-injection analyses with enzymatically synthesized ava2C. Spinach N341 (top), enzymatically synthesized ava2C (TilS + 5-AVA; middle) and a co-injected sample (bottom) were analyzed by an ODS column. i, Proposed biosynthetic pathway of ava2C. First, C34 is converted to L34 catalyzed by TilS using Lys and ATP as substrates. Second, L34 is further converted to ava2C by an unidentified enzyme(s).
Fig. 3
Fig. 3. ava2C promotes AUA decoding in translation.
a, Schematic representation of the enzymatic synthesis of E. coli tRNAIle2 transcripts bearing t6A37 and L34 or ava2C34. b, In vitro isoleucylation of tRNA transcripts bearing C34 (circles), L34 (rectangles) or ava2C34 (triangles). c, Schematic depiction of tRNA binding to the A-site of the E. coli ribosome. The P-site was occupied by E. coli tRNAGlu, followed by incubation with 32P-labeled tRNA transcripts with different modification statuses. d, Ribosome-binding ability of E. coli tRNAIle2 transcripts bearing C34, L34 or ava2C34 to examine decoding of the AUA (filled bars) or AUG (blank bars) codon at the A-site. The background signal measured in the same reaction without mRNA was subtracted. Data are shown as mean ± s.d. (n = 3 technical replicates). e, Constructs of dual reporters to measure the decoding efficiency of Ile codons (AUA or AUC) in the V. cholerae strain. Ile codons (AUA or AUC) were tandemly inserted at the N-terminus of GFP. GFP signals normalized by mCherry signals reflect the translation efficiency of Ile codons. f, Dual reporter assay evaluating the decoding efficiency of AUC or AUA codons in the V. cholerae strain cultured with 0.2% or 0.02% arabinose. Relative values of GFP/mCherry are shown as mean ± s.d. (n = 3 biological replicates). A multiple two-tailed t test was used for a statistical test. Comparisons are made between arabinose 0.2% and 0.02%. P = 0.44 (AUC reporter) and P = 0.000078 (AUA reporter) after adjustment by the Holm test. Source data
Fig. 4
Fig. 4. Cryo-EM structural analysis of AUA decoding by ava2C34.
a, Atomic model of the E. coli 70S ribosome bound with mRNA (gray) and P. putida tRNAsIle2 at the P-site (blue) and A-site (green). b, Base pairing geometry of ava2C34 recognizing A3 of the AUA codon. The cryo-EM map (contoured at level 0.0277) is superimposed on the atomic models. c, Comparison of base pairing geometries between C34–G3 (orange, PDB ID: 4V5R) and ava2C34–A3 (green). The cytosine of ava2C34 moves to its minor groove by 2.9 Å compared with the C34–G3 pair. d, Model structures of ava2C34 recognizing the AUA codon in the decoding center of the A-site. Potential hydrogen bonds and the distances are indicated by dotted lines and red text, respectively. e, Chemical structures of ava2C34 recognizing the AUA codon facilitated by the hydrogen bond between the amide group of ava2C and 2′-OH of the mRNA residue 3′-adjacent to the AUA codon. The carbonyl oxygen of ava2C forms a hydrogen bond with 2′-OH of N4 residue in this model. Potential hydrogen bonds are shown by dotted lines. f, Structural comparison of ava2C34–A3 (green) and L34–A3 (blue) pairs at the A-site. Rotation and movement of U4 in mRNA and A1196 in 16S rRNA between these two structures are illustrated by arrows. Hydrogen bonds are shown by dotted lines.
Fig. 5
Fig. 5. Characterization of AUA decoding by ava2C34 with synthetic mRNAs.
a, Schematic depiction of tRNA binding to the A-site of the E. coli ribosome using synthetic mRNAs with atomic substitutions at the fourth nucleotide (N)—unmodified (2′-OH, left), 2′-H (second), 2′-O-methyl nucleoside (2′-OMe, third) and 2′-F (right). The P-site was occupied by E. coli tRNAGlu, followed by incubation with 32P-labeled P. putida tRNAIle2 to examine AUA decoding upon 2′-OH substitutions at the fourth residue. b, Ribosome-binding ability of P. putida tRNAIle2 on the AUA codon of mRNAs with different 2′-OH substitutions at the fourth residue, namely, unmodified (2′-OH), 2′-H, 2′-OMe and 2′-F. Nonspecific tRNA binding was estimated without (w/o) mRNA. The binding ratio was calculated as the ratio of bound tRNA to input tRNA. Data are shown as mean ± s.d. (n = 5 technical replicates). Tukey’s adjusted P values are as follows: P = 0.002 (2′-OH versus 2′-H), P = 0.0048 (2′-OH versus 2′-OMe) and P < 0.0001 (2′-H versus 2′-F and 2′-OMe versus 2′-F). *P < 0.05. cf, Comparison of base pairing geometry and side chain orientation of ava2C34 upon binding to the AUA codon with different 2′-OH substitutions at the fourth residue—A4 (2′-OH, c), dA4 (2′-H, d), A(F)4 (2′-F, e) and Am4 (2′-OMe, f). On interacting with Am4 mRNA, the ava2C side chain represents the branched density, to which models A (green) and B (yellow) are assigned. Source data
Extended Data Fig. 1
Extended Data Fig. 1. Chemical structures of tRNA modifications required for AUA codon decoding.
The chemical structures of L (a), agm2C (b) and ava2C (c) are shown as their enamine isoforms.
Extended Data Fig. 2
Extended Data Fig. 2. LC–MS analyses of isolated tRNAs digested by RNases.
BPCs of RNA fragment analyses of spinach chloroplast tRNAIle2 digested by RNase A (a) and RNase T1 (b), and spinach mitochondrial tRNAIle2 digested by RNase T1 (c). The m/z value and charge state (z) of each fragment are listed in Supplementary Table 1a–c.
Extended Data Fig. 3
Extended Data Fig. 3. LC–MS analyses of anticodon-containing fragments.
XICs of the RNase T1-digested fragments of tRNAIle2 from spinach chloroplasts (a), spinach mitochondria (b), A. thaliana chloroplasts (c) and A. thaliana mitochondria (d). Anticodons containing fragments bearing N341, L or unmodified C are shown. Arrows show the target fragments. n.d., not detected.
Extended Data Fig. 4
Extended Data Fig. 4. Isolation and LC–MS analysis of C. merolae chloroplast tRNAIle2.
a, Secondary structure of C. merolae chloroplast tRNAIle2 including modified nucleosides. The modifications other than pseudouridine were determined in this study by LC–MS. b, Isolated C. merolae chloroplast tRNAIle2 was resolved by 10% PAGE with 7 M urea, stained with SYBR Gold and visualized by a FLA-7000 scanner (Fujifilm). c, LC–MS analysis (BPC) of C. merolae chloroplast tRNAIle2 digested by RNase T1. RNA fragments with their m/z values and charge states (z) are shown in Supplementary Table 1d. Source data
Extended Data Fig. 5
Extended Data Fig. 5. Quantification of modified nucleosides in E. coli and V. cholerae tRNAs.
The relative abundances of modified nucleosides in E. coli and V. cholerae tRNAs were measured by QQQ LC–MS. In each nucleoside, an area value of mass chromatograms was normalized by a sum of the A, U, G and C area values. The higher value was set as 100%. The bars and error bars indicate the average and standard deviation from three independent cultures, respectively. Source data
Extended Data Fig. 6
Extended Data Fig. 6. Distribution of N341 and L in diverse organisms.
LC–MS nucleoside analyses of tRNA fractions from organisms with (a) and without (b) N341. The relative abundances were normalized by the highest intensity of N341 (a) or one-tenth of methyl-G (b) signals in each organism.
Extended Data Fig. 7
Extended Data Fig. 7. NMR and UV analyses of chemically synthesized ava2C.
a, Purification of the chemically synthesized ava2C nucleoside by reverse-phase HPLC. The peak indicated by the arrow was collected. b, Chemical structure of ava2C. The atom names correspond to those on the NMR charts (ce). c,d, 1H NMR spectra of the chemically synthesized ava2C nucleoside in DMSO-d6 (c) and DMSO-d6 + D2O (d). The chemical shifts are shown in ppm using tetramethylsilane (TMS) or solvent (DMSO-d6) as an internal standard. Signals for protons x, y and z in DMSO-d6 disappeared in DMSO-d6 + D2O, indicating that protons x, y and z are solvent-exchangeable. e, 1H-1H COSY spectrum of chemically synthesized ava2C in DMSO-d6 + D2O. Cross-peaks between the assigned protons are indicated by dashed lines. f, Comparison of UV spectra of ava2C and L. The spectra were normalized at the maximum absorption wavelength. The two nucleosides showed almost identical spectra. g, UV spectra of synthetic ava2C in different pH solutions. Specifically, 50 mM sodium phosphate buffer (pH 2, 3 and 6–9), sodium acetate buffer (pH 4 and 5) and sodium borate buffer (pH 10) were used. Source data
Extended Data Fig. 8
Extended Data Fig. 8. Isolation and LC–MS analysis of P. putida tRNAIle2.
a, Secondary structure of P. putida tRNAIle2 including modified nucleosides determined in this study by LC–MS. The RNase T1-digested fragment containing the anticodon is highlighted in red. b, Isolated P. putida tRNAIle2 was resolved by 10% PAGE with 7 M urea, stained with SYBR Gold and visualized by a FLA-7000 scanner (Fujifilm). c, LC–MS nucleoside analysis of the isolated tRNA. The total ion chromatogram (TIC; top), UV trace (second) and mass chromatograms of ava2C nucleoside (M + H)+ (m/z 342.18, third) and its base-related ion BH2+ (m/z 210.14, bottom) are shown. d, LC–MS analysis of P. putida tRNAIle2 digested by RNase T1. The BPC (top) and XICs of the anticodon-containing fragments bearing ava2C34 and t6A37 (middle) and ava2C34 and ct6A37 (bottom) are shown. RNA fragments with their m/z values and charge states (z) are shown in Supplementary Table 1e. A nonspecific peak with the same m/z was marked with an asterisk. Source data
Extended Data Fig. 9
Extended Data Fig. 9. Cryo-EM image processing.
a, Scheme of cryo-EM image processing, which was performed in parallel for five 70S complexes described in this study. After 3D auto-refinement and 3D classification, the subclasses of 70S ribosomes with P-site tRNA density were pooled for 3D refinement to include all particles potentially bound with P. putida tRNAIle2 at the A-site. Focused classification was performed using an A-site mask to generate the final map of the complex occupied by tRNAs at both the A- and P-sites. b,c. Fourier shell correlation curves of the complexes (b) and models vs. cryo-EM maps (c). From left to right, P. putida tRNAIle2 on A4 mRNA, dA4 mRNA, Am4 mRNA and A(F)4 mRNA, and A- and P-sites P. putida tRNAsIle2 on U4 mRNA. d, Cryo-EM densities of tRNA and mRNA codon at A-site extracted from the ribosome complex corresponding to b and c. Each map is colored according to the local resolution, and the color key is drawn on the left.
Extended Data Fig. 10
Extended Data Fig. 10. Structural characterization of the ava2C–A pair on the ribosome and its comparison with other cytidine modifications.
a, Codon–anticodon interactions at P- and A-sites of the 70S ribosome. mRNA kinks by ~45° between P- and A-site codons. ava2C–A pairs are visible and common at both sites, but the density of the ava2C side chains is seen only at the A-site. b, Model structures of ava2C34 (left), L34 (middle) and agm2C34 (right) recognizing the AUA codon in the decoding center of the A-site. Potential H-bonds and the distances are indicated by dotted lines and red text, respectively. c, Hypothetical ava2C34–G3 pairing in a canonical Watson–Crick geometry. The aminovaleramide group of ava2C34 clashes with N2-amine of G3. d, Solvent-excluded surface models showing the structural complementarity of the long side chains of ava2C34 (left), L34 (middle) and agm2C (right), and the cleft formed by rRNA residues and the mRNA strand at the A-site. A large area of van der Waals contacts between ava2C34 and rRNA residues, and the mRNA is clearly visible. e, Another possible hydrogen bonding pattern of ava2C34 and mRNA residues.

References

    1. Cappannini, A. et al. MODOMICS: a database of RNA modifications and related information. 2023 update. Nucleic Acids Res.52, D239–D244 (2024). - PMC - PubMed
    1. Suzuki, T. The expanding world of tRNA modifications and their disease relevance. Nat. Rev. Mol. Cell Biol.22, 375–392 (2021). - PubMed
    1. Grosjean, H. (ed.). Fine-Tuning of RNA Functions by Modification and Editing Vol. 12, pp. 23–69 (Springer-Verlag GmbH, 2005).
    1. Ohira, T. & Suzuki, T. Transfer RNA modifications and cellular thermotolerance. Mol. Cell84, 94–106 (2024). - PubMed
    1. Helm, M. & Motorin, Y. Detecting RNA modifications in the epitranscriptome: predict and validate. Nat. Rev. Genet.18, 275–291 (2017). - PubMed

Publication types

LinkOut - more resources