. 2024 Oct;16(10):2322-2348.
doi: 10.1038/s44321-024-00140-z. Epub 2024 Sep 19.

Liver protects neuron viability and electrocortical activity in post-cardiac arrest brain injury

Affiliations

Liver protects neuron viability and electrocortical activity in post-cardiac arrest brain injury

Zhiyong Guo et al. EMBO Mol Med. 2024 Oct.

Abstract

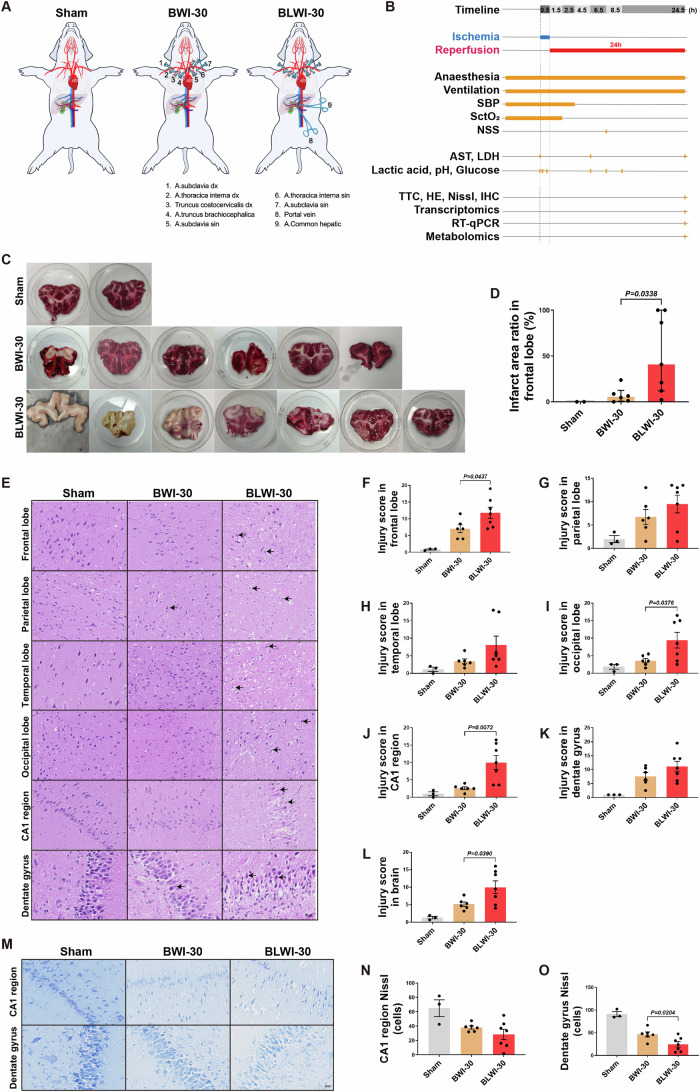
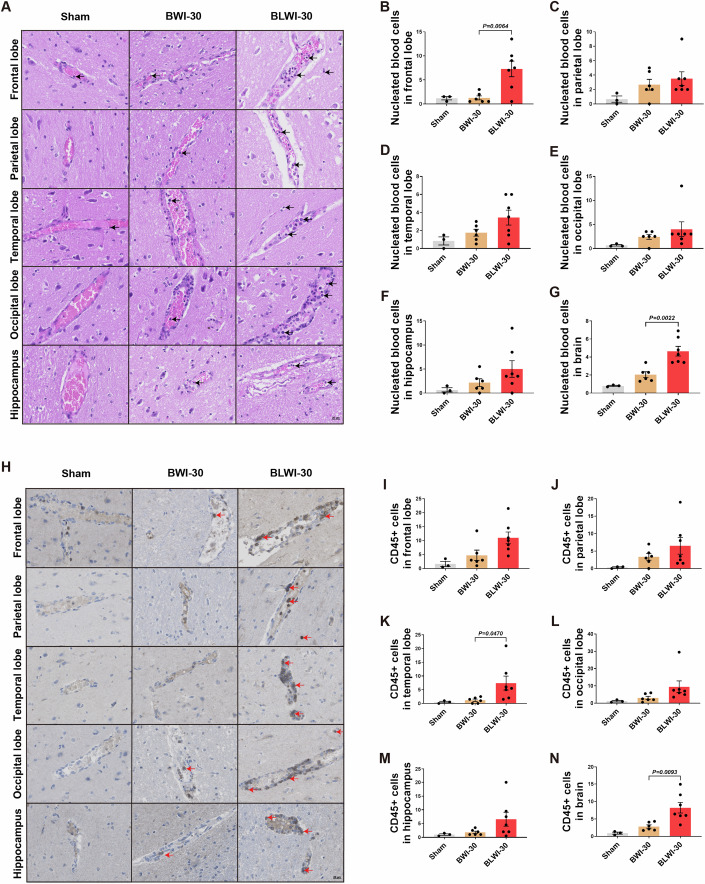
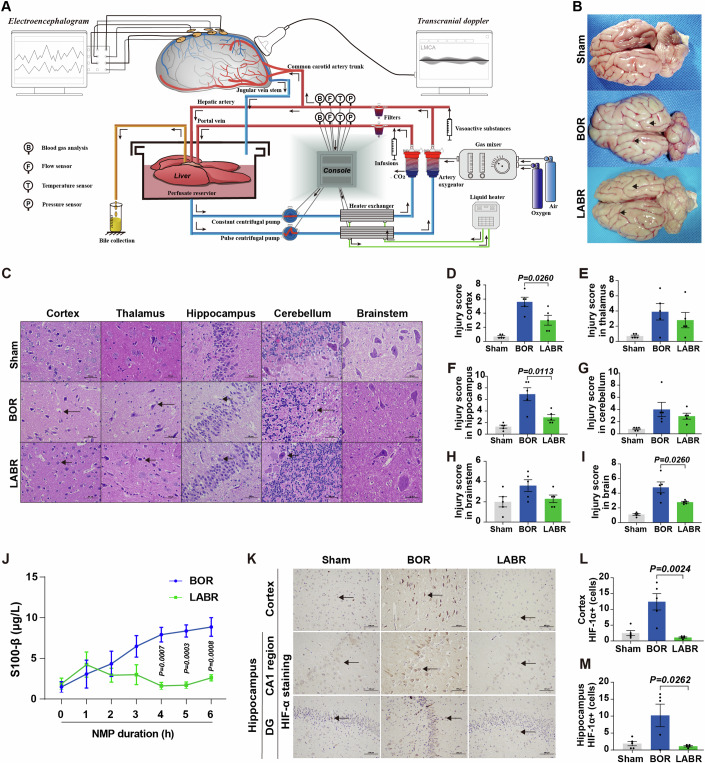
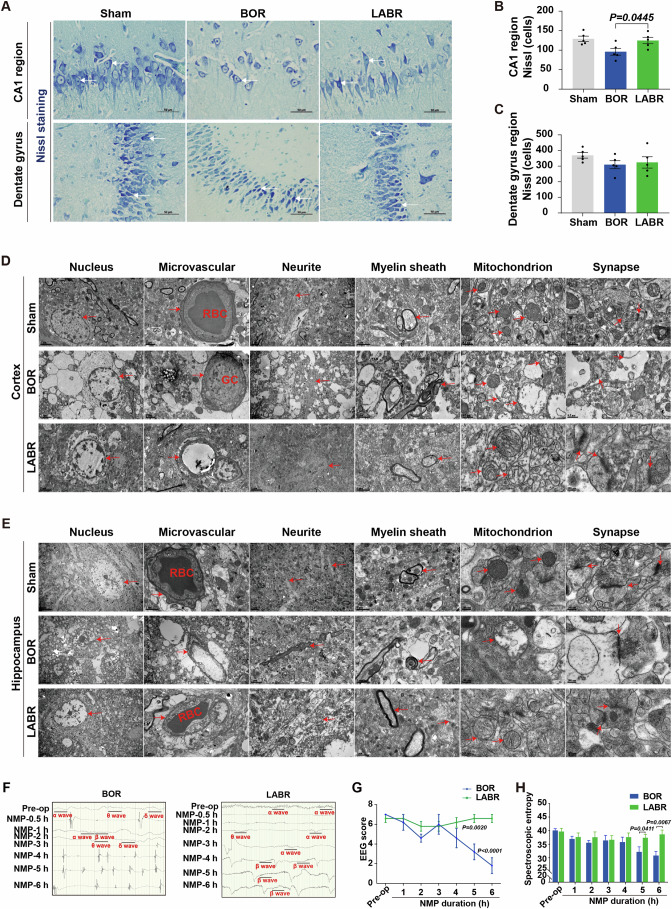
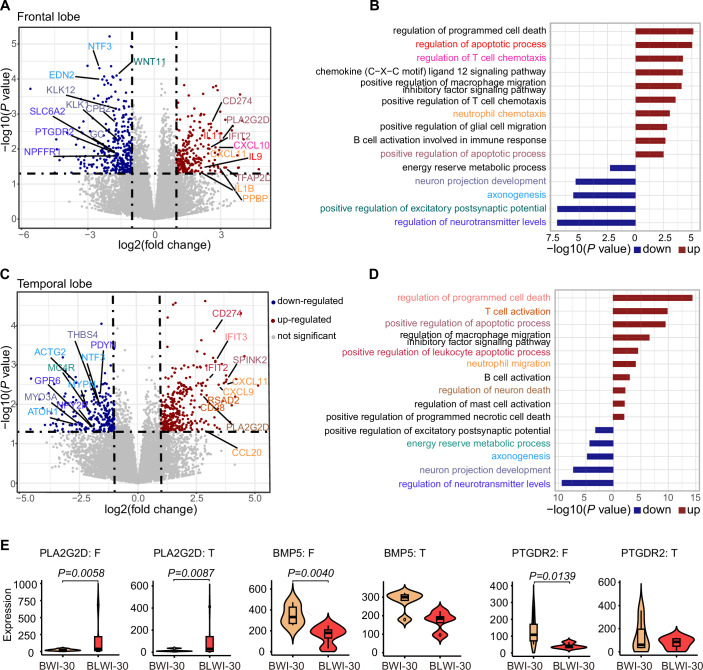
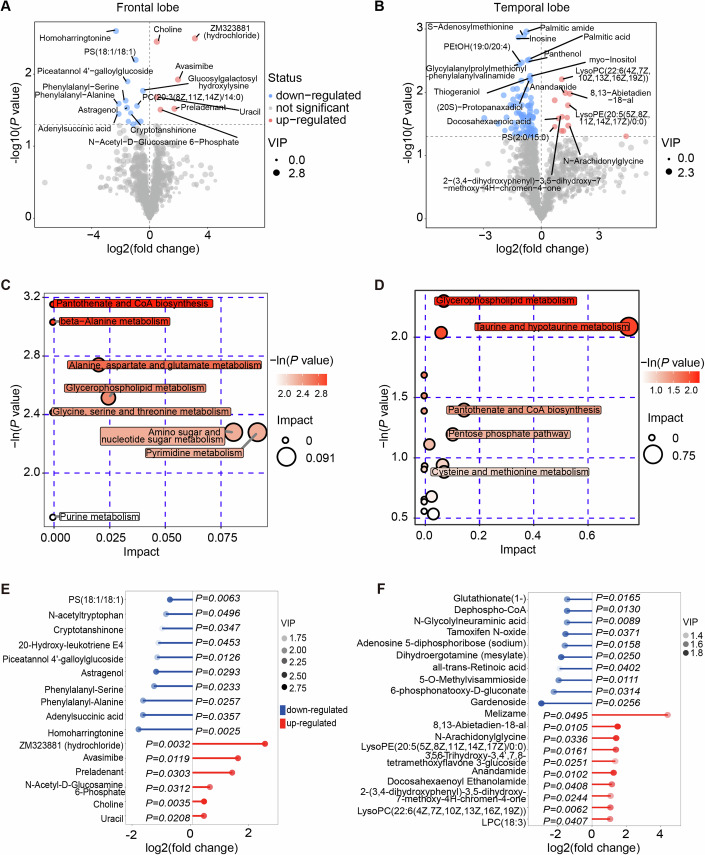
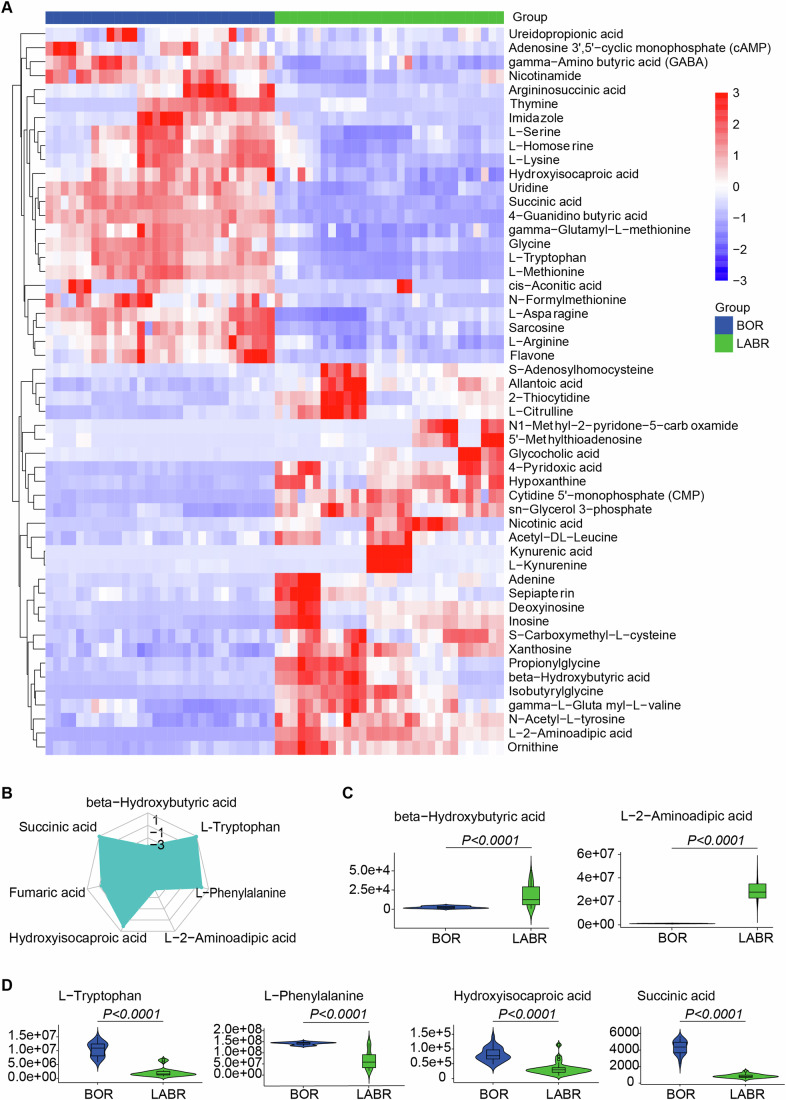
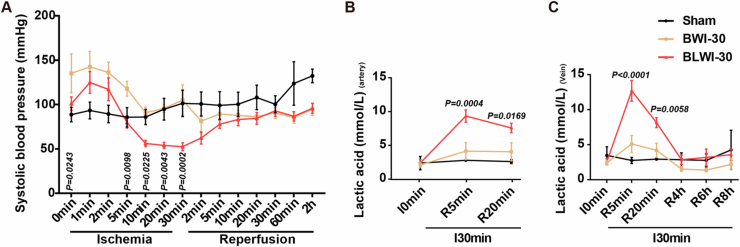
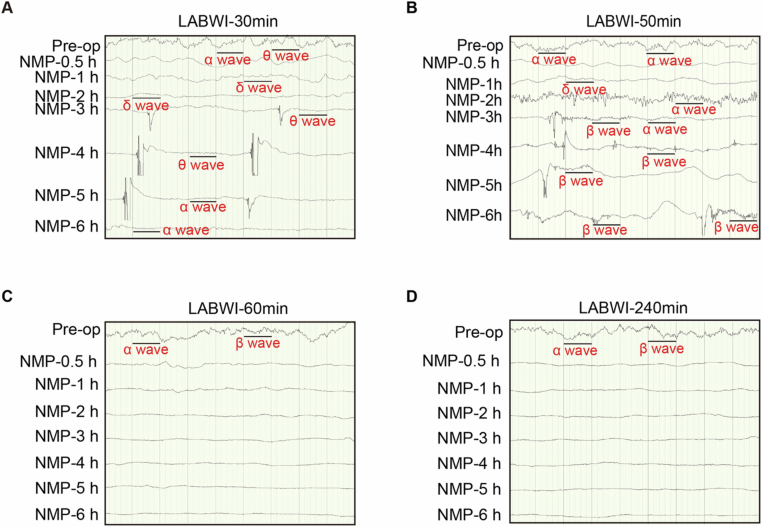
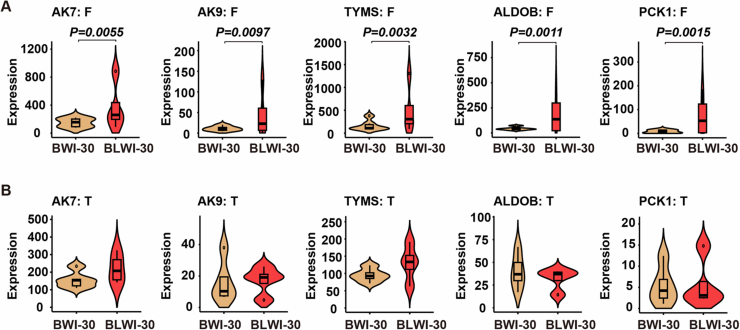
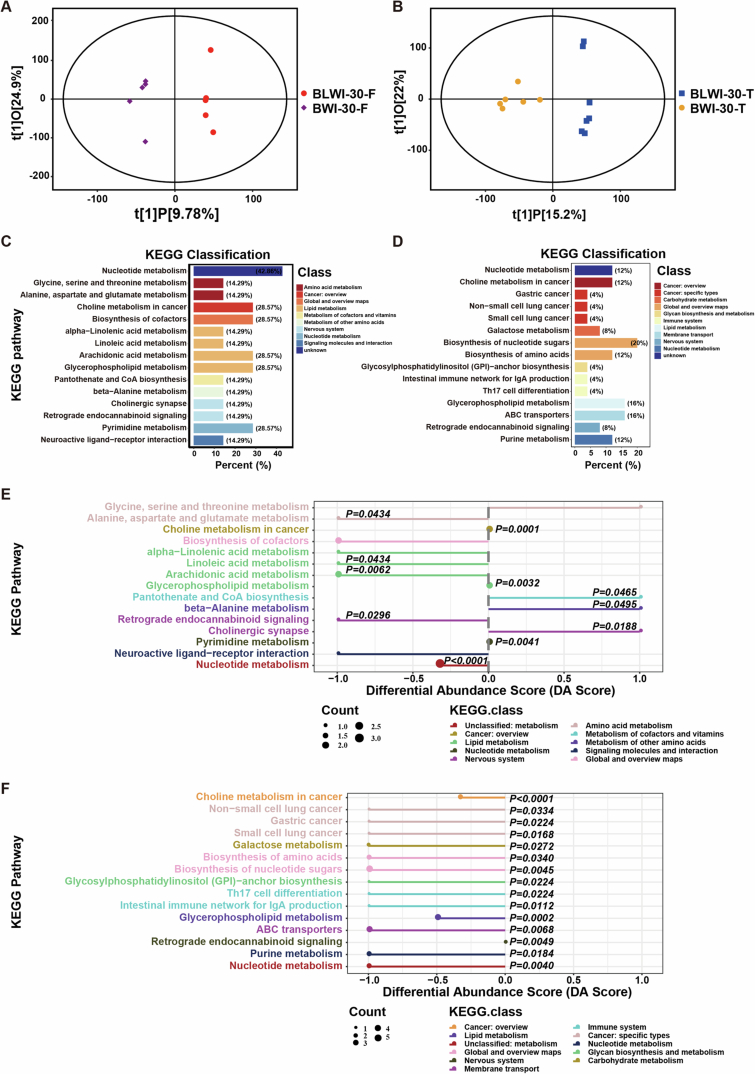
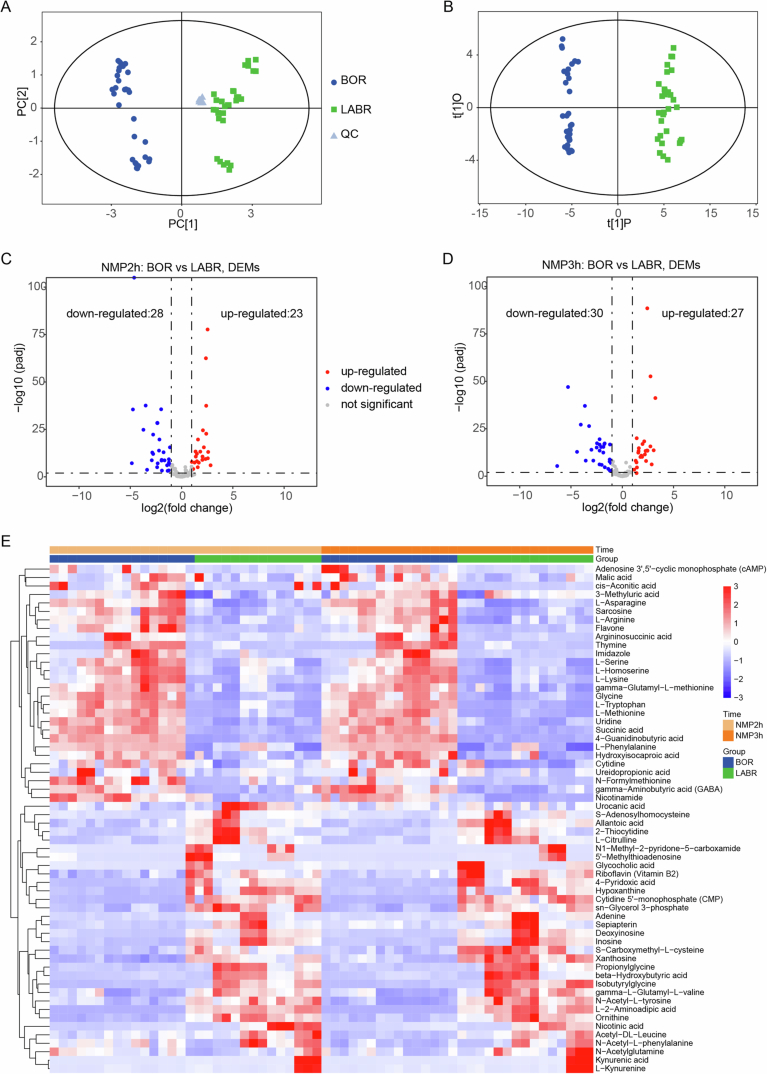
Brain injury is the leading cause of mortality among patients who survive cardiac arrest (CA). Clinical studies have shown that the presence of post-CA hypoxic hepatitis or pre-CA liver disease is associated with increased mortality and inferior neurological recovery. In our in vivo global cerebral ischemia model, we observed a larger infarct area, elevated tissue injury scores, and increased intravascular CD45+ cell adhesion in reperfused brains with simultaneous hepatic ischemia than in those without it. In the ex vivo brain normothermic machine perfusion (NMP) model, we demonstrated that addition of a functioning liver to the brain NMP circuit significantly reduced post-CA brain injury, increased neuronal viability, and improved electrocortical activity. Furthermore, significant alterations were observed in both the transcriptome and metabolome in the presence or absence of hepatic ischemia. Our study highlights the crucial role of the liver in the pathogenesis of post-CA brain injury.

Keywords: Brain Injury; Cardiac Arrest; Ketone Body Production; Liver Dysfunction; Normothermic Machine Perfusion.


Conflict of interest statement

The authors declare no competing interests.

Figures

Figure 1
Figure 1. Comparative analysis of brain injuries: greater severity in the BLWI-30 group compared to BWI-30.
(A) Schematic of the in vivo pig model of the Sham (no ischemia), BWI-30 (brain with 30-min warm ischemia), and BLWI-30 (brain and liver with 30-min warm ischemia) groups. (B) Timeline of the experimental workflow. SBP, systolic blood pressure; SctO2, cerebral tissue oxygen saturation; NSS, neurological severity scores; AST, aspartate transaminase; LDH, lactate dehydrogenase; TTC, triphenyl-tetrazolium chloride; HE, hematoxylin-eosin; IHC, immunohistochemistry; RT-qPCR, quantitative reverse transcription-polymerase chain reaction. (C) TTC staining of the frontal lobe. The white area indicates infarct tissue. (D) The infarct area ratio in the frontal lobe of three groups. Sham, n = 2; BWI-30, n = 6; BLWI-30, n = 7; unpaired two-tailed ratio Mann–Whitney test; histogram, median with interquartile range. (E) Hematoxylin and eosin staining of the frontal lobe, parietal lobe, temporal lobe, occipital lobe, CA1 region of hippocampus (100×), and dentate gyrus of hippocampus (200×). The black arrowhead pointed to the red neuron. (FL) The injury scores were calculated as the mean of two fields in the frontal lobe, parietal lobe, temporal lobe, occipital lobe, CA1 region of the hippocampus, and dentate gyrus of the hippocampus and the brain (average score of the frontal lobe, parietal lobe, temporal lobe, occipital lobe and hippocampus). (M) Nissl staining in the CA1 region (100×) and dentate gyrus (200×) of the hippocampus. (N, O) Live neuron counts of the two regions. (FL), (N, O) Sham, n = 3; BWI-30, n = 6; BLWI-30, n = 7; all replicates shown were biological replicates; Mean ± SEM, two-tailed ratio unpaired t-test. Source data are available online for this figure.
Figure 2
Figure 2. A greater number of intravascular CD45-positive cells were observed in the BLWI-30 group compared to the BWI-30 group in vivo.
(A) Hematoxylin-eosin staining showed vascular and nucleated blood cells in the frontal lobe, parietal lobe, temporal lobe, occipital lobe, and hippocampus of pigs (200×). The arrowhead pointed to nucleated blood cells. (BG) The number of nucleated blood cells per field in the brain (average number in the frontal lobe, parietal lobe, temporal lobe, occipital lobe, and hippocampus). (H) Immunofluorescence staining for CD45 in the frontal lobe, parietal lobe, temporal lobe, occipital lobe, and the hippocampus of pigs (200×). The arrowhead pointed to brown-yellow CD45+ cells. (IN) The mean number of CD45+ cells of two fields in the frontal lobe, parietal lobe, temporal lobe, occipital lobe, hippocampus or brain (average number of the frontal lobe, parietal lobe, temporal lobe, occipital lobe, and hippocampus). (BG), and (IN) Sham, no ischemia, n = 3; BWI-30, brain with 30-min warm ischemia, n = 6; BLWI-30, brain and liver with 30-min warm ischemia, n = 7; all replicates shown were biological replicates; Mean ± SEM, two-tailed ratio unpaired t-test. Source data are available online for this figure.
Figure 3
Figure 3. Liver-assisted NMP reduces cell damage and hypoxic injury in pig brains.
(A) Technologies employed in the liver-assisted brain normothermic machine perfusion (NMP) model. (B) Whole brain structure in the three groups. The surface of the brain with cerebral oedema and the narrowed sulci (lower arrowhead) and widened gyri (upper arrowhead), in the BOR group. The characteristics were minimal in the LABR group. BOR, brain-only control with rapid NMP; LABR, liver-assisted brain with rapid NMP. (C) Hematoxylin-eosin staining (400×) of the cerebral cortex, thalamus, hippocampus, cerebellum, and brainstem after 6 h of NMP (arrowheads pointing to the structures that indicate the neuronal shrinkage after suffering ischemia-reperfusion injury) in the five regions. (DI) The mean injury scores of two fields in the cerebral cortex, thalamus, hippocampus, cerebellum, brainstem or brain (average score of the cerebral cortex, thalamus, hippocampus, cerebellum, and brainstem). (J) The perfusate levels of S100-β. (K) Immunohistochemistry analysis of hypoxia inducible factor-1α (HIF-1α) indicating the degree of hypoxic injury in the hippocampus and cortex. The black arrowhead pointed to HIF-1α positive cells. DG, dentate gyrus. (L, M) Number of cells with upregulated expression of HIF-1α were counted in the cerebral cortex (L) and hippocampus (M). (DI, J, L, M) n = 5, Mean ± SEM; (DI, L, M) two-tailed ratio unpaired t-test; (J) 2-way ANOVA. All replicates shown were biological replicates. Source data are available online for this figure.
Figure 4
Figure 4. Improved neuronal viability and electrocortical activity with ex vivo liver-assisted brain NMP compared to brain-only NMP.
(A) Nissl staining (400×) shows the structural integrity of neuronal somas and axons in the hippocampus of pigs. The white arrowhead pointed to active neurons. BOR, brain-only control with rapid NMP; LABR, liver-assisted brain with rapid NMP. (B, C) Neurons with intact cell bodies were counted in the CA1 region (B) and dentate gyrus (C). (D, E) Transmission electron micrographs of the three groups in the pig cerebral cortex (D) and hippocampus (E). The arrowhead pointed to microvessels, neurites, myelin sheaths, mitochondria or synapses. RBC, red blood cell; GC, granulocyte. (F) Electroencephalography (EEG) results from a representative pig brain in the BOR and LABR groups. (G, H) The EEG scores (G) and spectroscopic entropy (H). (B, G, H) n = 5, Mean ± SEM; (B, H) Two-tailed ratio unpaired t-test; (G) 2-way ANOVA. All replicates shown were biological replicates. Source data are available online for this figure.
Figure 5
Figure 5. Transcriptomic differences between brain tissues with and without simultaneous hepatic ischemia by RNA-seq.
(A) Volcano plot displaying the differential genes in the frontal lobe of the pig brains with (BLWI-30 group) and without (BWI-30 group) simultaneous hepatic ischemia. Genes significantly upregulated or downregulated in the BLWI-30 group (P value < 0.05, log2(fold change) > 1) are represented in red and blue, respectively. Functional interest genes were annotated and labeled according to their functional terms, as shown in (B). (B) Bar plot illustrating GO enrichment of significant differential genes in the frontal lobe. Upregulated and downregulated genes were tested separately and represented in red and blue, respectively. GO terms were color-coded corresponding to (A). (C) Volcano plot depicting the differential genes in the temporal lobe of the brains of the two groups. Genes significantly upregulated or downregulated in the BLWI-30 group (P value < 0.05, log2(fold change) > 1) are represented in red and blue, respectively. Functional interest genes were annotated and labeled according to their functional terms, as shown in (D). (D) Bar plot displaying GO enrichment of significant differential genes in the temporal lobe. Upregulated and downregulated genes were tested separately and represented in red and blue, respectively. GO terms were color-coded to correspond with (C). (E) Violin plot showing gene expression (RPKM) in each biological replicate. The vertical lines (whiskers) connecting the box represented the maximum and minimum values. The box signified the upper (75th percentiles) and lower quartiles (25th percentiles). The central band inside the box represents the median (50th percentiles). Outliers were shown. F, frontal lobe; T, temporal lobe. (A, C, E) P values and log2(fold change) were calculated by the Wald test using the DESeq2 R package. (B, D) P values were calculated by the hypergeometric test using the MetaCore database. (AE) Frontal lobe: BWI-30, n = 6, BLWI-30, n = 4; temporal lobe: BWI-30, n = 5, BLWI-30, n = 4. All replicates shown were biological replicates. Source data are available online for this figure.
Figure 6
Figure 6. Metabolic differences in pig brain tissues with and without simultaneous hepatic ischemia by UHPLC-QTOFMS.
(A, B) Volcano plot illustrating the differential metabolites with secondary mass spectrometry (MS2) names in the frontal lobe (A) and temporal lobe (B) of the pig brains with and without simultaneous hepatic ischemia. Significant metabolic alterations (P value < 0.05, VIP > 1) were denoted in red or blue, respectively. (C, D) Bubble plot displaying the enriched metabolic pathways for increased metabolites in the frontal lobe and temporal lobe, respectively. The value on the x-axis and the size of the circle indicates the impact of the difference. The value on the y-axis and the color indicates the significance of enrichment in −ln(P). (E, F) Matchstick plot illustrating the top metabolic alterations with lowest P values in the frontal lobe (E) and temporal lobe (F). The x-axis displays the log2(fold change) of BLWI to BWI. Each item’s VIP score is denoted by color. (AF) Frontal lobe: BWI-30, n = 5, BLWI-30, n = 5; temporal lobe: BWI-30, n = 6, BLWI-30, n = 7. All replicates shown were biological replicates. P values were calculated by the t-test (A, B, E, F) and Fisher’s exact test (C, D) using the ggplot2 R package. Source data are available online for this figure.
Figure 7
Figure 7. Metabolic differences in the perfusate serum during ex vivo pig brain NMP with and without the support of a functioning liver.
(A) Heatmap displaying significantly differential metabolites (adjusted P value (Padj) < 0.05 and |log2(fold change)| > 1), represented by z-score across each row. The heatmap was generated with the pheatmap R package. (B) Radar chart illustrating the differences by metabolic groups. (C) Violin plot showing the signal for decreased metabolites in ex vivo brain normothermic machine perfusion (NMP) without the support of a functioning liver (decreased in the BOR group). (D) Violin plot showing the signal for increased metabolites in ex vivo brain NMP without the support of a functioning liver (increased in the BOR group). (C, D) The vertical lines (whiskers) connecting the box represented the maximum and minimum values. The box signified the upper (75th percentiles) and lower quartiles (25th percentiles). The central band inside the box represents the median (50th percentiles). Outliers were shown. Two-tailed ratio unpaired t-test. (AD) n = 5 pigs, triplicate perfusate samples for technical replicates in each pig. Source data are available online for this figure.
Figure EV1
Figure EV1. Systolic blood pressure and lactic acid levels in the global cerebral ischemia model.
(A) Systolic blood pressure of the pigs in the BWI-30 and BLWI-30 groups. (B, C) Lactic acid levels of the right mammary artery (B) and right external jugular vein (C) of the pigs in the BWI-30 and BLWI-30 groups. (AC) Sham, no ischemia, n = 3; BWI-30, brain with 30-min warm ischemia, n = 6; BLWI-30, brain and liver with 30-min warm ischemia, n = 7. All replicates shown were biological replicates. I, ischemia; R, reperfusion. Mean ± SEM, 2-way ANOVA analysis; BLWI-30 versus BWI-30.
Figure EV2
Figure EV2. Electrophysiological activity during ex vivo liver-assisted brain NMP.
(AD) Electroencephalography results of a representative pig brain in the liver-assisted brain groups, where normothermic machine perfusion (NMP) followed intervals of 30-, 50-, 60-, or 240 min. LABWI, liver-assisted brain groups in which brain NMP was preceded by 30–240 min of warm ischemia time; Pre-op, Pre-operation.
Figure EV3
Figure EV3. Differentially expressed genes involved in metabolic processes in the global cerebral ischemia model.
(A, B) Violin plot illustrating the expression (reads per kilobase per million, RPKM) of differential genes in each of the biological replicates in the frontal lobe (BWI-30, n = 6; BLWI-30, n = 4) (A) or temporal lobe (BWI-30, n = 5; BLWI-30, n = 4) (B) of pigs. All replicates shown were biological replicates. (A, B) The vertical lines (whiskers) connecting the box represented the maximum and minimum values. The box signified the upper (75th percentiles) and lower quartiles (25th percentiles). The central band inside the box represents the median (50th percentiles). Outliers were shown. P values were calculated by the Wald test using the DESeq2 R package.
Figure EV4
Figure EV4. Metabolome differences in pig brain tissues with and without simultaneous hepatic ischemia.
(A) Scatter plot depicting orthogonal projections to latent structures-discriminant analysis (OPLS-DA) results for the frontal lobe comparing the BLWI-30 and BWI-30 groups. (B) Scatter plot depicting the OPLS-DA data for the temporal lobe comparing the BLWI-30 and BWI-30 groups. (C, D) The bar plot displays the KEGG annotation of detected metabolites for the frontal lobe (C) and temporal lobe (D). The x-axis represents the percentage of identified metabolites in each KEGG class. (E, F) Depiction of overall changes in differential metabolites within a specific pathway for the frontal lobe (E) and temporal lobe (F). The Differential Abundance Score (DA Score) was calculated as the ratio of the difference between the upregulated metabolite count and the downregulated metabolite count on a specific pathway to the total count of metabolites on that pathway. (AF) Frontal lobe: BWI-30, n = 5, BLWI-30, n = 5; temporal lobe: BWI-30, n = 6, BLWI-30, n = 7. All replicates shown were biological replicates. P values were calculated by Fisher’s exact test (E, F) using the ggplot2 R package.
Figure EV5
Figure EV5. Metabolome differences in the perfusate serum during ex vivo pig brain NMP with and without a functioning liver support.
(A) Principal component analysis (PCA) showcasing the global variation within and between groups for the overall samples. (B) Scatter plot of orthogonal projections to latent structures-discriminant analysis (OPLS-DA) illustrating the differences between groups. (C, D) Volcano plot demonstrating the differential metabolites after 2 and 3 h of normothermic machine perfusion (NMP). (E) Heatmap displaying the z-score distribution of significantly different metabolites across various time points, with each row representing a metabolite. The heatmap was generated with the DESeq2 R package. (AE) n = 5 pigs in each group, triplicate perfusate samples for technical replicates in each pig. (C, D) P values were calculated by the Wald test using the DESeq2 R package.

References

    1. Al-Khatib (2018) 2017 AHA/ACC/HRS guideline for management of patients with ventricular arrhythmias and the prevention of sudden cardiac death: a Report of the American College of Cardiology/American Heart Association Task Force on Clinical Practice Guidelines and the Heart Rhythm Society. Heart Rhythm 15:E276–E277 - PubMed
    1. Allen BS, Ko Y, Buckberg GD, Sakhai S, Tan Z (2012) Studies of isolated global brain ischaemia: I. A new large animal model of global brain ischaemia and its baseline perfusion studies. Eur J Cardio-Thorac 41:1138–1146 - PMC - PubMed
    1. Atwood C, Eisenberg MS, Herlitz J, Rea TD (2005) Incidence of EMS-treated out-of-hospital cardiac arrest in Europe. Resuscitation 67:75–80 - PubMed
    1. Bateman RM, Sharpe MD, Jagger JE, Ellis CG, Solé-Violán J, López-Rodríguez M, Herrera-Ramos E, Ruíz-Hernández J, Borderías L, Horcajada J et al (2016) 36th International symposium on intensive care and emergency medicine. Crit Care 20:94 - PMC - PubMed
    1. Berdowski J, Berg RA, Tijssen JGP, Koster RW (2010) Global incidences of out-of-hospital cardiac arrest and survival rates: Systematic review of 67 prospective studies. Resuscitation 81:1479–1487 - PubMed