. 2024 Sep 19;7(1):1181.
doi: 10.1038/s42003-024-06873-4.

Lipophilic compounds restore function to neurodevelopmental-associated KCNQ3 mutations

Affiliations

Lipophilic compounds restore function to neurodevelopmental-associated KCNQ3 mutations

Michaela A Edmond et al. Commun Biol. .

Abstract

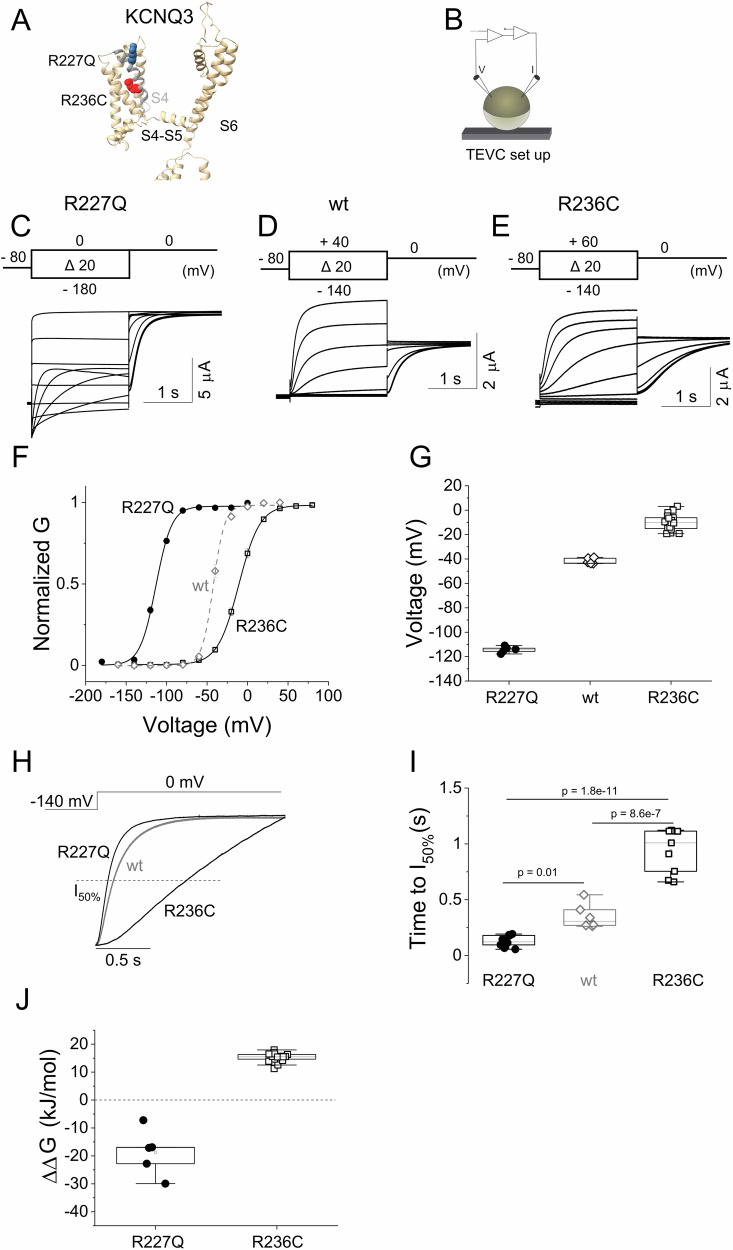
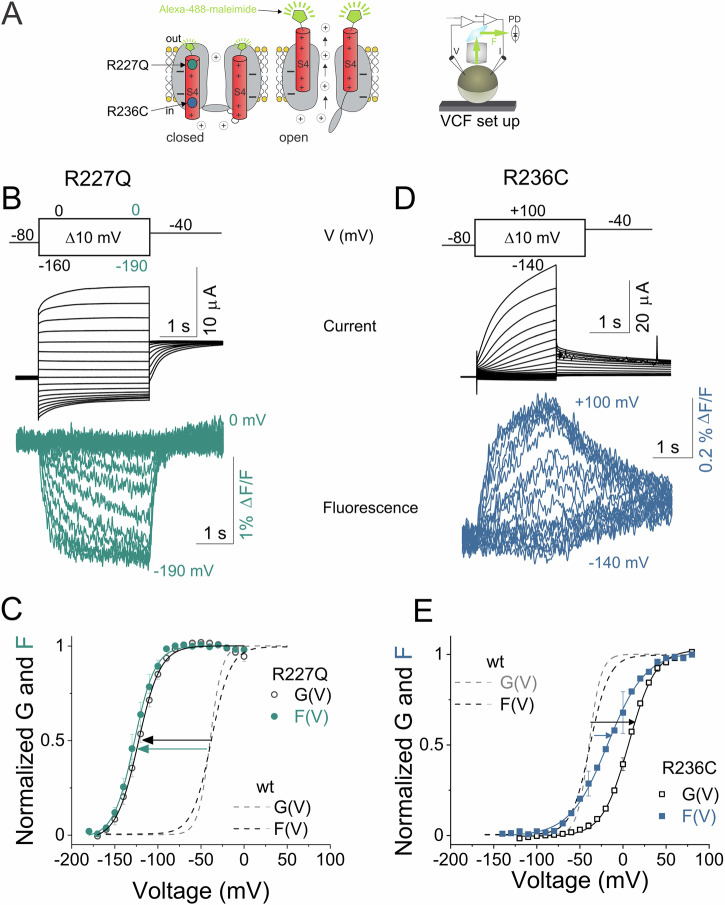
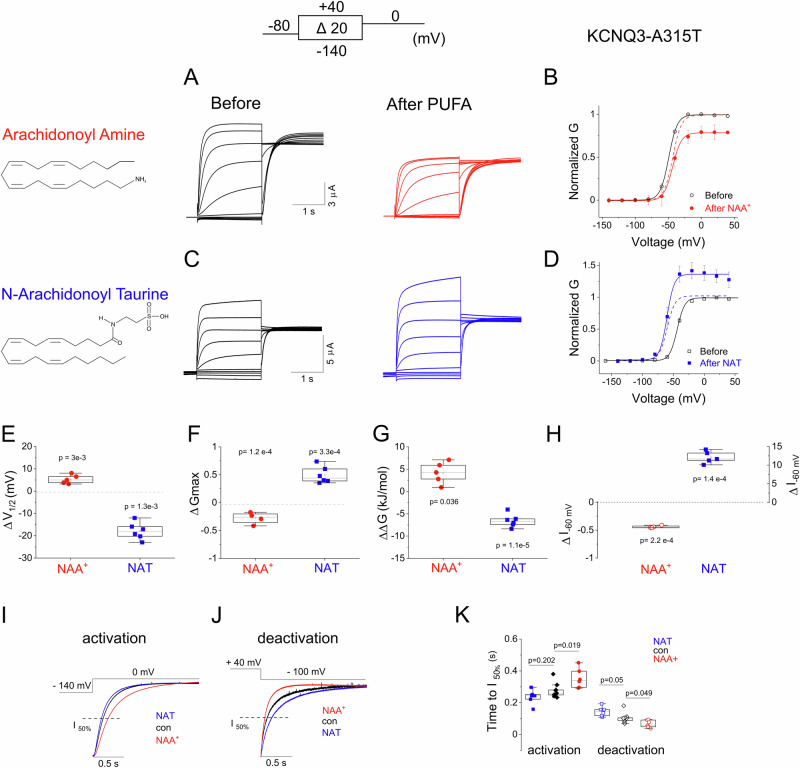
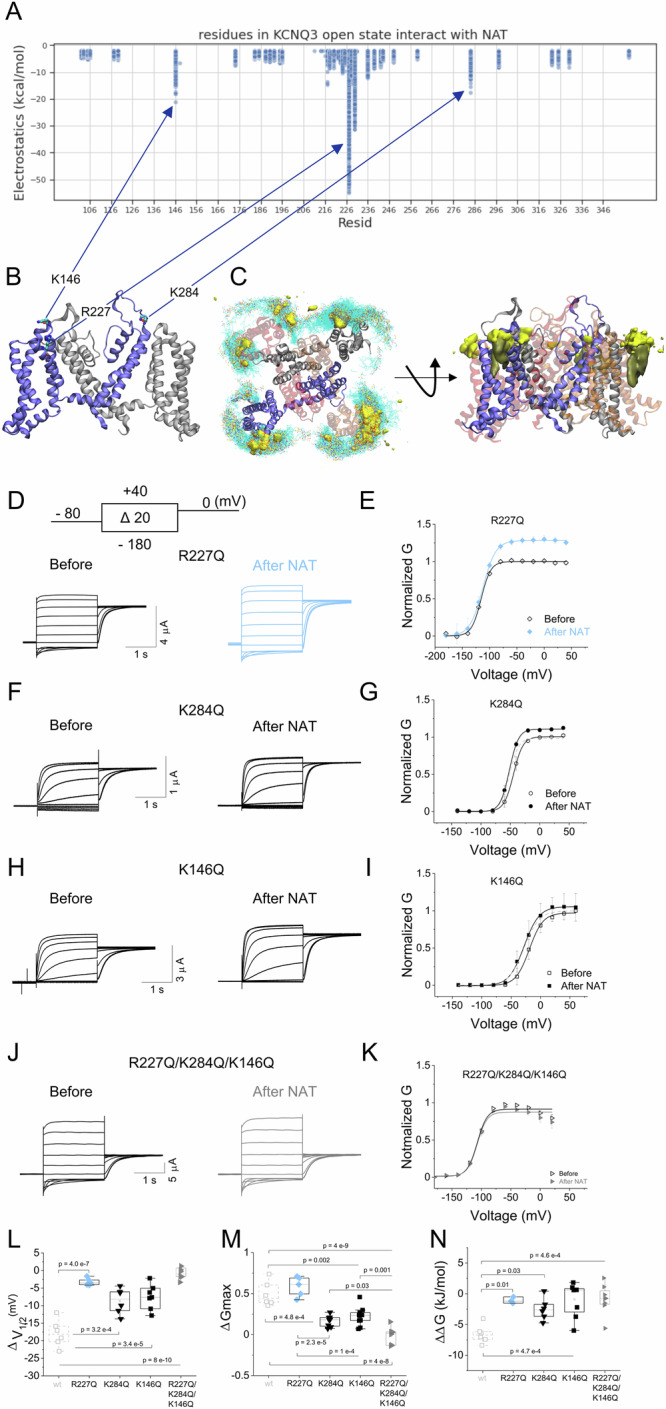
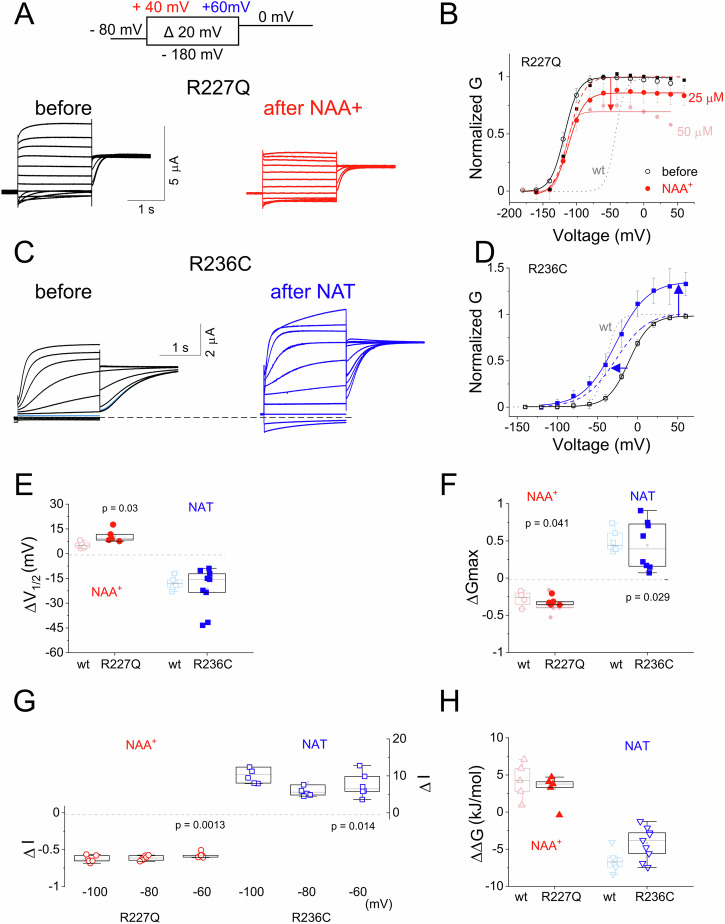
A major driver of neuronal hyperexcitability is dysfunction of K+ channels, including voltage-gated KCNQ2/3 channels. Their hyperpolarized midpoint of activation and slow activation and deactivation kinetics produce a current that regulates membrane potential and impedes repetitive firing. Inherited mutations in KCNQ2 and KCNQ3 are linked to a wide spectrum of neurodevelopmental disorders (NDDs), ranging from benign familial neonatal seizures to severe epileptic encephalopathies and autism spectrum disorders. However, the impact of these variants on the molecular mechanisms underlying KCNQ3 channel function remains poorly understood and existing treatments have significant side effects. Here, we use voltage clamp fluorometry, molecular dynamic simulations, and electrophysiology to investigate NDD-associated variants in KCNQ3 channels. We identified two distinctive mechanisms by which loss- and gain-of function NDD-associated mutations in KCNQ3 affect channel gating: one directly affects S4 movement while the other changes S4-to-pore coupling. MD simulations and electrophysiology revealed that polyunsaturated fatty acids (PUFAs) primarily target the voltage-sensing domain in its activated conformation and form a weaker interaction with the channel's pore. Consistently, two such compounds yielded partial and complete functional restoration in R227Q- and R236C-containing channels, respectively. Our results reveal the potential of PUFAs to be developed into therapies for diverse KCNQ3-based channelopathies.


Conflict of interest statement

Yun Lyna Luo is an Editorial Board Member for Communications Biology, but was not involved in the editorial review of, nor the decision to publish this article.

Figures

Fig. 1
Fig. 1. R227Q and R236C have distinct biophysical properties.
A Schematic of KCNQ3 channel highlighting residues analyzed in this study. B Schematic of recording setup for TEVC. Images in (A) and (B) were generated using UCSF ChimeraX, version 1.1 (2020-10-07) and CorelDraw Graphics Suite 2021 software, respectively. Representative current traces from KCNQ3-A315T-R227Q (R227Q) (C), KCNQ3-A315T (wt) (D), and KCNQ3-A315T-R236C (R236C) (E) channels for the indicated voltage protocols. F Extrapolated tail conductance from panels C, D, and E were normalized and plotted against test voltages to create G(V) curves (R227Q closed circles; wt open diamonds; R236C closed squares). Lines represent the fitted theoretical voltage dependencies (Eqs. 1 and 2). G Summary data for G(V) midpoints using Boltzmann fits from panel F. H Representative current time courses of R227Q, wt, and R236C channels in response to the indicated protocol. The dashed line represents 50% of maximum current at the end of the depolarizing pulse. I Time course of current activations quantified as the time to reach half maximum current at the end of the depolarizing pulse in (H, dashed line). J Summary of ΔΔG data (Eq. 5) for R227Q and R236C channels. Midpoints of voltage activation and ΔΔG values for each channel are shown in Supplementary Table 1 and Supplementary Data 1. Data presented as mean ± SEM, n = 5–11. Statistical significance determined using one-way ANOVA and Bonferroni’s post hoc test, p < 0.05.
Fig. 2
Fig. 2. R227Q and R236C affect channel function by different mechanisms.
A Schematic representing VCF technique. A cysteine introduced at position 218 (close to S4) is labeled with a fluorophore tethered to Alexa-488–5 maleimide. Upon voltage changes, labeled-S4s move and the environment around the tethered fluorophore changes, altering fluorescence intensity. Current and fluorescence are recorded simultaneously using the setup shown on the right. Location of the two NDD–associated mutations (R227Q and R2236C) are shown on the left. Cartoons in A were generated using CorelDraw Graphics Suite 2021 software. B Representative current (black) and fluorescence (cyan) traces from Alexa-488–labeled KCNQ3-A315T-R227Q (R227Q) channels for the indicated voltage protocol. C Normalized G(V) (black circles and black solid line from a Boltzmann fit) and F(V) (cyan circles and cyan solid line from a Boltzmann fit) curves from labeled R227Q. D Representative current (black) and fluorescence (blue) traces from Alexa-488–labeled KCNQ3-A315T-R236C (R236C) channels for the indicated voltage protocol. E Normalized G(V) (black squares and black solid line from a Boltzmann fit) and F(V) (blue squares and blue solid line from a Boltzmann fit) curves from labeled R236C. Dashed lines represent labeled pseudo-wt KCNQ3-A315T-Q218C G(V) (gray) and F(V) (black) curves for comparison (raw data shown in Supplementary Table 1, Supplementary Fig. 2, and Supplementary Data 1). Midpoints of voltage activation are shown in Supplementary Table 1 and Supplementary Data 1. Data represent mean ± SEM. n = 5–13.
Fig. 3
Fig. 3. PUFAs can activate or inhibit KCNQ3 channel function.
Representative current traces from KCNQ3-A315T channels in the absence (before) or presence (after) of 25 μM NAA+ (A) or NAT (C) for the indicated voltage protocol. B, D Steady-state G(V) curves (solid lines from a Boltzmann fit) obtained from recordings in panels A and C normalized to peak conductance before PUFA application (open symbols). G(V) relationships (solid lines from a Boltzmann fit) in the presence of PUFAs are shown as closed symbols and dashed lines represent their respective normalized G(V). Summary data for shifts in half-activation voltage (ΔV1/2) for each G(V) (E), increase in Gmax (ΔGmax) (F), ΔΔG (G), and relative change in potassium current at –60 mV (ΔI–60) (H) induced by 25 μM PUFAs on KCNQ3 channels. Dashed lines represent DMSO-induced changes for comparison. Representative time courses of current activation (I) and deactivation (J) in the absence (black) and presence of NAA+ (red) and NAT (blue) in KCNQ3-A315T channels in response to the indicated voltage protocol. Dashed lines represent 50% maximum current level at the end of the depolarizing pulse. K Time courses of current activation (closed symbols) and deactivation (open symbols) in the absence (black) and presence of NAA+ (red) and NAT (blue) quantified as time to reach half maximum current level at the end of the depolarizing pulse in (I and J, dashed lines). Values for V1/2, ΔV1/2, Gmax (Eq. 2), ΔΔG (Eq. 5), ΔI-60 (Eq. 3), and time to I50% given in Supplementary Table 2 and Supplementary Data 1. Data represent mean ± SEM; n = 6–9. Statistical significance determined using Student’s T-test to compare the PUFA–induced change in ΔV1/2, ΔGmax, ΔΔG, ΔI–60, and time to I50% relative to the mock application of a solution containing only vehicle (DMSO); only significant differences are shown. One-way ANOVA and Bonferroni’s post hoc test, containing the other 5 screened PUFAs and PUFA analogs in Supplementary Fig. 3, also gave p < 0.05 for NAA+ and NAT (see Supplementary Fig. 3).
Fig. 4
Fig. 4. PUFAs primarily target the KCNQ3 voltage sensor.
A MD simulation data showing pairwise electrostatic interaction between KCNQ3 active (S4 up) state and NAT. Data points represent the electrostatic interaction from one of 200 snapshots over 2 μs. Only favorable interactions < −2 kcal/mol are shown for clarity. B Top three binding residues illustrated on one of the KCNQ3 subunits. C Volumetric map of NAT density (headgroup in yellow and tail in cyan). In the view from above (left), positions of NAT within 10 A¨ of KCNQ3 from 800 snapshots over 2 μs were overlapped. Representative current traces from KCNQ3-A315T-R227Q (D), KCNQ3-A315T-K284Q (F), KCNQ3-A315T-K146Q (H), and KCNQ3-A315T-R227Q-K284Q-K146Q (J) channels in the absence (before) or presence (after) of 25 μM NAT for the indicated voltage protocol. (E, G, I, and K) Steady-state G(V) relationships (solid lines from a Boltzmann fit) obtained from recordings in panels D, F, H, and J normalized to peak conductance before (open symbols) and after (closed symbols) NAT application, respectively. Dashed lines represent respective normalized G(V) relationships. Summary data for ΔV1/2 (L); ΔGmax (M); and ΔΔG (N) induced by 25 μM NAT for the indicated KCNQ3 mutation. Gray dashed boxes represent NAT–induced change of ‘wt’ KCNQ3-A315T in L ΔV1/2, M ΔGmax, and N ΔΔG for comparison. Values are given in Supplementary Table 2 and Supplementary Data 1. Data represent mean ± SEM; n = 5–8. Statistical significance determined using one-way ANOVA and Bonferroni’s post hoc test to compare the NAT–induced change in ΔV1/2, ΔGmax, and ΔΔG. p < 0.05; only significant differences are shown.
Fig. 5
Fig. 5. PUFAs rescue NDD-associated mutations.
Representative current traces from R227Q (A) and R236C (C) channels in the absence (before) or presence (after) of 25 μM NAA+ (A, red) and NAT (C, blue) for the indicated voltage protocol. Steady-state G(V) relationships (solid lines from a Boltzmann fit) obtained from recordings in panels A and C normalized to peak conductance before (open symbols) and in the presence (closed symbols) of 25 μM and 50 μM NAA+ (B) and 25 μM NAT (D). Dotted gray lines represent G(V) curves for ‘wt’ KCNQ3-A315T channels and dashed lines represent respective normalized G(V) relationships after application of the indicated PUFA. Summary data for ΔV1/2 (E); ΔGmax (F); ΔI–60 (G); and ΔΔG (H) induced by 25 μM NAA+ (red) in R227Q channels and 25 μM NAT (blue) in R236C channels. Dashed lines represent DMSO-induced changes for comparison. Data represent mean ± SEM, n = 5–9. Values are given in Supplementary Table 2 and Supplementary Data 1. Statistical significance was determined using Student’s T-test to compare the PUFA–induced change in ΔV1/2, ΔGmax, ΔΔG, ΔI–60, and time to I50% relative to mock application of a solution containing only vehicle (DMSO) for the indicated mutation. p < 0.05; only significant differences are shown.
Fig. 6
Fig. 6. PUFAs act by modifying S4 movement and channel gating.
Representative current (top) and fluorescence (bottom) traces from Alexa-488–labeled KCNQ3L-R227Q (R227Q) (A) and KCNQ3L-R236C (R236C) (F) channels in the absence (before) or presence (after) of 25 μM NAA+ (red) and NAT (blue) for the indicated voltage protocol. Steady-state G(V) relationships (black circles and black solid line from a Boltzmann fit) and F(V) relationships obtained from recordings in panels A (red circles and red solid line from a Boltzmann fit) and F (blue squares and blue solid line from a Boltzmann fit), normalized to peak conductance and fluorescence before PUFA application (open symbols). Dotted and dashed-dotted lines represent G(V) and F(V) curves for untreated R227Q (B) and R236C (G) channels, respectively. Dashed lines represent respective normalized G(V) relationships after the application of the indicated PUFA. C, H Summary data for ΔV1/2 (black) and ΔF1/2 (red and blue) obtained from recordings in panels B and G. Representative time courses of fluorescence activation (top) and deactivation (bottom) in the absence (black) and presence of NAA+ (red) or NAT (blue) from KCNQ3L-R227Q (R227Q) (D) and KCNQ3L-R236C (R236C) (I) channels in response to the indicated voltage protocol. Dashed lines represent 50% of maximum fluorescence at the end of the pulse. E Time courses of fluorescence activation and deactivation in the absence (open black symbols) and presence (closed symbols) of NAA+ (red) or NAT (blue) are quantified as time to reach half maximum fluorescence at the end of the pulse (dashed lines). Values are given in Supplementary Data 1. Data represent mean ± SEM, n = 3–5. Statistical significance was determined using pair-sample Student’s t-test. p < 0.05; only significant differences are shown.

References

    1. Hille B. Ion Channels of Excitable Membranes. 3rd ed. Sunderland, MA: Sinauer Associates, INC; 2001.
    1. Jespersen, T., Grunnet, M. & Olesen, S. P. The KCNQ1 potassium channel: from gene to physiological function. Physiology20, 408–416 (2005). - PubMed
    1. Jentsch, T. J. Neuronal KCNQ potassium channels: physiology and role in disease. Nat. Rev. Neurosci.1, 21–30 (2000). - PubMed
    1. Abbott, G. W. & Pitt, G. S. Ion channels under the sun. FASEB J.28, 1957–1962 (2014). - PMC - PubMed
    1. Brown, D. A. & Adams, P. R. Muscarinic suppression of a novel voltage-sensitive K+ current in a vertebrate neurone. Nature283, 673–676 (1980). - PubMed

Publication types

MeSH terms

Substances