. 2024 Dec;23(12):1654-1663.
doi: 10.1038/s41563-024-02002-y. Epub 2024 Sep 19.

Two-dimensional crystalline platinum oxide

Affiliations

Two-dimensional crystalline platinum oxide

Jun Cai et al. Nat Mater. 2024 Dec.

Abstract

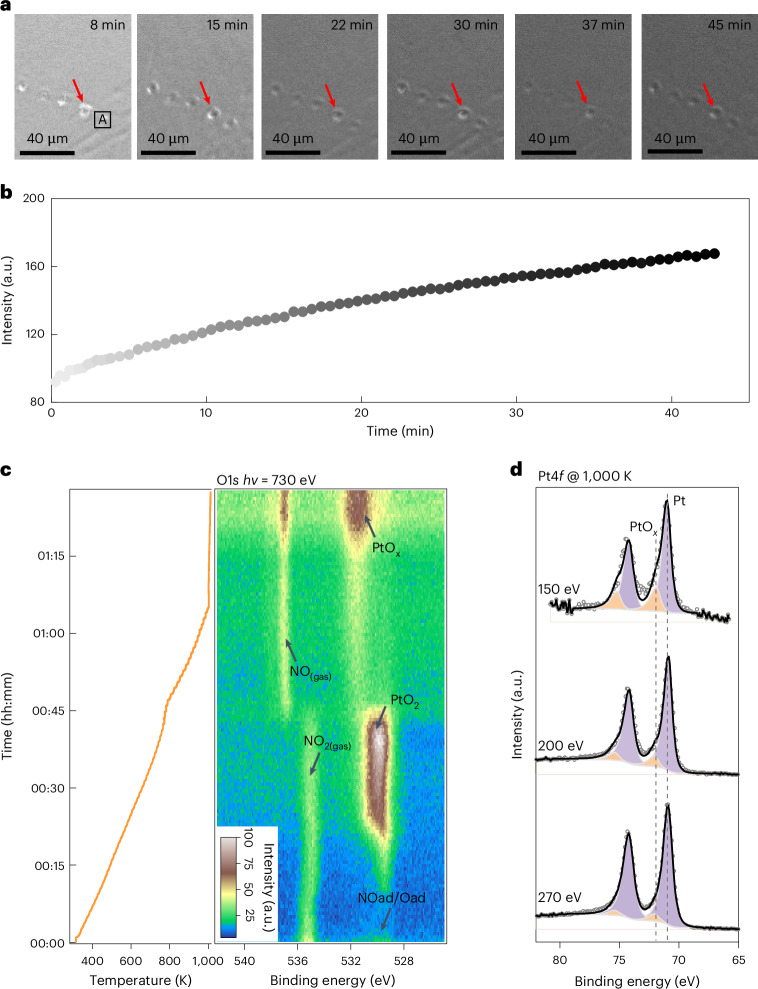
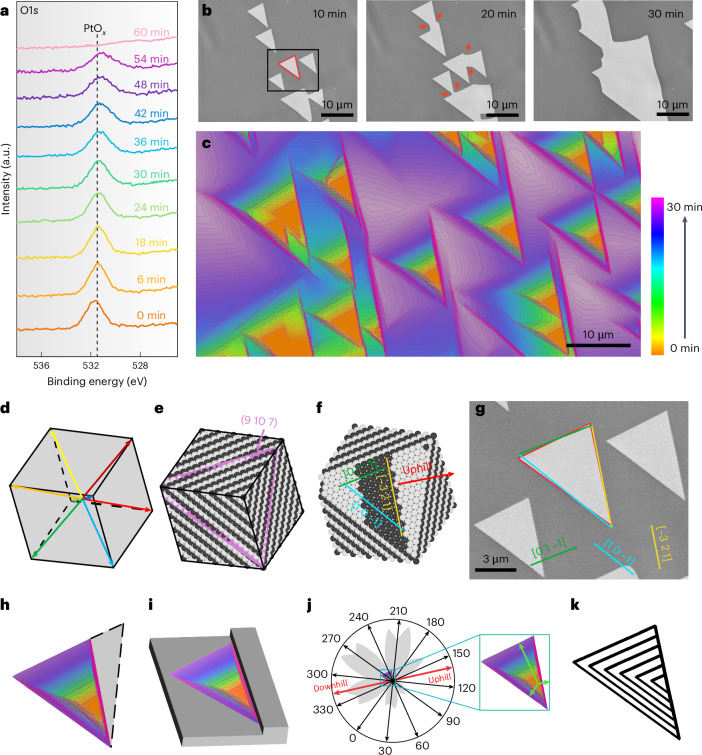
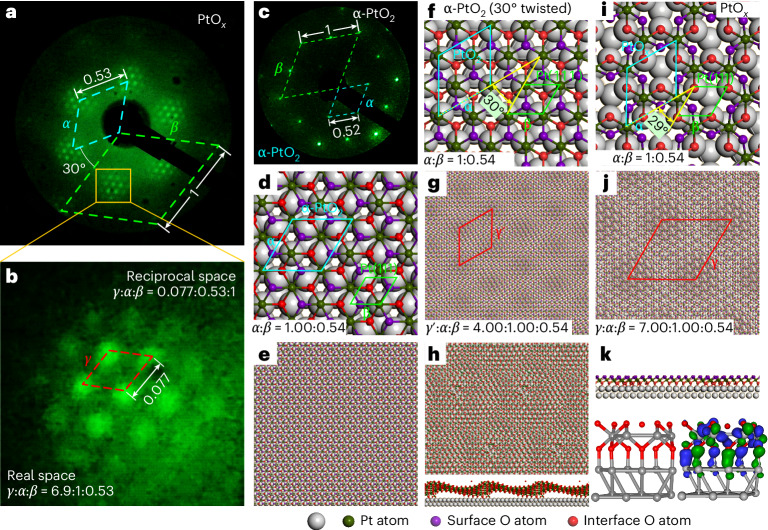
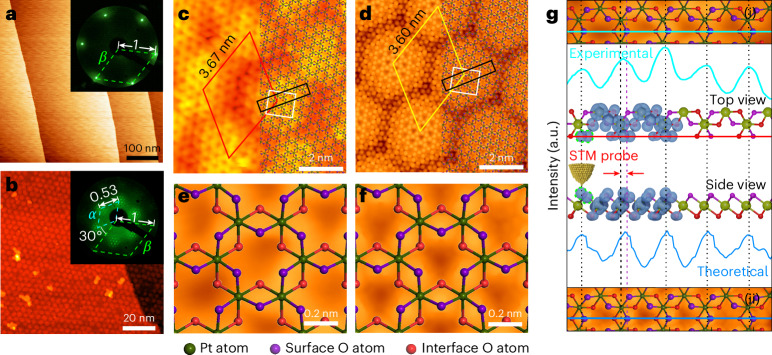
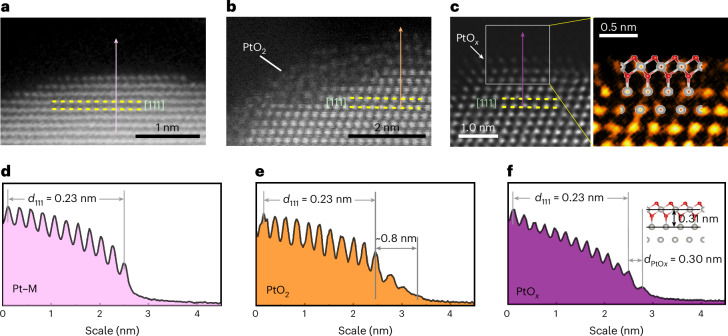
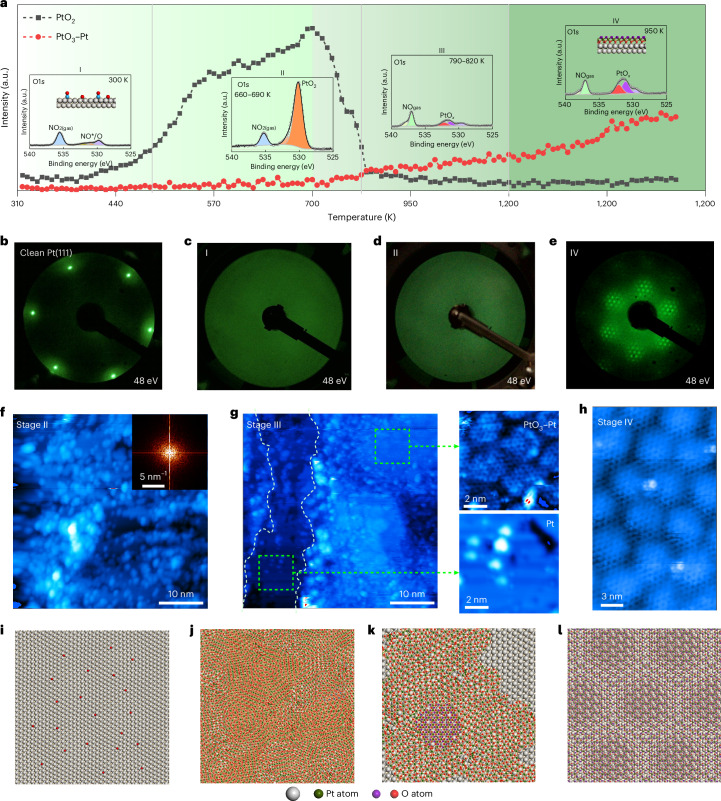
Platinum (Pt) oxides are vital catalysts in numerous reactions, but research indicates that they decompose at high temperatures, limiting their use in high-temperature applications. In this study, we identify a two-dimensional (2D) crystalline Pt oxide with remarkable thermal stability (1,200 K under nitrogen dioxide) using a suite of in situ methods. This 2D Pt oxide, characterized by a honeycomb lattice of Pt atoms encased between dual oxygen layers forming a six-pointed star structure, exhibits minimized in-plane stress and enhanced vertical bonding due to its unique structure, as revealed by theoretical simulations. These features contribute to its high thermal stability. Multiscale in situ observations trace the formation of this 2D Pt oxide from α-PtO2, providing insights into its formation mechanism from the atomic to the millimetre scale. This 2D Pt oxide with outstanding thermal stability and distinct surface electronic structure subverts the previously held notion that Pt oxides do not exist at high temperatures and can also present unique catalytic capabilities. This work expands our understanding of Pt oxidation species and sheds light on the oxidative and catalytic behaviours of Pt oxide in high-temperature settings.


Conflict of interest statement

Competing interests: The authors declare no competing interests.

Figures

Fig. 1
Fig. 1. Formation of PtOx layer on Pt(111) under NO2.
a, In situ SEM images obtained during the oxidation of Pt(111) by 1 mbar NO2 under 1,000 K. b, Change in intensity in region A (shown in a). c, Evolution of the O1s spectra during the oxidation process on a Pt(111) surface under 1 mbar NO2 from 300 to 1,000 K. d, Pt4f spectra of the PtOx collected with various photon energies, demonstrating that PtOx was located at the topmost surface. The red arrows indicate identical positions on the Pt surface. A complete oxidation process is shown in Supplementary Videos 1 and 2. Source data
Fig. 2
Fig. 2. H2 etching process of a PtOx layer.
a, Evolution of the O1s spectra of PtOx under 1 mbar H2 at 1,000 K; the spectra were collected under a photon energy of 1,486.6 eV. b, In situ SEM images recorded the etching behaviour of PtOx on a Pt(9 10 7) surface showing anisotropic evolution under 1 mbar H2 at 1,000 K (Supplementary Video 3). Note: the sequence of images shows the appearance of new edges at the concave corner during the coalescence of etching pits (highlighted by red arrows). c, Shape evolution of the etching pits during H2 etching, reproduced as the colour-coded superposition of outlines abstracted from images recorded at 53 s intervals. d, Orientation of the Pt substrate is determined by EBSD and presented in the Pt unit cell. The coloured arrows indicate the <111> directions for the unit cell. e, The corresponding ball model. f, Ball model of the unreconstructed (9 10 7) surface orientation of the underlying Pt grain. The yellow line highlights the surface step, with the uphill direction indicated by the red labelled arrow. g, Representative details of the vacancy islands (etching pits) in b. The shape of the vacancy islands almost perfectly overlaps the triangle surrounded by the stripes along [1 0 −1], [0 1 −1] and the line along the (9 10 7) surface step. h, Colour-coded shape evolution of an etching pit according to the growth time provided in the colour legend. The black dotted line indicates the missing half of the regular triangle shape. i, Schematic of the attachment of one of the vacancy island edges to the Pt step site. j, Shape evolution of the etching pits represented in polar coordinates shows anisotropic growth behaviour. Note: the initiation site of the etching pits is from the pole of the polar coordinates. k, Simulated kinetic Wulff construction of growth. Source data
Fig. 3
Fig. 3. Characterization of the PtOx layer.
a, LEED pattern of the surface covered with a PtOx layer. b, Enlarged image of the region in the yellow box in a. c, LEED pattern of the α-PtO2 overlayer on the Pt(111) surface. d,e, Schematic of the models for the α-PtO2 overlayer on Pt(111). f,g, Atomic model of the predicted structure of the PtOx film (30°-rotated α-PtO2). h, MD simulation of the stability of the rotated α-PtO2. i, Atomic structure after removing a Pt atom from the 30°-rotated α-PtO2. j, Formation of moiré pattern after structural relaxation. k, Cross-sectional view of the relaxed structure in j, depicting the interfacial bonding interactions between Pt and O. Source data
Fig. 4
Fig. 4. Real-space image of the PtO3–Pt structure.
a,b, STM images of the clean Pt(111) surface (a) and the fully covered PtO3–Pt layer (b). The insets in a and b are the corresponding LEED patterns. c, Atomic-resolution STM images of the PtO3–Pt layer. d, Simulated STM image of the PtO3–Pt layer based on the structure shown in Fig. 3j. e,f, Enlarged image of the white box in c (e) and d (f). g, The top and bottom panels show the enlarged image of the black box in c and d, respectively; the line profile is a comparison between the experimental (along the green line in g(i)) and theoretical (along the blue line in g(ii)) results; the middle panel is the electron density isosurface map from the top and side views. The LEED patterns were collected under the same energy (48 eV) and followed the same direction. Size and tunnelling parameters: (a) 500 nm × 500 nm, Vs = 50 mV, I = 1 nA; (b) 100 nm × 100 nm, Vs = 1.74 V, I = 0.07 nA; (c) 9.5 nm × 9.5 nm, Vs = 1.06 V, I = 0.07 nA. Source data
Fig. 5
Fig. 5. Direct observation of Pt oxidation by in situ STEM.
ac, STEM images of Pt nanoparticles under NO2 at 300 K (a), 620 K (b) and 1,000 K (c). The right panel in c is a magnified image of the grey-box area (c, left) together with a superimposed PtO3–Pt model. df, Intensity profiles of the arrow-marked regions in a (d), b (e) and c (f). Source data
Fig. 6
Fig. 6. Evolution process from Pt to PtO3–Pt.
a, O1s peak area evolution of PtO2 and PtO3–Pt in Fig. 1c as a function of temperature. The insets show the O1s spectra under different stages. b, LEED pattern of the clean Pt(111) surface. ce, Corresponding LEED patterns at stage I (c), stage II (d) and stage IV (e). f,g, STM images collected at stage II (f) and stage III (g) in a. il, Atomic models during the oxidation process. Tunnelling parameters: (f) Vs = 500 mV, I = 0.14 nA; (g) Vs = 1.5 V, I = 0.21 nA; g(i) Vs = 1.5 V, I = 0.21 nA; g(ii) Vs = 1.5 V, I = 0.21 nA; (h) Vs = 2.6 V, I = 0.18 nA. Source data

References

    1. Tian, N., Zhou, Z.-Y., Sun, S.-G., Ding, Y. & Wang, Z. L. Synthesis of tetrahexahedral platinum nanocrystals with high-index facets and high electro-oxidation activity. Science316, 732–735 (2007). - PubMed
    1. Kašpar, J., Fornasiero, P. & Hickey, N. Automotive catalytic converters: current status and some perspectives. Catal. Today77, 419–449 (2003).
    1. Chmielarz, L. & Jabłońska, M. Advances in selective catalytic oxidation of ammonia to dinitrogen: a review. RSC Adv.5, 43408–43431 (2015).
    1. Park, S., Vohs, J. M. & Gorte, R. J. Direct oxidation of hydrocarbons in a solid-oxide fuel cell. Nature404, 265–267 (2000). - PubMed
    1. Jones, J. et al. Thermally stable single-atom platinum-on-ceria catalysts via atom trapping. Science353, 150–154 (2016). - PubMed

LinkOut - more resources